![Market Maker X Model (MMXM) Indicator for MetaTrader 5 Download - Free - [TFlab]](https://cdn.tradingfinder.com/image/186125/4-8-en-mmxm-mt5-1.webp)
![Market Maker X Model (MMXM) Indicator for MetaTrader 5 Download - Free - [TFlab] 0](https://cdn.tradingfinder.com/image/186125/4-8-en-mmxm-mt5-1.webp)
![Market Maker X Model (MMXM) Indicator for MetaTrader 5 Download - Free - [TFlab] 1](https://cdn.tradingfinder.com/image/186116/4-8-en-mmxm-mt5-2.webp)
![Market Maker X Model (MMXM) Indicator for MetaTrader 5 Download - Free - [TFlab] 2](https://cdn.tradingfinder.com/image/186118/4-8-en-mmxm-mt5-3.webp)
![Market Maker X Model (MMXM) Indicator for MetaTrader 5 Download - Free - [TFlab] 3](https://cdn.tradingfinder.com/image/186117/4-8-en-mmxm-mt5-4.webp)
The Market Maker X Model Indicator (MMXM) is an analytical tool for identifying price behaviors and trend reversal zones. This indicator focuses on analyzing order flow and the influence of buyers and sellers on market structure, helping traders better understand liquidity movements and critical price levels.
MMXM Indicator Specifications
This table contains a summary of the details related to this indicator:
Indicator Categories: | Signal & Forecast MT5 Indicators Liquidity Indicators MT5 Indicators ICT MT5 Indicators |
Platforms: | MetaTrader 5 Indicators |
Trading Skills: | Intermediate |
Indicator Types: | Reversal MT5 Indicators |
Timeframe: | Multi-Timeframe MT5 Indicators |
Trading Style: | Day Trading MT5 Indicators |
Trading Instruments: | Forex MT5 Indicators Crypto MT5 Indicators Forward MT5 Indicators |
Overview of the Indicator
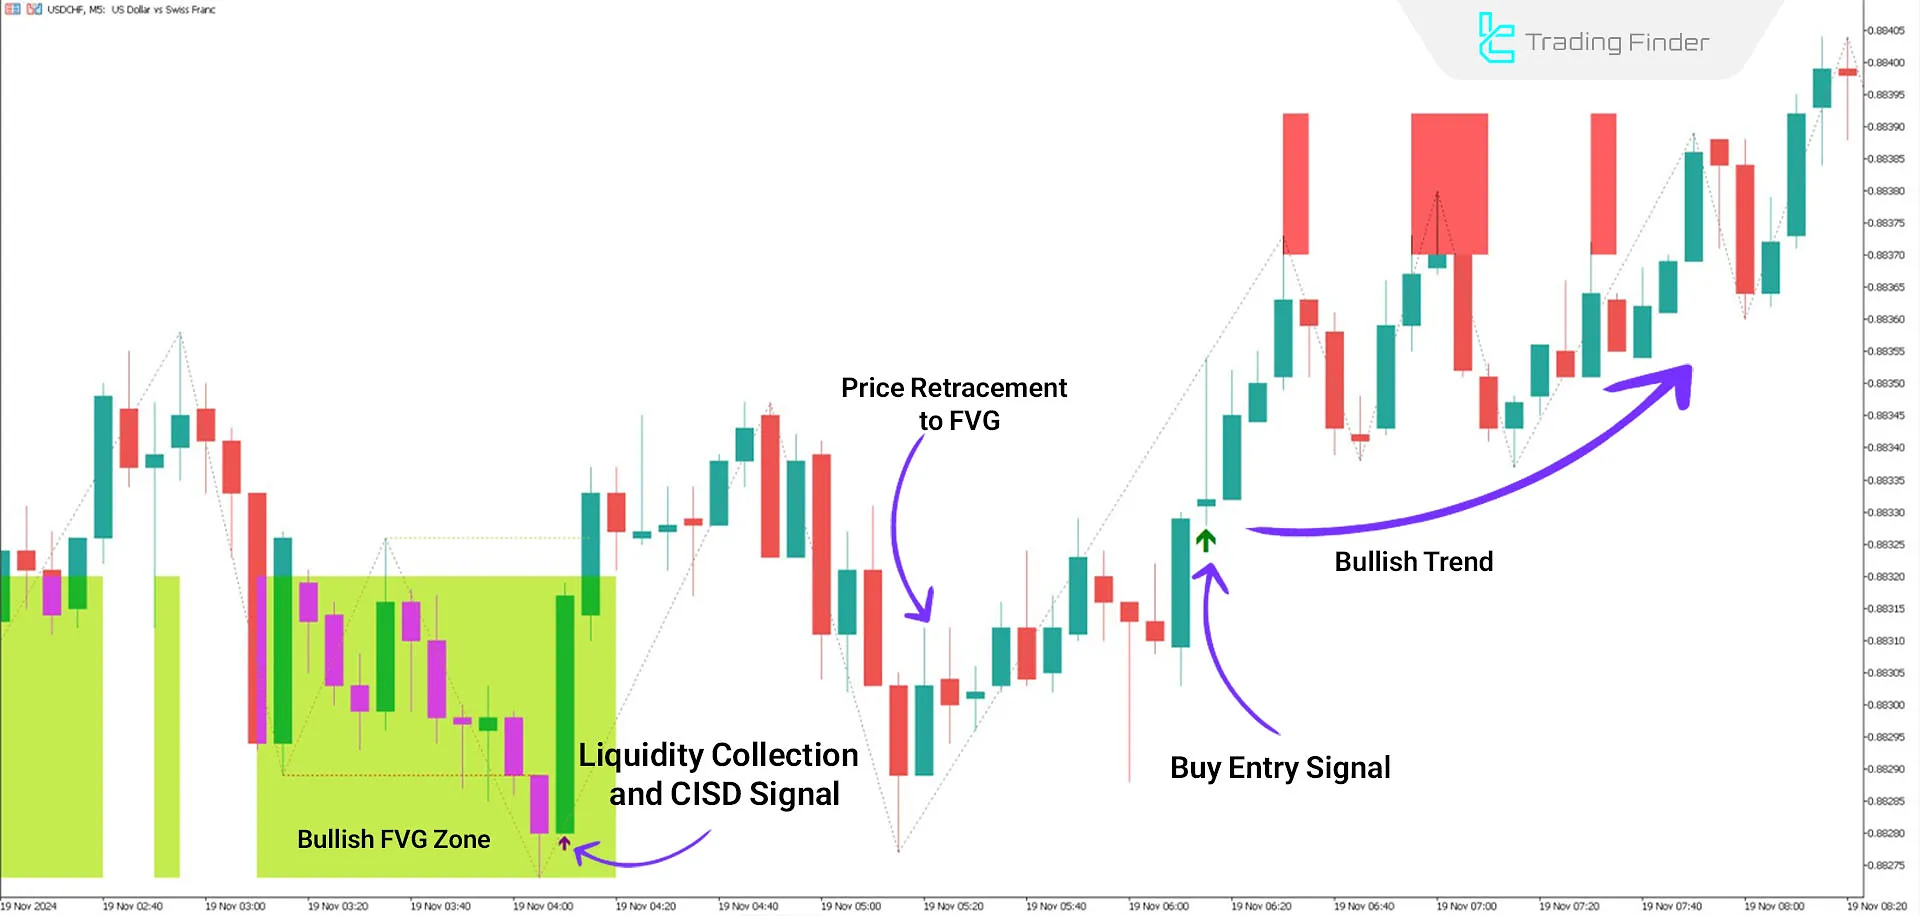
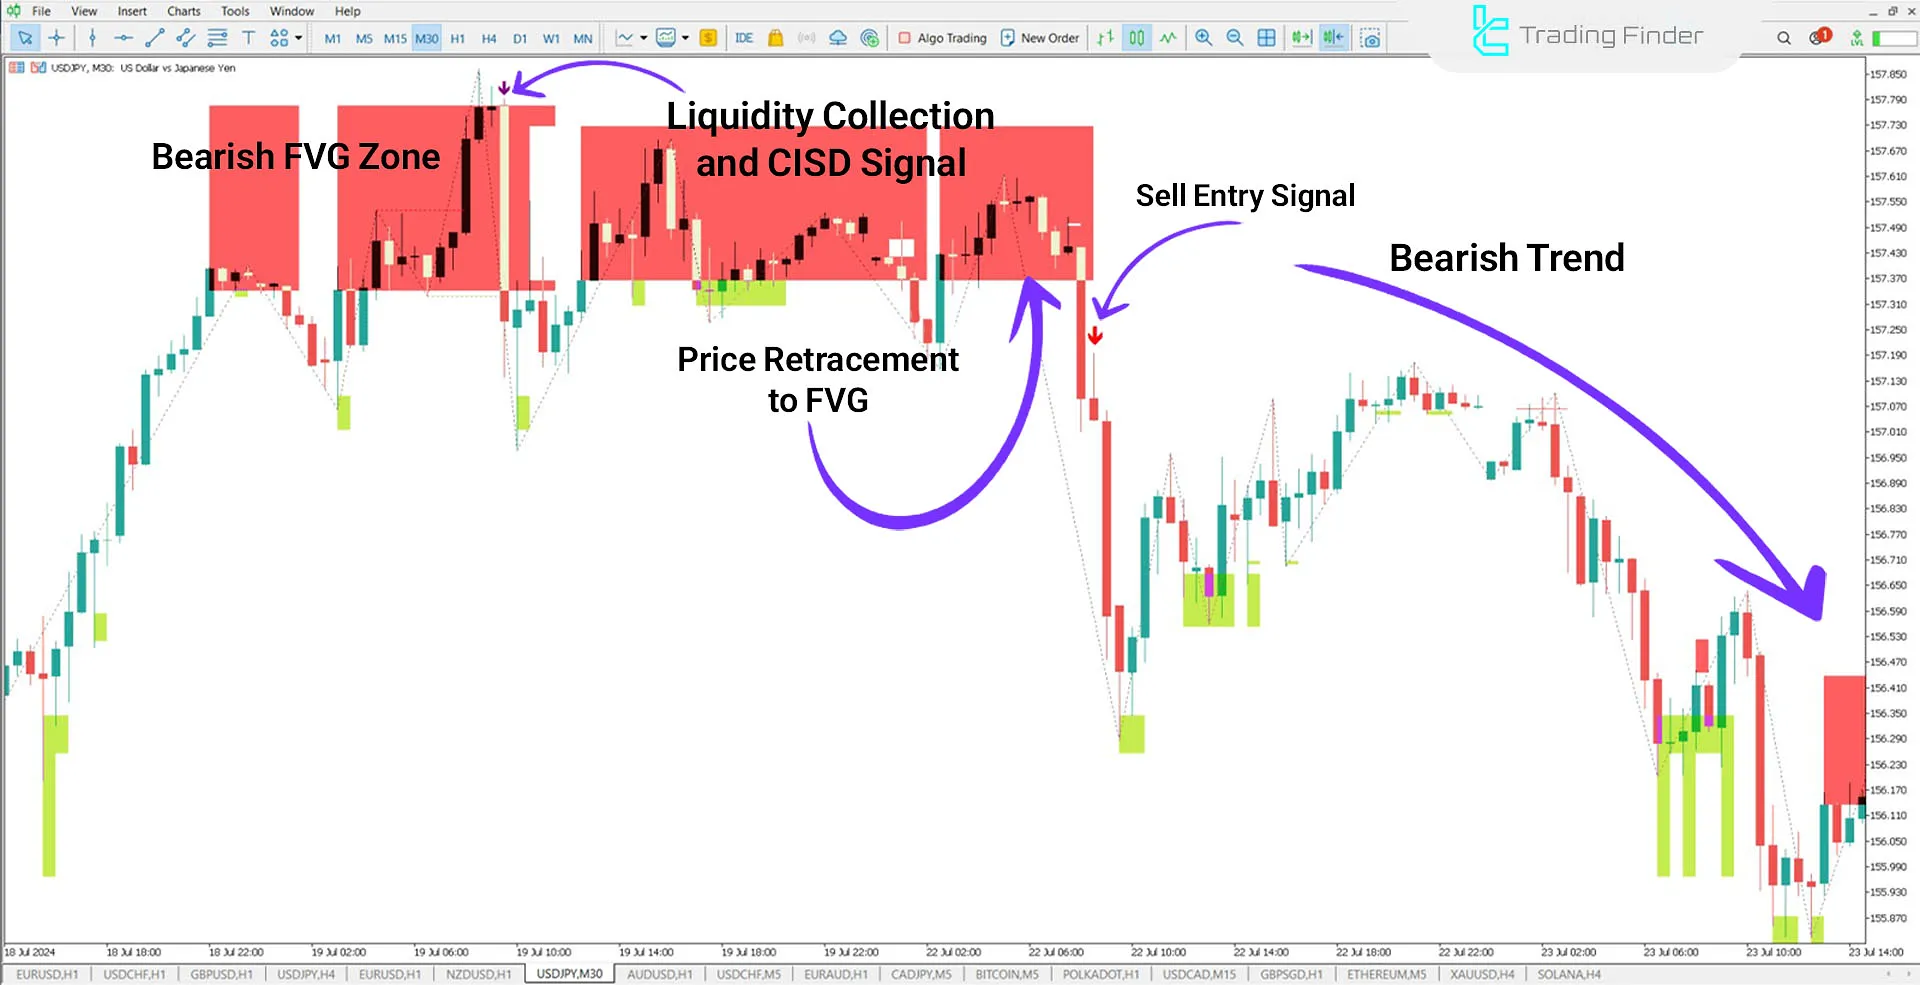
The MMXM Market Maker X Model Indicator helps traders identify optimal entry points. After forming a CHoCH and the price retraces to an FVG zone, the indicator confirms and displays Buy signals (Long) with a green arrow and Sell signals with a red arrow.
If the price crosses a dashed line and collects liquidity, a Change of Character (CHoCH) or CISD is detected and marked with a purple arrow.
MMXM Indicator in a Bullish Trend
In the price chart of the USD/CHF pair on a 5-minute timeframe, the indicator first identifies and plots the bullish FVG zone from a higher timeframe on the chart.
After entering this zone, the price moves upward with a CISD, collecting available liquidity. Following this, as the price exits the FVG zone and a confirmation candle closes, the indicator displays a Buy Signal with a green arrow.

MMXM Indicator in a Bearish Trend
On the 30-minute USD/JPY pair chart, the price collects liquidity in the bearish FVG zone (red) and displays a Change of Character (CHoCH) with a large candle as it exits the FVG zone.
After the price retraces to the bearish FVG zone, the indicator displays a Sell Opportunity with a red arrow on the chart upon confirming the required conditions.

Indicator Settings
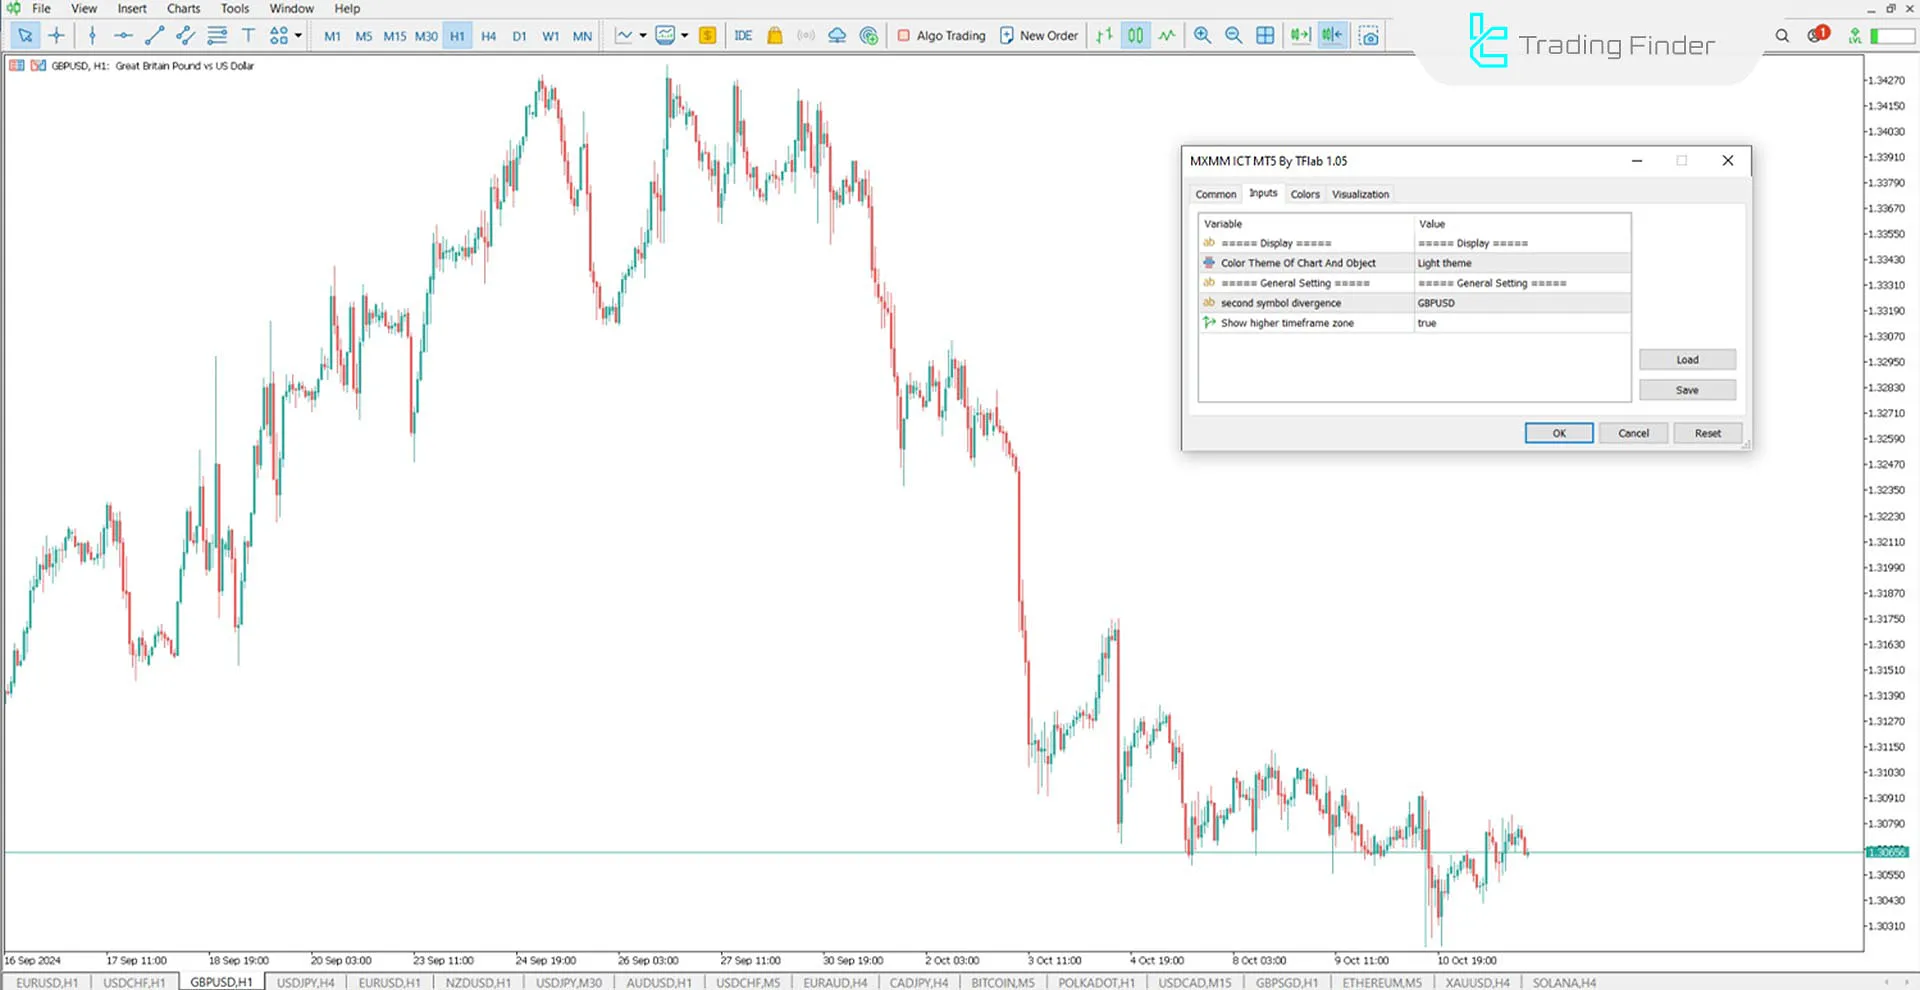
The full settings of this indicator are shown in the image ahead:

- Color Theme of Chart and Objects: Set to light mode;
- Show Higher Timeframe Zone: Displays bullish and bearish FVGs from higher timeframes.
Conclusion
Market Makers play a significant role in providing liquidity and facilitating trades. They help maintain market stability by balancing supply and demand.
By identifying market character changes (CHoCH) and price retracements to FVG zones, the indicator provides Buy and Sell signals using green and red arrows.
Market Maker X Model MT5 PDF
Market Maker X Model MT5 PDF
Click to download Market Maker X Model MT5 PDFWhat makes MMXM unique?
The ability to automatically identify market character changes (CHoCH), and FVG zones makes this indicator unique.
Which trading styles is this indicator suitable for?
This indicator is ideal for ICT, Smart Money, and other liquidity-based trading strategies.


