![MSP Indicator for MetaTrader 5 – Free Download [TradingFinder]](https://cdn.tradingfinder.com/image/512513/2-133-en-msp-mt5-1.webp)
![MSP Indicator for MetaTrader 5 – Free Download [TradingFinder] 0](https://cdn.tradingfinder.com/image/512513/2-133-en-msp-mt5-1.webp)
![MSP Indicator for MetaTrader 5 – Free Download [TradingFinder] 1](https://cdn.tradingfinder.com/image/512509/2-133-en-msp-mt5-2.webp)
![MSP Indicator for MetaTrader 5 – Free Download [TradingFinder] 2](https://cdn.tradingfinder.com/image/512508/2-133-en-msp-mt5-3.webp)
![MSP Indicator for MetaTrader 5 – Free Download [TradingFinder] 3](https://cdn.tradingfinder.com/image/512511/2-133-en-msp-mt5-4.webp)
The MSP Indicator is an analytical tool based on market volatility that identifies key trend reversal points by assessing the strength and direction of price movement.
In addition to identifying the best entry points based on momentum, this indicator can also be used as a signal filter to improve the accuracy of other analytical methods.
MSP Indicator Table
The table below presents the specifications of the MSP trading indicator:
Indicator Categories: | Signal & Forecast MT5 Indicators Trading Assist MT5 Indicators Momentum Indicators in MT5 |
Platforms: | MetaTrader 5 Indicators |
Trading Skills: | Elementary |
Indicator Types: | Reversal MT5 Indicators |
Timeframe: | Multi-Timeframe MT5 Indicators |
Trading Style: | Intraday MT5 Indicators |
Trading Instruments: | Forex MT5 Indicators Crypto MT5 Indicators Stock MT5 Indicators Commodity MT5 Indicators Indices MT5 Indicators Share Stock MT5 Indicators |
MSP Indicator at a Glance
The MSP trading indicator is designed with the ATR (Average True Range) using a 14-period setting in technical analysis. This index calculates the average price fluctuation range using the highs and lows of previous candles.
When the current price is above the ATR average, the indicator generates a Buy signal with a blue arrow.
When the current price is below the ATR average, a Sell signal is displayed with a red arrow.
Indicator in Uptrend
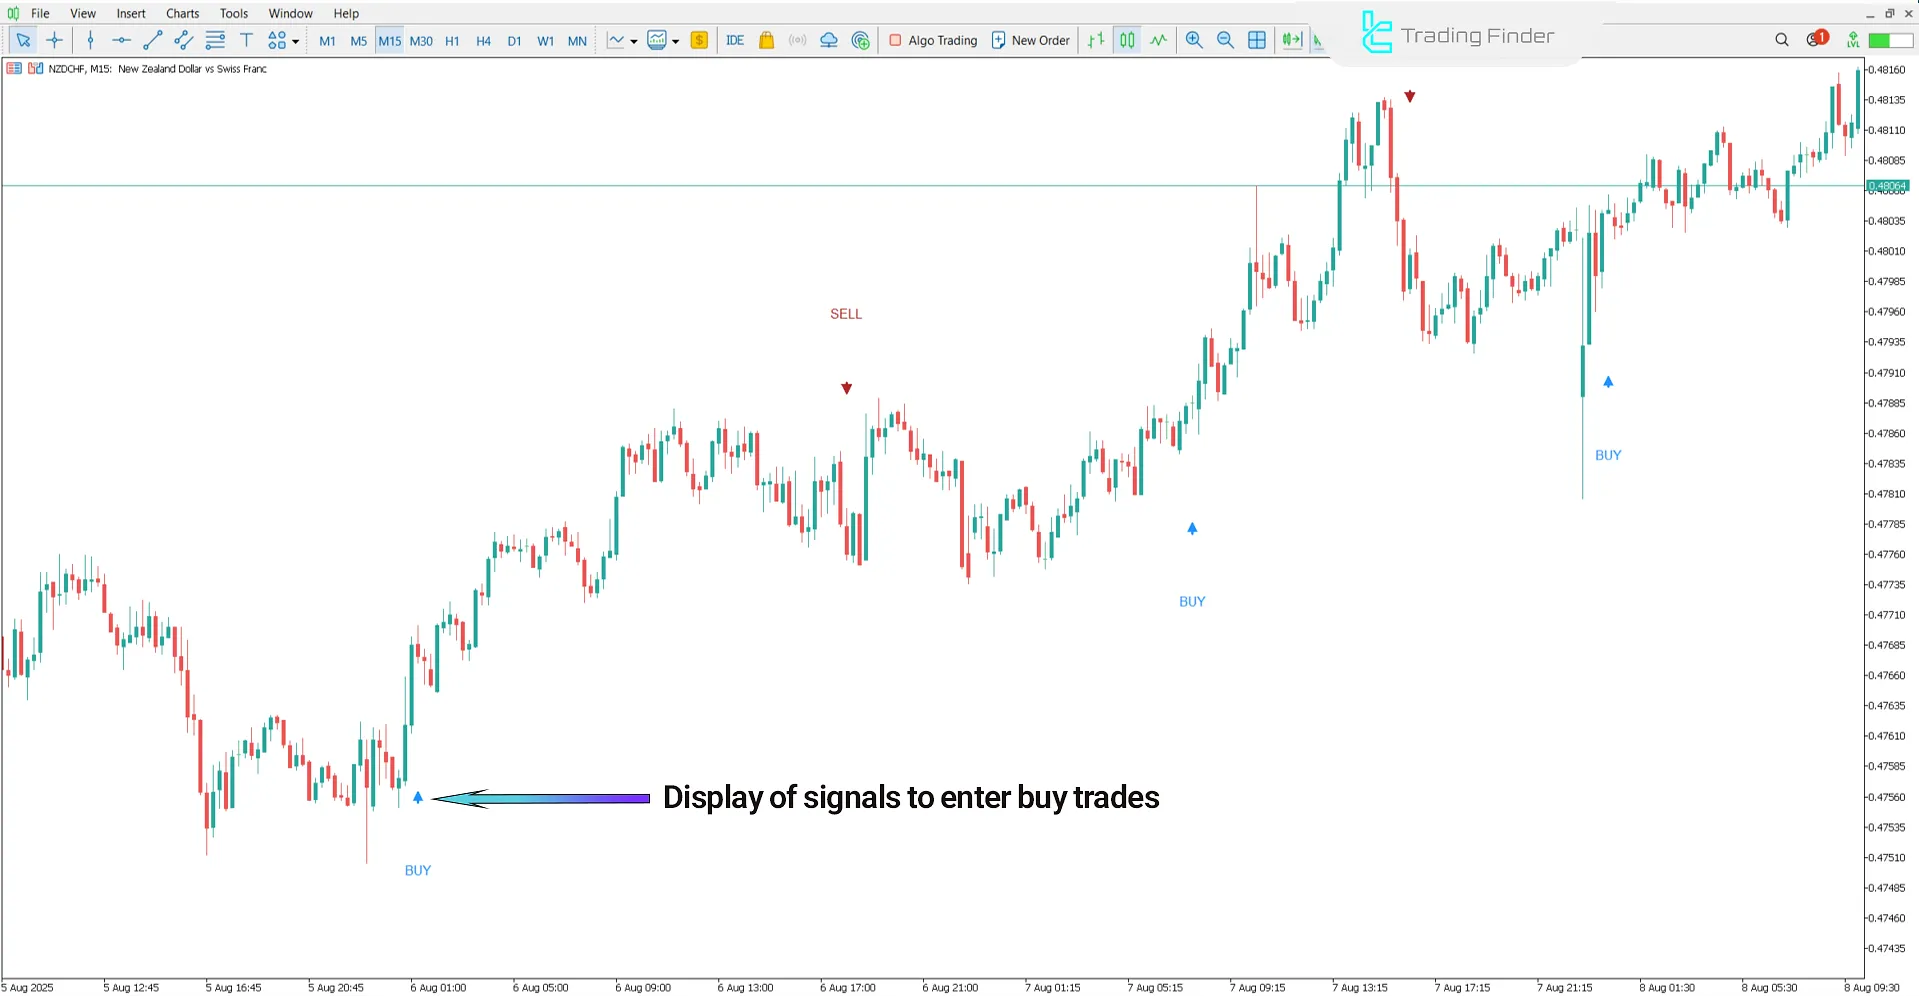
The chart below shows the currency pair NZD/CHF on a 15-minute timeframe.
In a bullish scenario, an upward arrow with the text “BUY” indicates the beginning of an uptrend and increased buyer momentum. Under these conditions, a buy entry zone is created.

Indicator in Downtrend
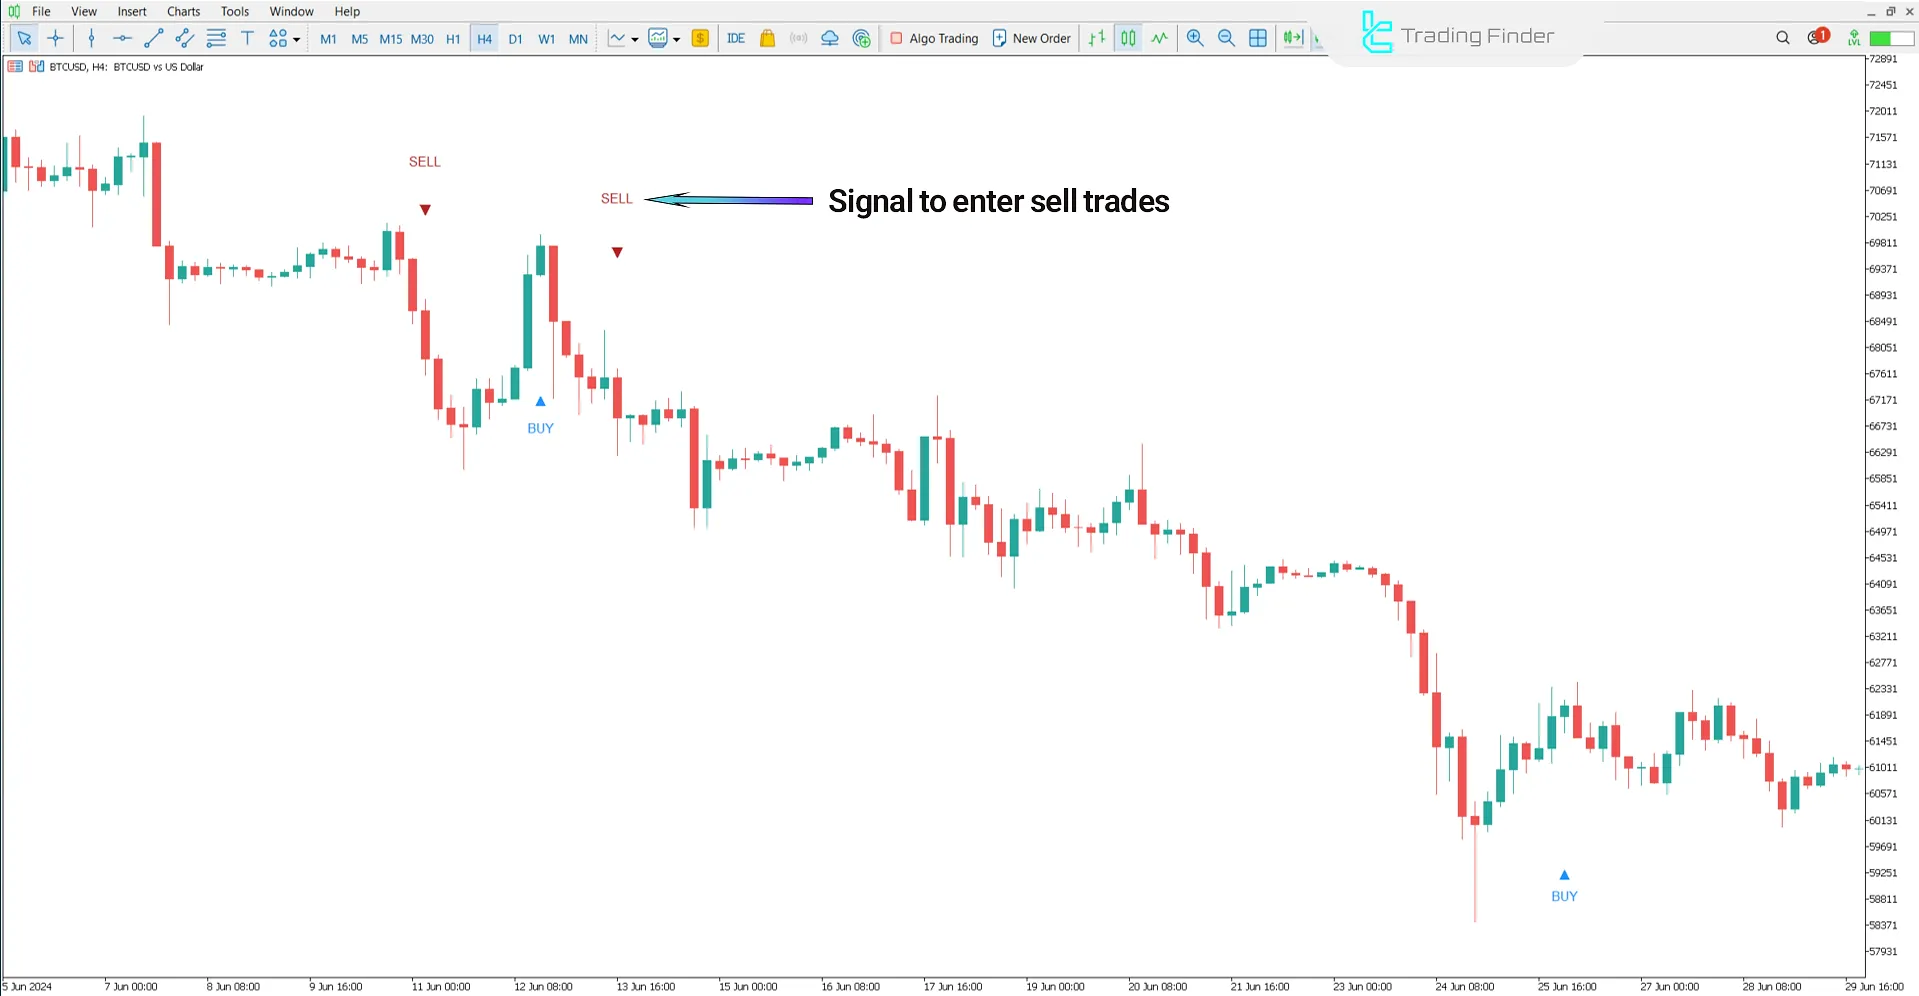
The chart below shows Bitcoin (BTC/USD) on a 4-hour timeframe.
In this indicator, a downward arrow with the text “SELL” reflects growing selling pressure and the likelihood of a bearish trend initiation. Such conditions may create a good opportunity to enter short positions.

MSP Indicator Settings
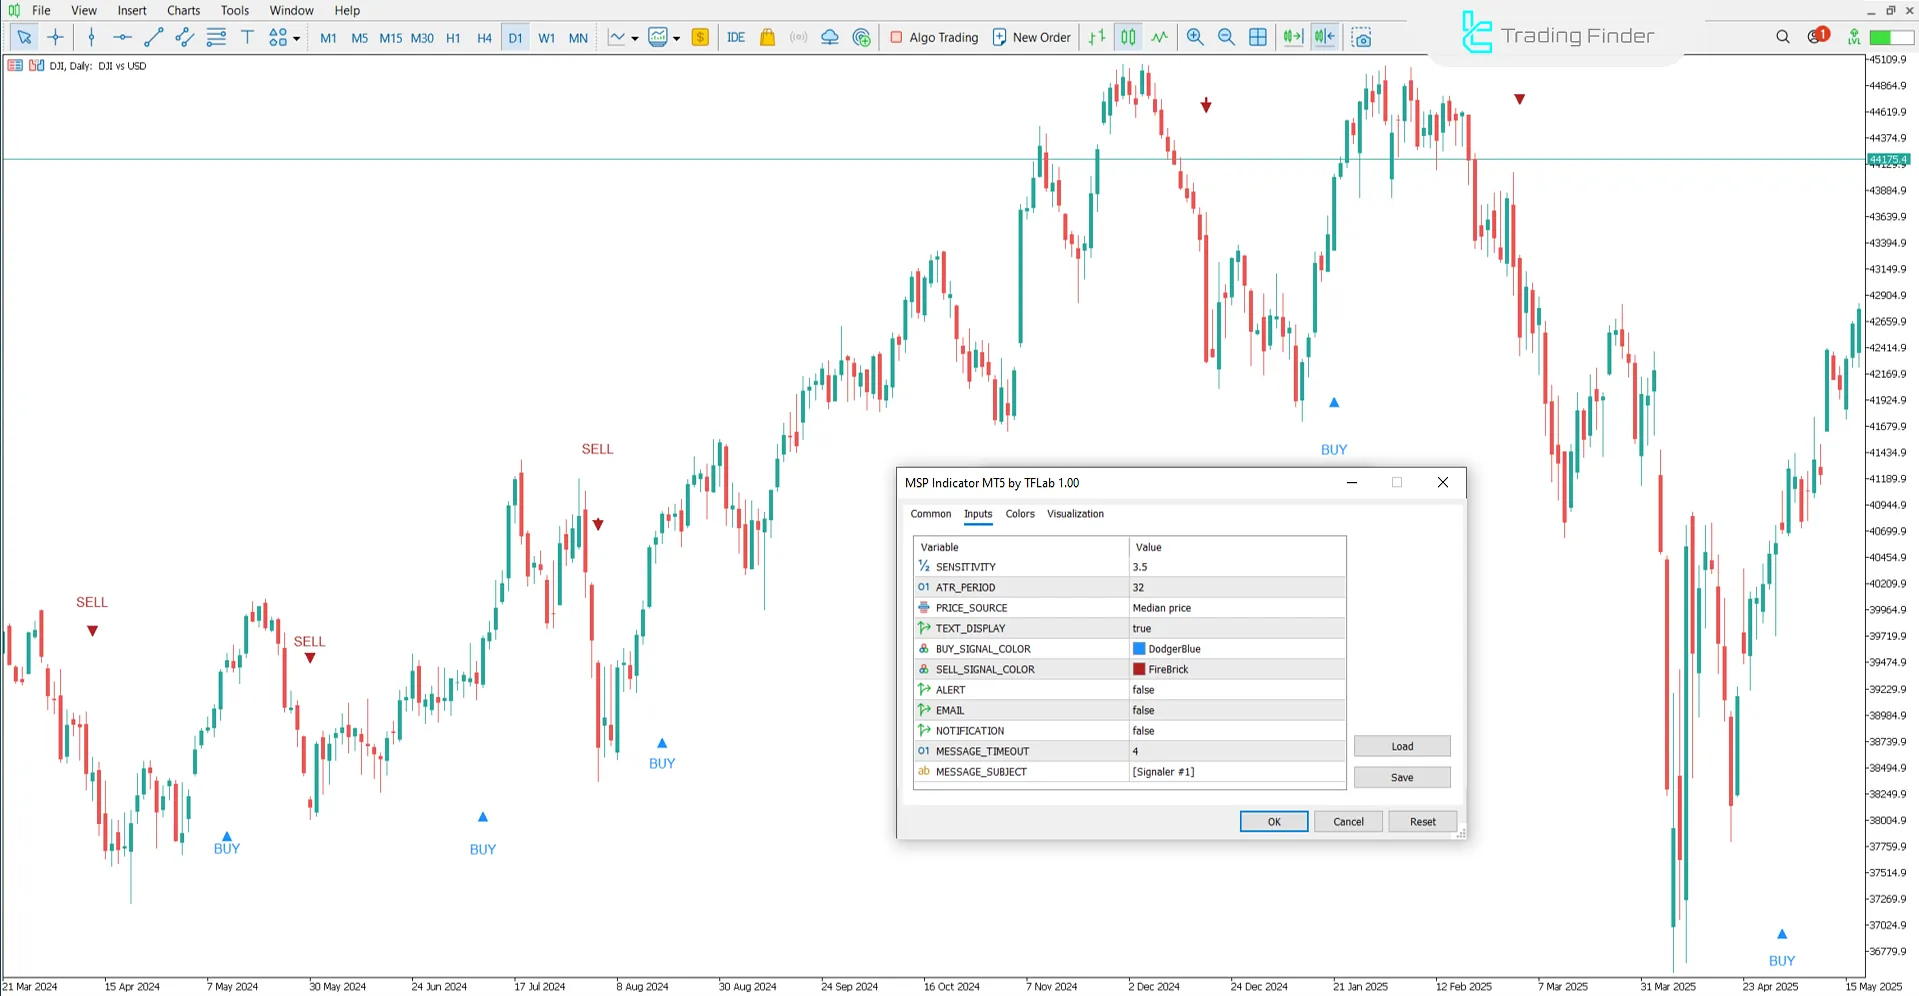
The image below shows the settings panel of the MSP Indicator on the MetaTrader 5 platform:

- SENSITIVITY: Indicator sensitivity to market changes
- ATR_PERIOD: Period for calculating the ATR average
- PRICE_SOURCE: Type of price data used
- TEXT_DISPLAY: Display signal texts on the chart
- BUY_SIGNAL_COLOR: Buy signal color
- SELL_SIGNAL_COLOR: Sell signal color
- ALERT: Show alerts
- EMAIL: Send signals via email
- NOTIFICATION: Send notifications
- MESSAGE_TIMEOUT: Display duration of alert messages
- MESSAGE_SUBJECT: Subject text for alert messages
Conclusion
The MSP Indicator, by analyzing momentum and measuring market volatility, accurately identifies entry and exit points.
This trading tool, by focusing on changes in buyer and seller strength, enables early entries into bullish and bearish trends with blue and red arrows.
MSP Indicator for MetaTrader 5 PDF
MSP Indicator for MetaTrader 5 PDF
Click to download MSP Indicator for MetaTrader 5 PDFOn what basis does the MSP Indicator generate signals?
The indicator uses the ATR with a 14-period setting and analyzes the position of price relative to the average range to issue Buy or Sell signals.
Is the MSP Indicator suitable for beginner traders?
Yes; due to its simplicity of signal generation and no need for complex analysis, it is highly suitable for new users.


