![Multi Timeframe High Low Indicator for MT5 Download – Free – [TFlab]](https://cdn.tradingfinder.com/image/320591/13-95-en-mtf-high-low-mt5-01.webp)
![Multi Timeframe High Low Indicator for MT5 Download – Free – [TFlab] 0](https://cdn.tradingfinder.com/image/320591/13-95-en-mtf-high-low-mt5-01.webp)
![Multi Timeframe High Low Indicator for MT5 Download – Free – [TFlab] 1](https://cdn.tradingfinder.com/image/320592/13-95-en-mtf-high-low-mt5-02.webp)
![Multi Timeframe High Low Indicator for MT5 Download – Free – [TFlab] 2](https://cdn.tradingfinder.com/image/320590/13-95-en-mtf-high-low-mt5-03.webp)
![Multi Timeframe High Low Indicator for MT5 Download – Free – [TFlab] 3](https://cdn.tradingfinder.com/image/320594/13-95-en-mtf-high-low-mt5-04.webp)
The Multi Timeframe High Low Indicator (MTF High Low) directly displays the daily, weekly, and monthly high and low price levels on the chart.
This MT5 levels indicator helps traders identify uptrends and downtrends across different timeframes. In addition to current levels, it shows previous highs and lows, marked with the "Previous."
Specification Table of the MTF High Low Indicator
The specifications and features of the MTF High Low Indicator are shown in the table below.
Indicator Categories: | Support & Resistance MT5 Indicators Trading Assist MT5 Indicators Levels MT5 Indicators |
Platforms: | MetaTrader 5 Indicators |
Trading Skills: | Elementary |
Indicator Types: | Breakout MT5 Indicators Reversal MT5 Indicators |
Timeframe: | Multi-Timeframe MT5 Indicators |
Trading Style: | Day Trading MT5 Indicators |
Trading Instruments: | Forex MT5 Indicators Crypto MT5 Indicators Stock MT5 Indicators Share Stock MT5 Indicators |
Bullish Trend
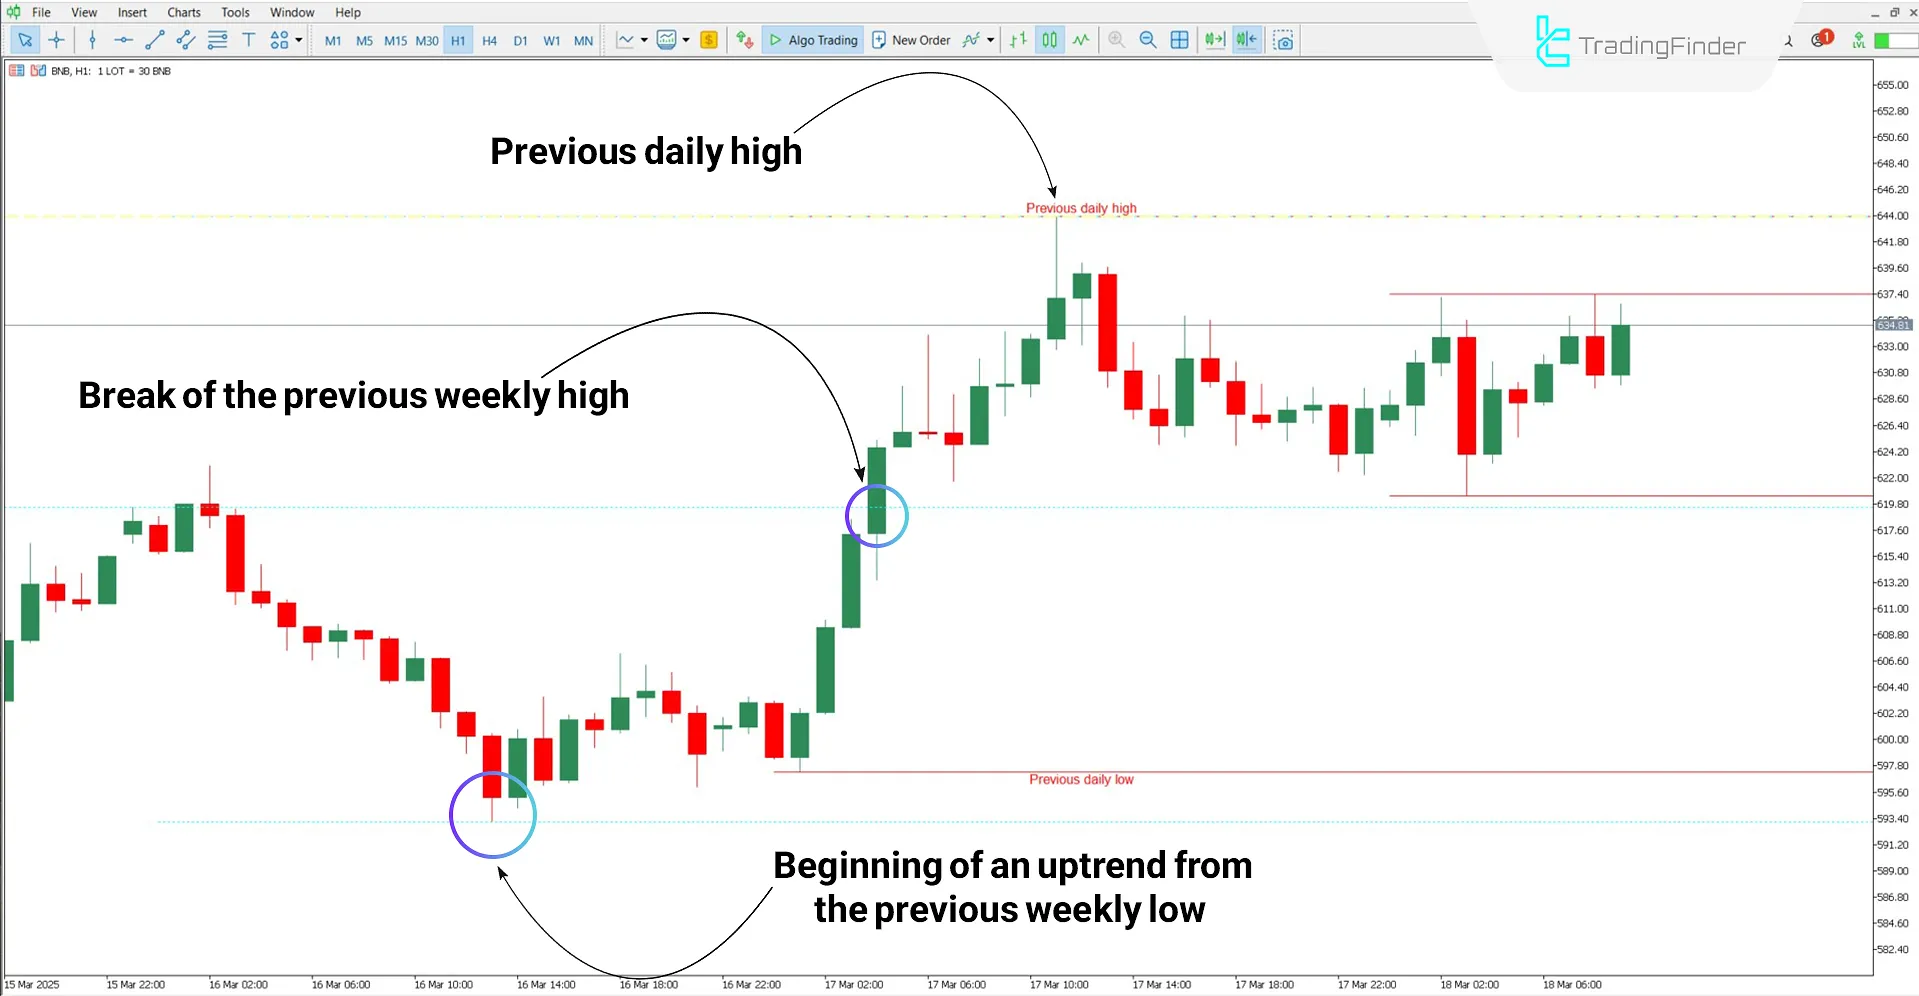
According to Binance Coin's (BNB) one-hour chart, the bullish movement started from the previous weekly low and reached the previous daily high.
The price also broke above the previous weekly high, indicating buying pressure and confirming the strength of the uptrend.

Bearish Trend
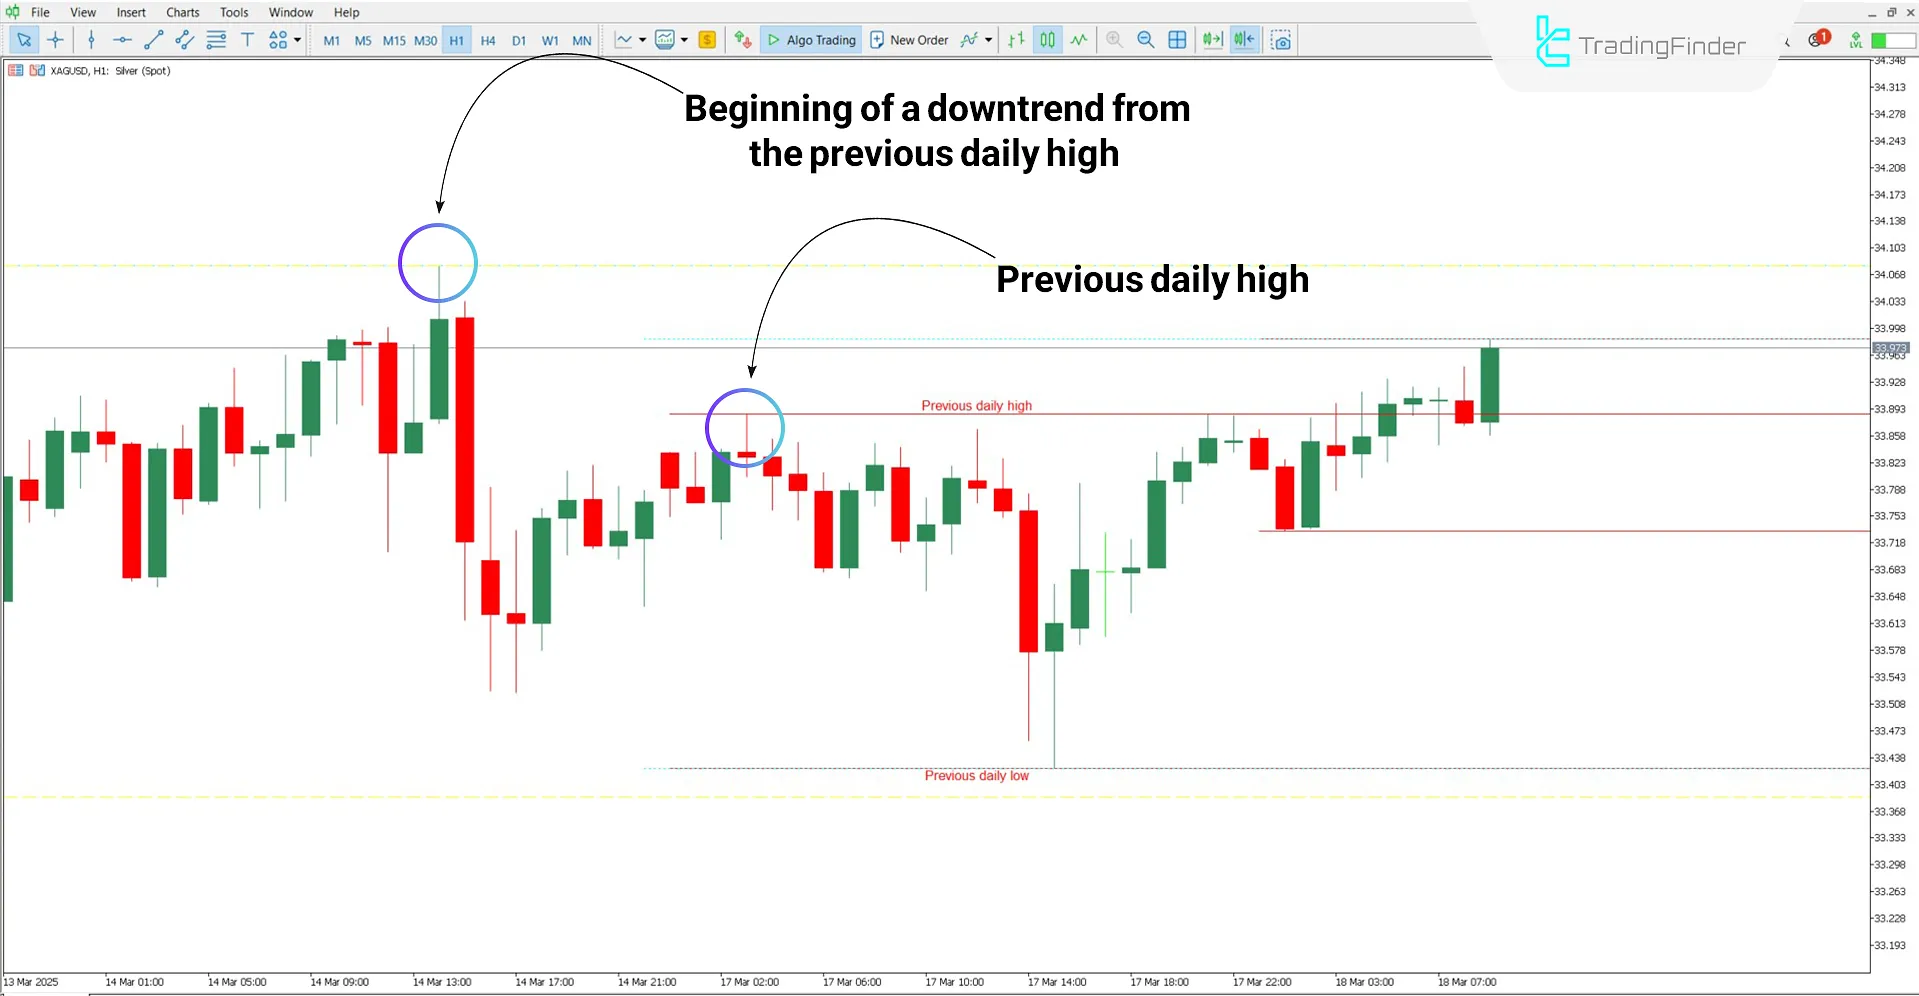
According to the XAG/USD (Silver vs. USD) chart, the price started to fall from the previous daily high. A new daily high was formed during the retracement, creating a good opportunity for short entries.

MTF High Low Indicator Settings
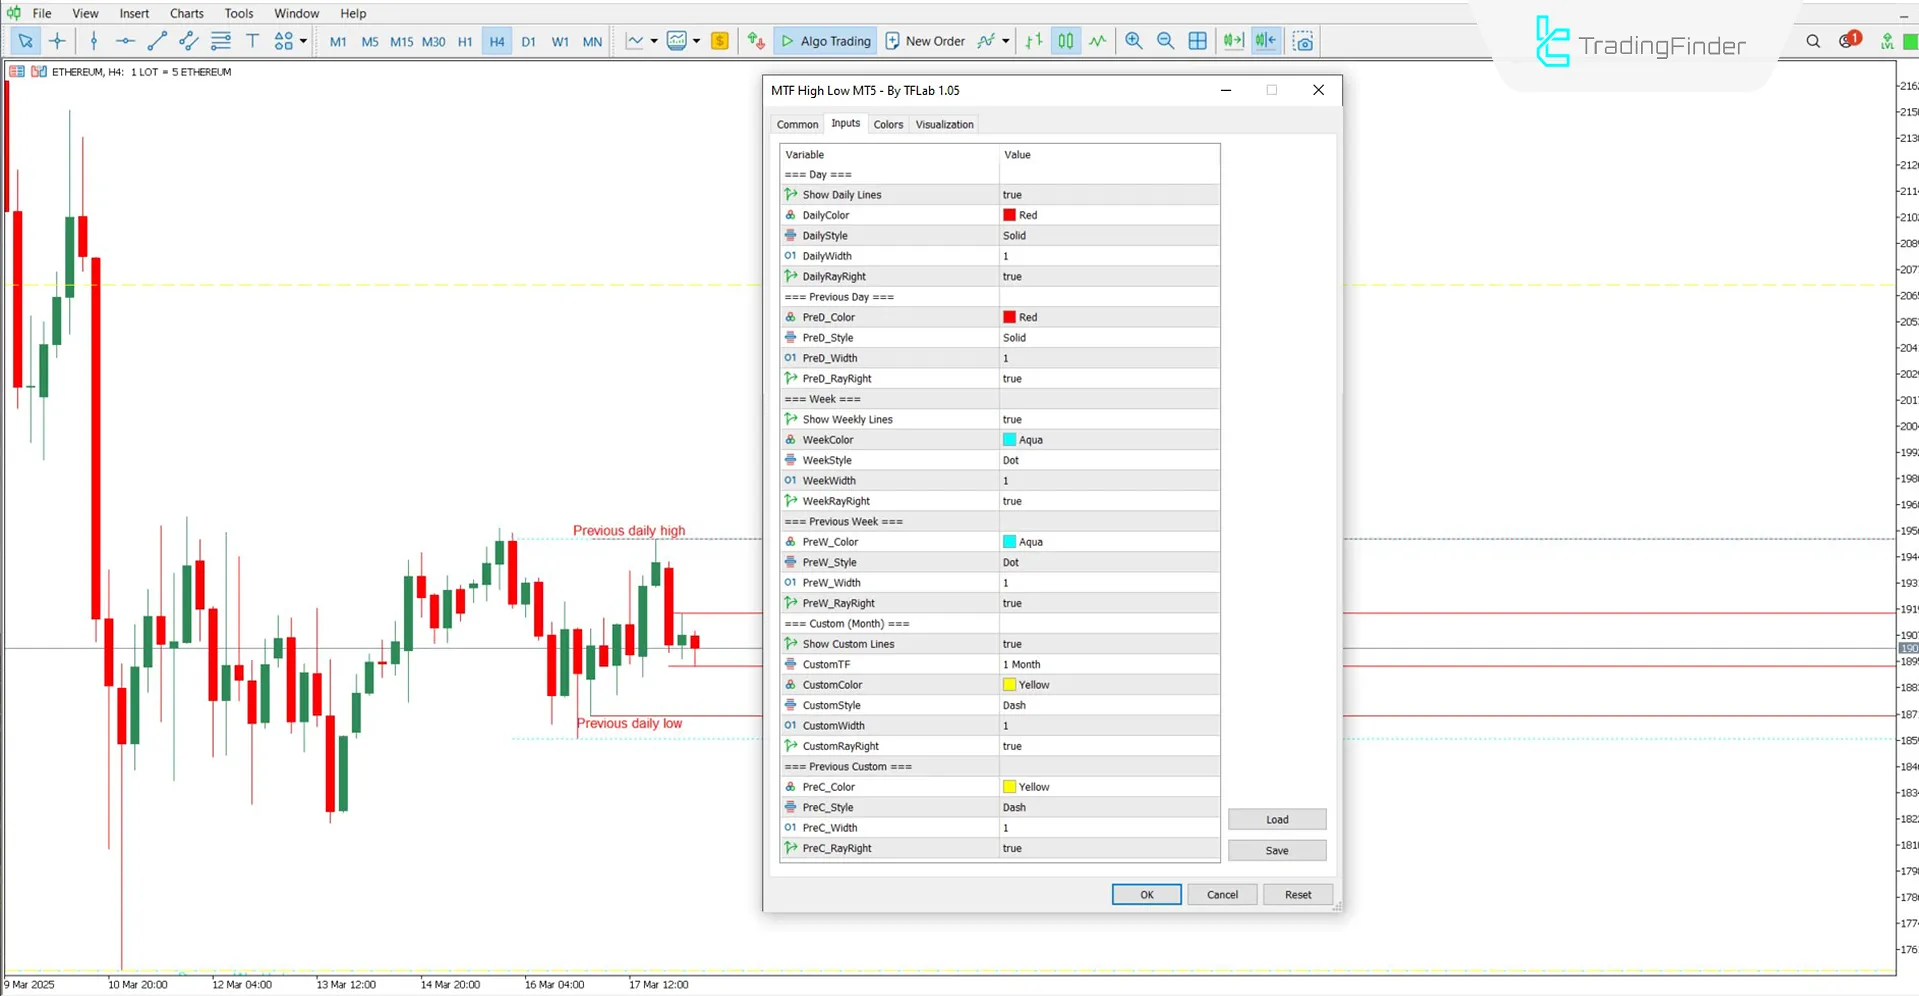
The adjustable settings of the MTF High Low Indicator are as follows:

- Show Daily Lines: Display daily high and low lines
- Daily Color: Set the color of daily high/low lines
- Daily Style: Choose the visual style of daily lines
- Daily Width: Define the line thickness
- Daily RayRight: Extend daily lines to the right of the chart
- PreD_Color: Set the color for previous daily levels
- PreD_Style: Choose a style for previous daily lines
- PreD_Width: Define the thickness of previous daily lines
- PreD_RayRight: Extend previous daily lines to the right
- Show Weekly Lines: Display weekly high and low lines
- Week Color: Set the color for weekly levels
- Week Style: Choose a visual style for weekly lines
- Week Width: Define weekly line thickness
- Week RayRight: Extend weekly lines to the right
- PreW_Color: Set the color of previous weekly levels
- PreW_Style: Style of previous weekly lines
- PreW_Width: Thickness of previous weekly lines
- PreW_RayRight: Extend previous weekly lines to the right
- Show Custom Lines: Enable custom timeframe high/low lines
- CustomTF: Set the desired custom timeframe
- Custom Color: Color of custom timeframe levels
- Custom Style: Visual style of custom timeframe lines
- Custom Width: Line thickness of custom timeframe
- Custom RayRight: Extend custom lines to the right
- PreC_Color: Color of previous custom timeframe lines
- PreC_Style: Style of previous custom lines
- PreC_Width: Thickness of previous custom timeframe lines
- PreC_RayRight: Extend previous custom lines to the right
Conclusion
The MTF High Low Indicator displays high and low price levels across various timeframes, including daily and weekly.
These levels are plotted as colored horizontal lines on the chart, defining price range zones and enhancing trend clarity.
As a trading assist, it provides a flexible settings panel for fully customizing levels, colors, and styles.
Multi Timeframe High Low MT5 PDF
Multi Timeframe High Low MT5 PDF
Click to download Multi Timeframe High Low MT5 PDFIs the MTF High-Low Indicator usable in stock markets?
Yes, this indicator can be used in all types of markets.
Can I change the color and appearance of the lines?
Users can customize the line colors and styles via the settings panel.


