![Multi Chart Multi Timeframe Indicator for MT5 Download – Free – [TFlab]](https://cdn.tradingfinder.com/image/520800/13-210-en-multi-chart-multi-time-frame-mt5-01.webp)
![Multi Chart Multi Timeframe Indicator for MT5 Download – Free – [TFlab] 0](https://cdn.tradingfinder.com/image/520800/13-210-en-multi-chart-multi-time-frame-mt5-01.webp)
![Multi Chart Multi Timeframe Indicator for MT5 Download – Free – [TFlab] 1](https://cdn.tradingfinder.com/image/520801/13-210-en-multi-chart-multi-time-frame-mt5-02.webp)
![Multi Chart Multi Timeframe Indicator for MT5 Download – Free – [TFlab] 2](https://cdn.tradingfinder.com/image/520788/13-210-en-multi-chart-multi-time-frame-mt5-03.webp)
![Multi Chart Multi Timeframe Indicator for MT5 Download – Free – [TFlab] 3](https://cdn.tradingfinder.com/image/520799/13-210-en-multi-chart-multi-time-frame-mt5-04.webp)
The Multi Chart Multi Timeframe indicator is one of the professional tools in technical analysis that enables simultaneous market analysis across multiple timeframes.
By displaying the price chart, moving averages, and other analytical filters in a separate window, this indicator provides traders with both a general and detailed view of the market without the need for constant switching between timeframes.
Multi Chart Multi Timeframe Indicator Specifications Table
The following table presents the key characteristics and functionalities of the Multi Timeframe Multi Chart indicator:
Indicator Categories: | Trading Assist MT5 Indicators Moving Average MT5 Indicators |
Platforms: | MetaTrader 5 Indicators |
Trading Skills: | Intermediate |
Indicator Types: | Non-Repaint MT5 Indicators Reversal MT5 Indicators |
Timeframe: | Multi-Timeframe MT5 Indicators |
Trading Style: | Swing Trading MT5 Indicators Scalper MT5 Indicators Day Trading MT5 Indicators |
Trading Instruments: | Forex MT5 Indicators Crypto MT5 Indicators Stock MT5 Indicators Commodity MT5 Indicators Indices MT5 Indicators Share Stock MT5 Indicators |
Multi Timeframe Multi Chart Indicator at a Glance
The Multi Chart Multi Timeframe indicator is used to identify and analyze bullish and bearish trends. Alignment of price movements in both small and large timeframes increases the probability of forming a strong trend.
Conversely, conflicting signals may serve as a warning of trend reversal or the price entering a neutral/corrective phase.
Bullish Trend Detection
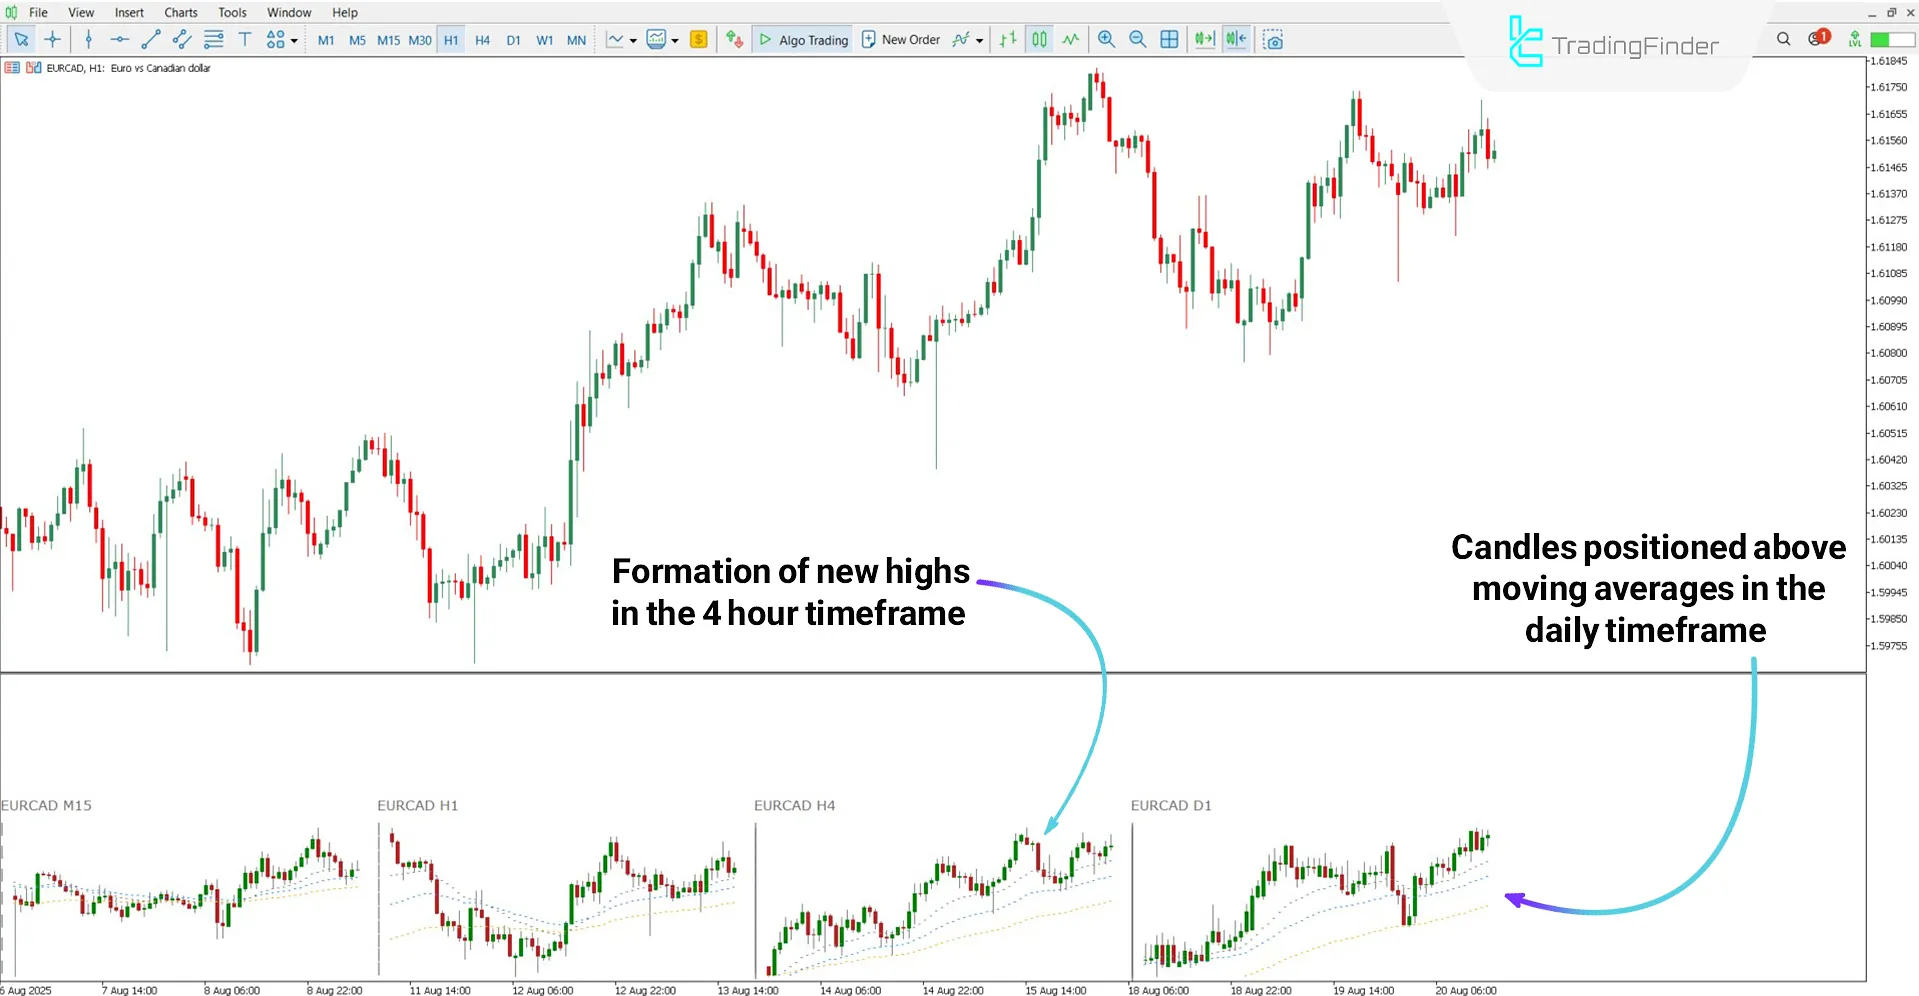
According to the EUR/CAD chart, price movements across all timeframes remain above the moving averages, maintaining the bullish path with new highs.

Bearish Trend Detection
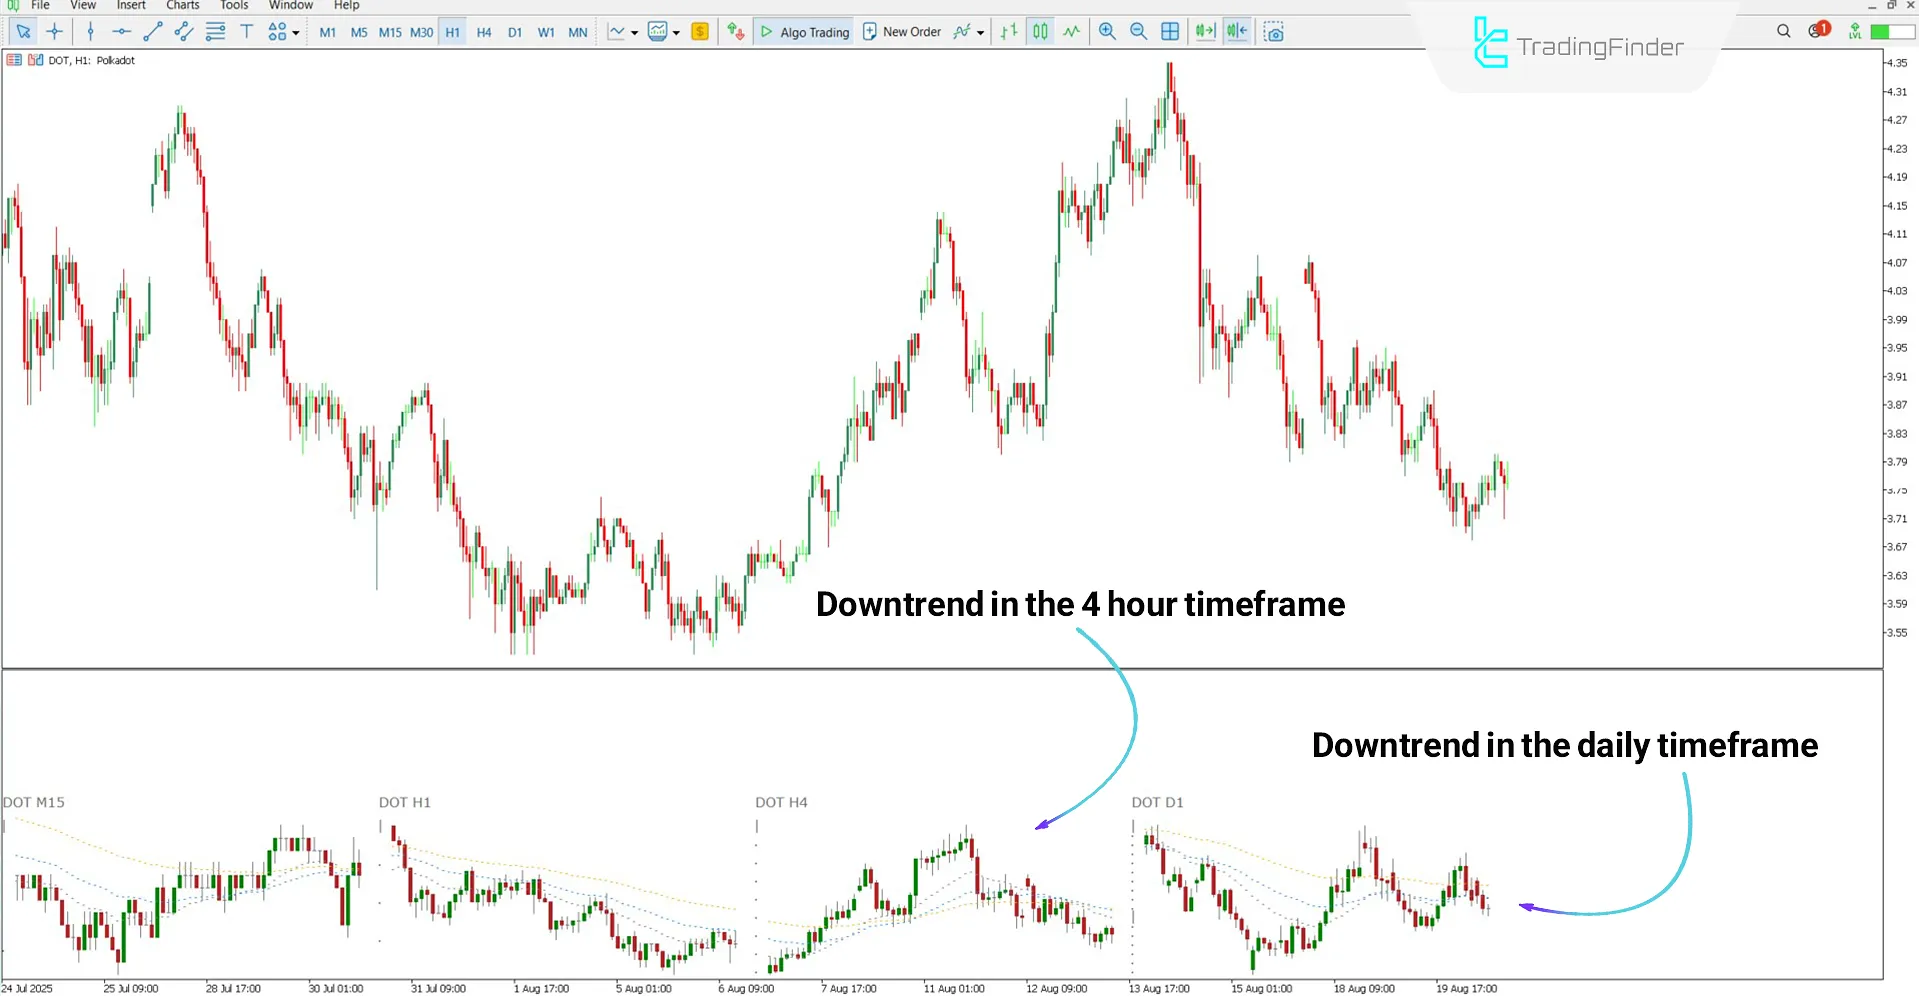
Based on the analysis of Polkadot (DOT) cryptocurrency chart in daily and 4-hour timeframes, the price remains below the moving average. In such conditions, bearish scenarios are stronger.

Multi Chart Multi Timeframe Indicator Settings
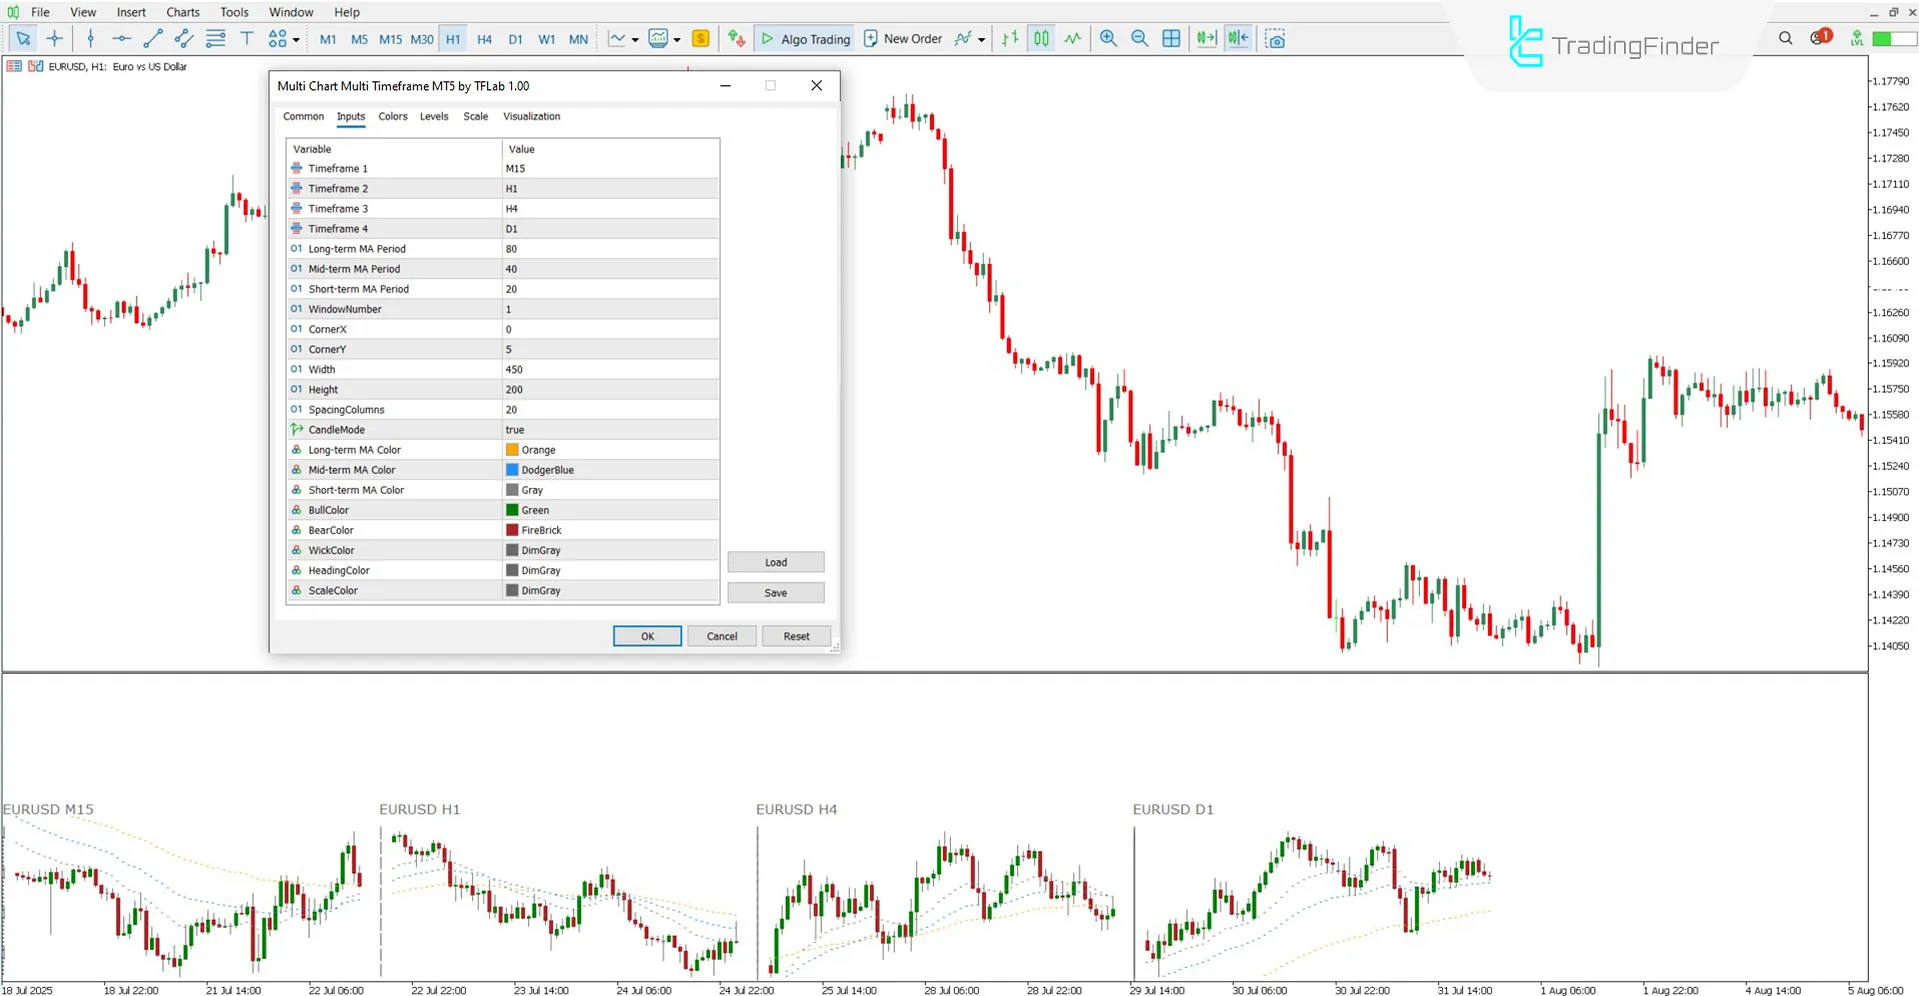
The settings of the Multi Chart Multi Timeframe indicator are as follows:

- Timeframe 1: First timeframe selection
- Timeframe 2: Second timeframe selection
- Timeframe 3: Third timeframe selection
- Timeframe 4: Fourth timeframe selection
- Long-term MA Period: Long-term moving average period
- Mid-term MA Period: Mid-term moving average period
- Short-term MA Period: Short-term moving average period
- WindowNumber: Indicator display window number
- CornerX: Horizontal display position
- CornerY: Vertical display position
- Width: Indicator window width
- Height: Indicator window height
- SpacingColumns: Space between mini chart columns
- CandleMode: Candlestick display setting
- Long-term MA Color: Long-term moving average color
- Mid-term MA Color: Mid-term moving average color
- Short-term MA Color: Short-term moving average color
- BullColor: Bullish candle color
- BearColor: Bearish candle color
- WickColor: Candle wick color
- HeadingColor: Timeframe heading color
- ScaleColor: Indicator axis/scale numbers color
Note: For proper execution of this tool, the corresponding font must first be installed on your system. This font is included in the indicator installation file.
Conclusion
The Multi Chart Multi Timeframe indicator enables simultaneous observation of multiple charts across different timeframes.
This tool provides a clearer picture of the overall market trend in higher timeframes while also allowing for more detailed examination of price movements in lower timeframes.
The use of short, medium, and long-term moving averages in this indicator simplifies and enhances the accuracy of analyzing trend strength and direction.
Multi Chart Multi Timeframe Indicator for MT5 PDF
Multi Chart Multi Timeframe Indicator for MT5 PDF
Click to download Multi Chart Multi Timeframe Indicator for MT5 PDFIs it possible to define custom timeframes in this indicator?
Yes, users can set their desired timeframes in the settings section.
Does this tool specify trade entry points?
No, the Multi Chart Multi Timeframe indicator is not designed to provide entry points for trades.
Hi — I downloaded the Multi Chart Multi TimeFrame MT5 indicator but the mq5 source is not included. Can you share the .mq5? I need to change colors.


