![Murrey Math (MM) Indicator in MetaTrader 5 Download - Free - [Trading Finder]](https://cdn.tradingfinder.com/image/106569/11-17-en-murrey-math-indicator-mt5-01.webp)
![Murrey Math (MM) Indicator in MetaTrader 5 Download - Free - [Trading Finder] 0](https://cdn.tradingfinder.com/image/106569/11-17-en-murrey-math-indicator-mt5-01.webp)
![Murrey Math (MM) Indicator in MetaTrader 5 Download - Free - [Trading Finder] 1](https://cdn.tradingfinder.com/image/106568/11-17-en-murrey-math-indicator-mt5-03.webp)
![Murrey Math (MM) Indicator in MetaTrader 5 Download - Free - [Trading Finder] 2](https://cdn.tradingfinder.com/image/106570/11-17-en-murrey-math-indicator-mt5-02.webp)
![Murrey Math (MM) Indicator in MetaTrader 5 Download - Free - [Trading Finder] 3](https://cdn.tradingfinder.com/image/106571/11-17-en-murrey-math-indicator-mt5-04.webp)
The Murrey Math (MM) Indicator is a tool that identifies key price levels on the Meta Trader 5 (MT5) platform in Technical analysis. It includes a central level and 6 price levels above and below this level. When the price breaks above the central level, the market trend becomes bullish and moves toward higher levels; conversely, breaking the central level downwards indicates a bearish trend.
Traders can use these levels to determine stop loss and take profit zones in their trades.
MM Indicator Table
Indicator Categories: | Pivot Points & Fractals MT5 Indicators Support & Resistance MT5 Indicators Levels MT5 Indicators |
Platforms: | MetaTrader 5 Indicators |
Trading Skills: | Elementary |
Indicator Types: | Range MT5 Indicators Leading MT5 Indicators Reversal MT5 Indicators |
Timeframe: | M15-M30 Timeframe MT5 Indicators H1-H4 Timeframe MT5 Indicators Daily-Weekly Timeframe MT5 Indicators |
Trading Style: | Scalper MT5 Indicators Day Trading MT5 Indicators |
Trading Instruments: | Forex MT5 Indicators Crypto MT5 Indicators Indices MT5 Indicators |
Indicator at a Glance
The Murray Math Meta trader 5 Indicator is a professional tool for traders to identify key price levels on the chart. By plotting a central pivot line, traders can predict the direction of the price trend.
It also draws six levels above and six below the pivot line as potential price reaction levels, helping traders quickly identify and analyze crucial vital levels.
Bullish Trend (MM)
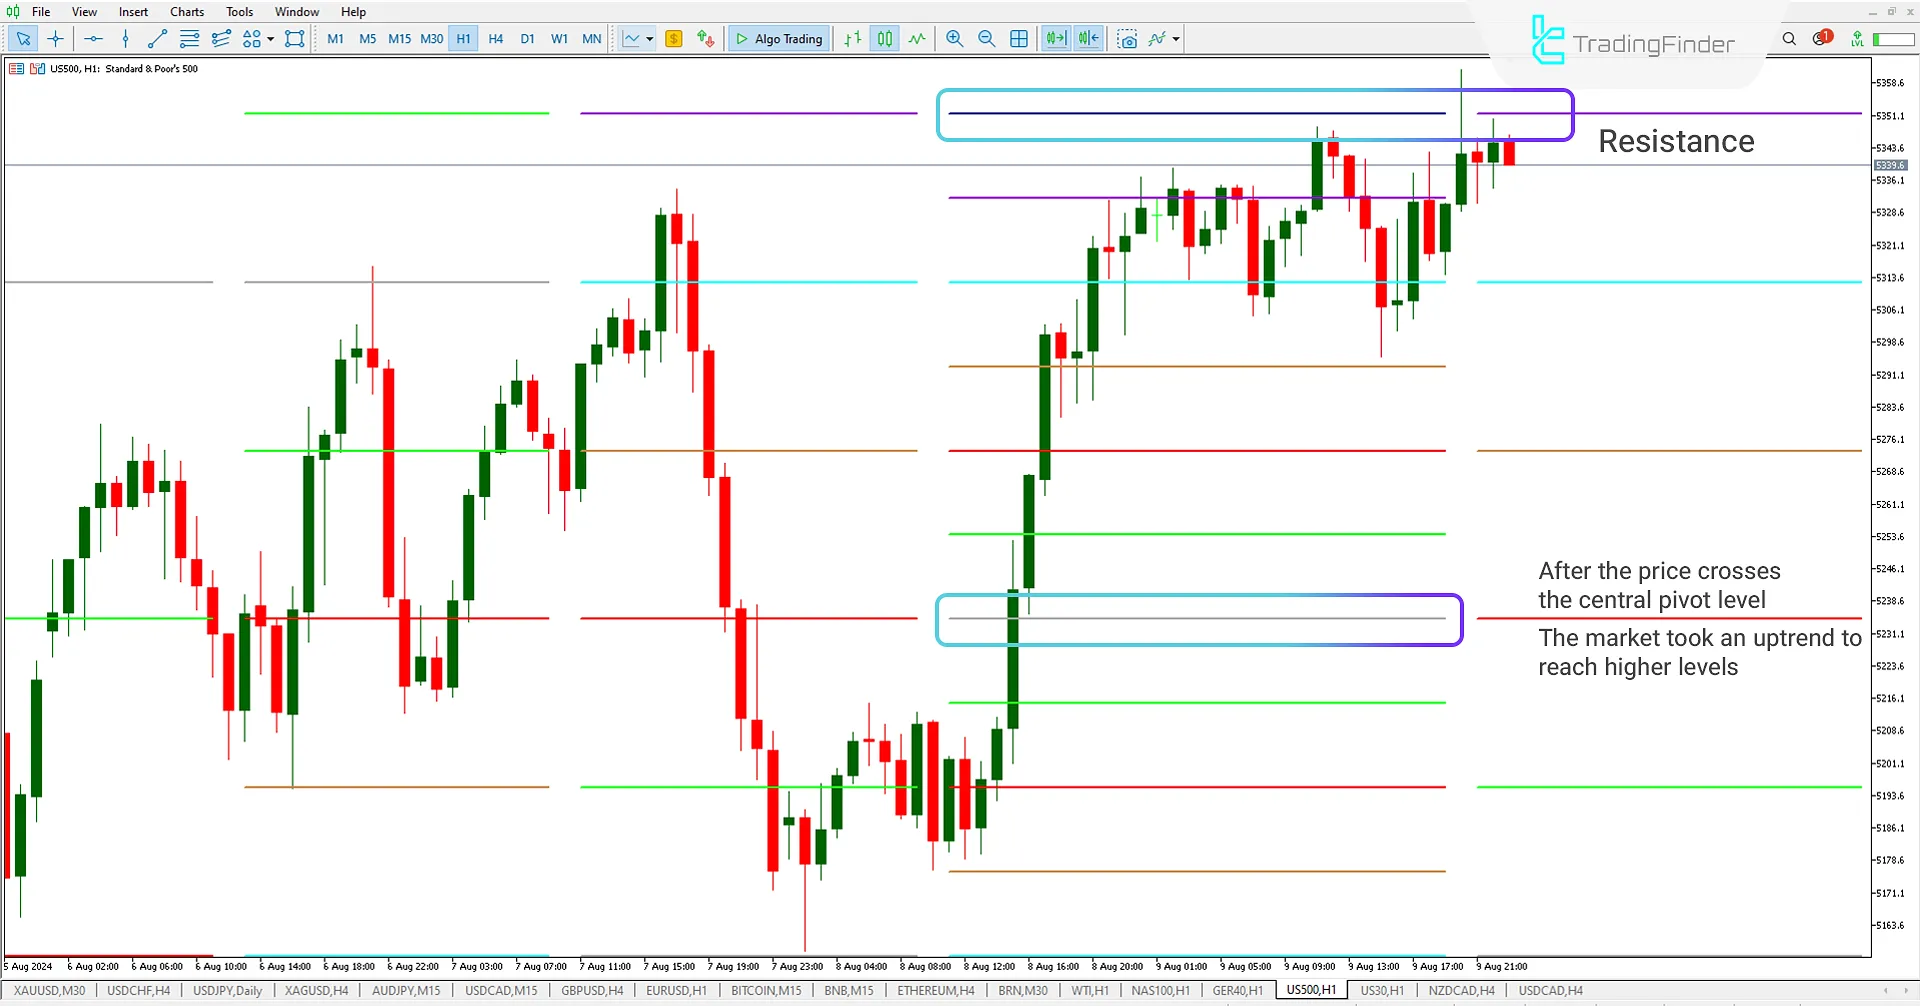
In the 1-hour chart of the US500 index, after breaking above the central level of 5234.2, the price enters an uptrend and moves toward higher levels. As the price gets closer to a level above the central level, it encounters more resistance. Finally, when the price reaches the highest level of the MM Indicator, it reacts and stops rising.

Bearish Trend (MM)
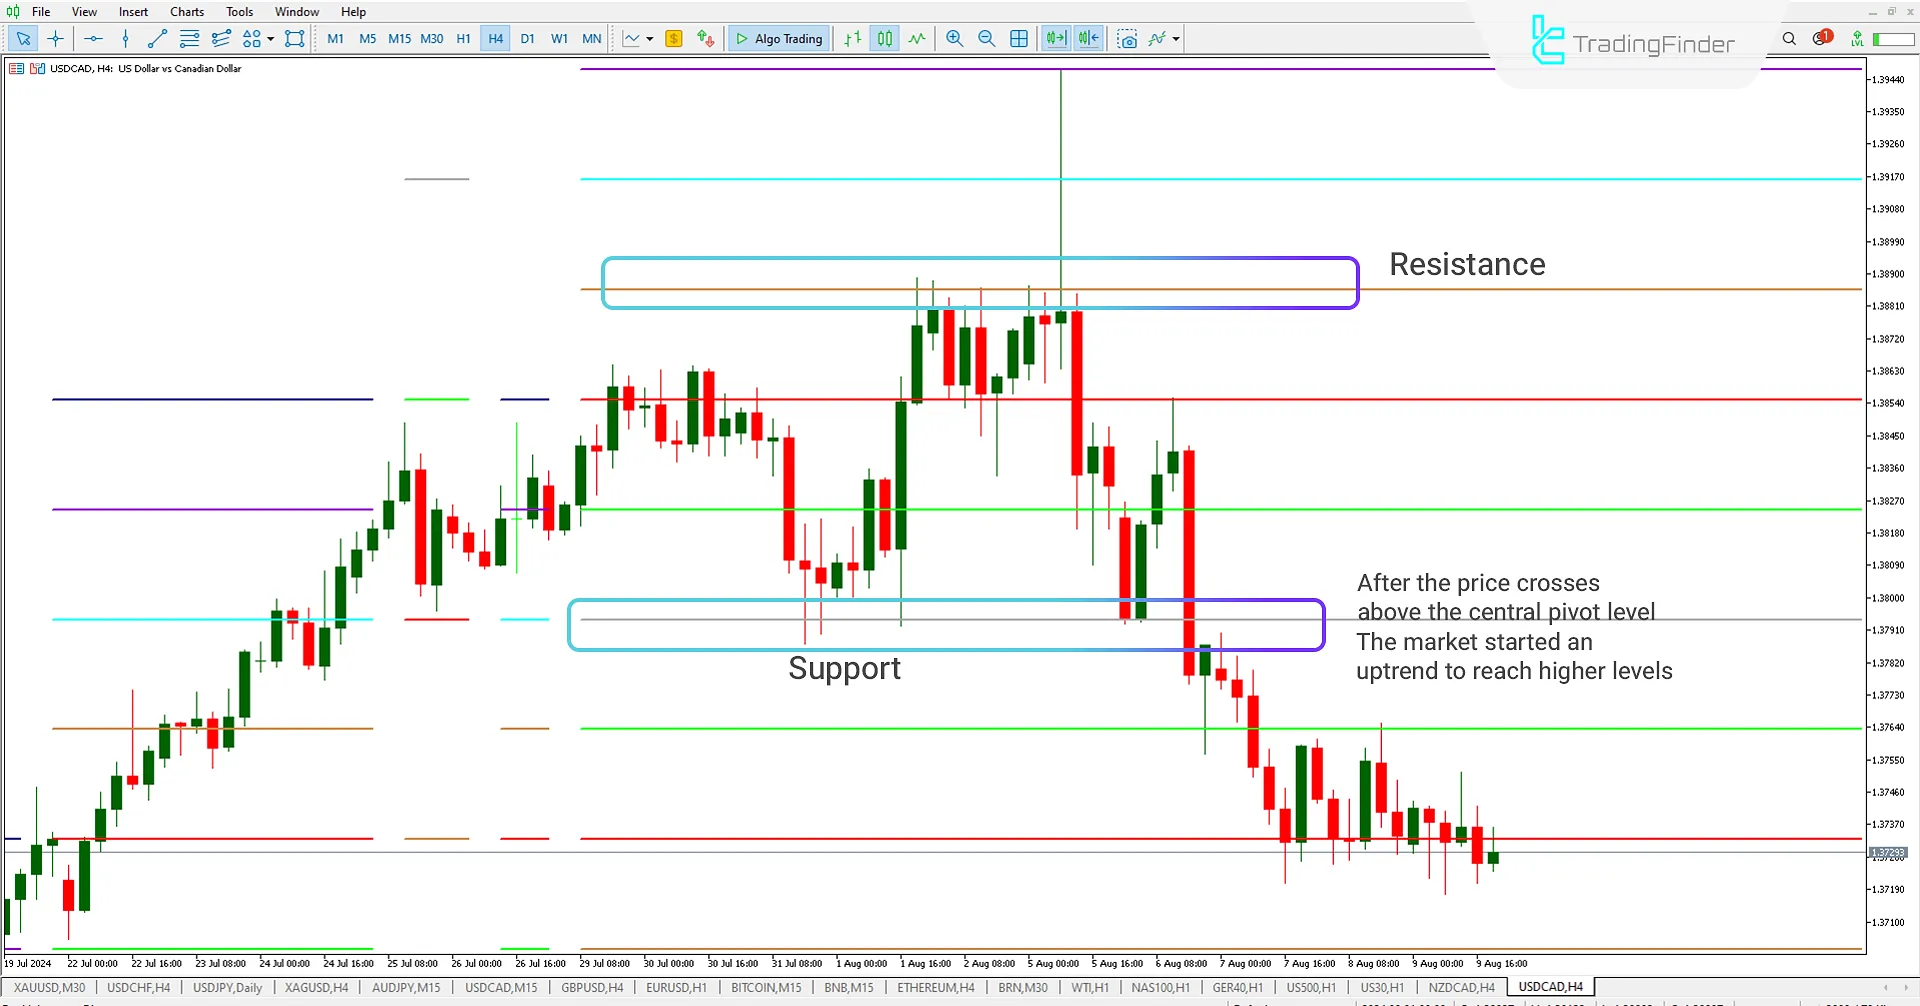
In the 4-hour chart of USD/CAD, after breaking below the central level of 1.37943, which acted as support, the price started a downtrend and moved toward lower price levels. Traders can use the price levels of the MM Indicator as support and resistance levels or for take-profit and stop-loss purposes.

MM Indicator Settings

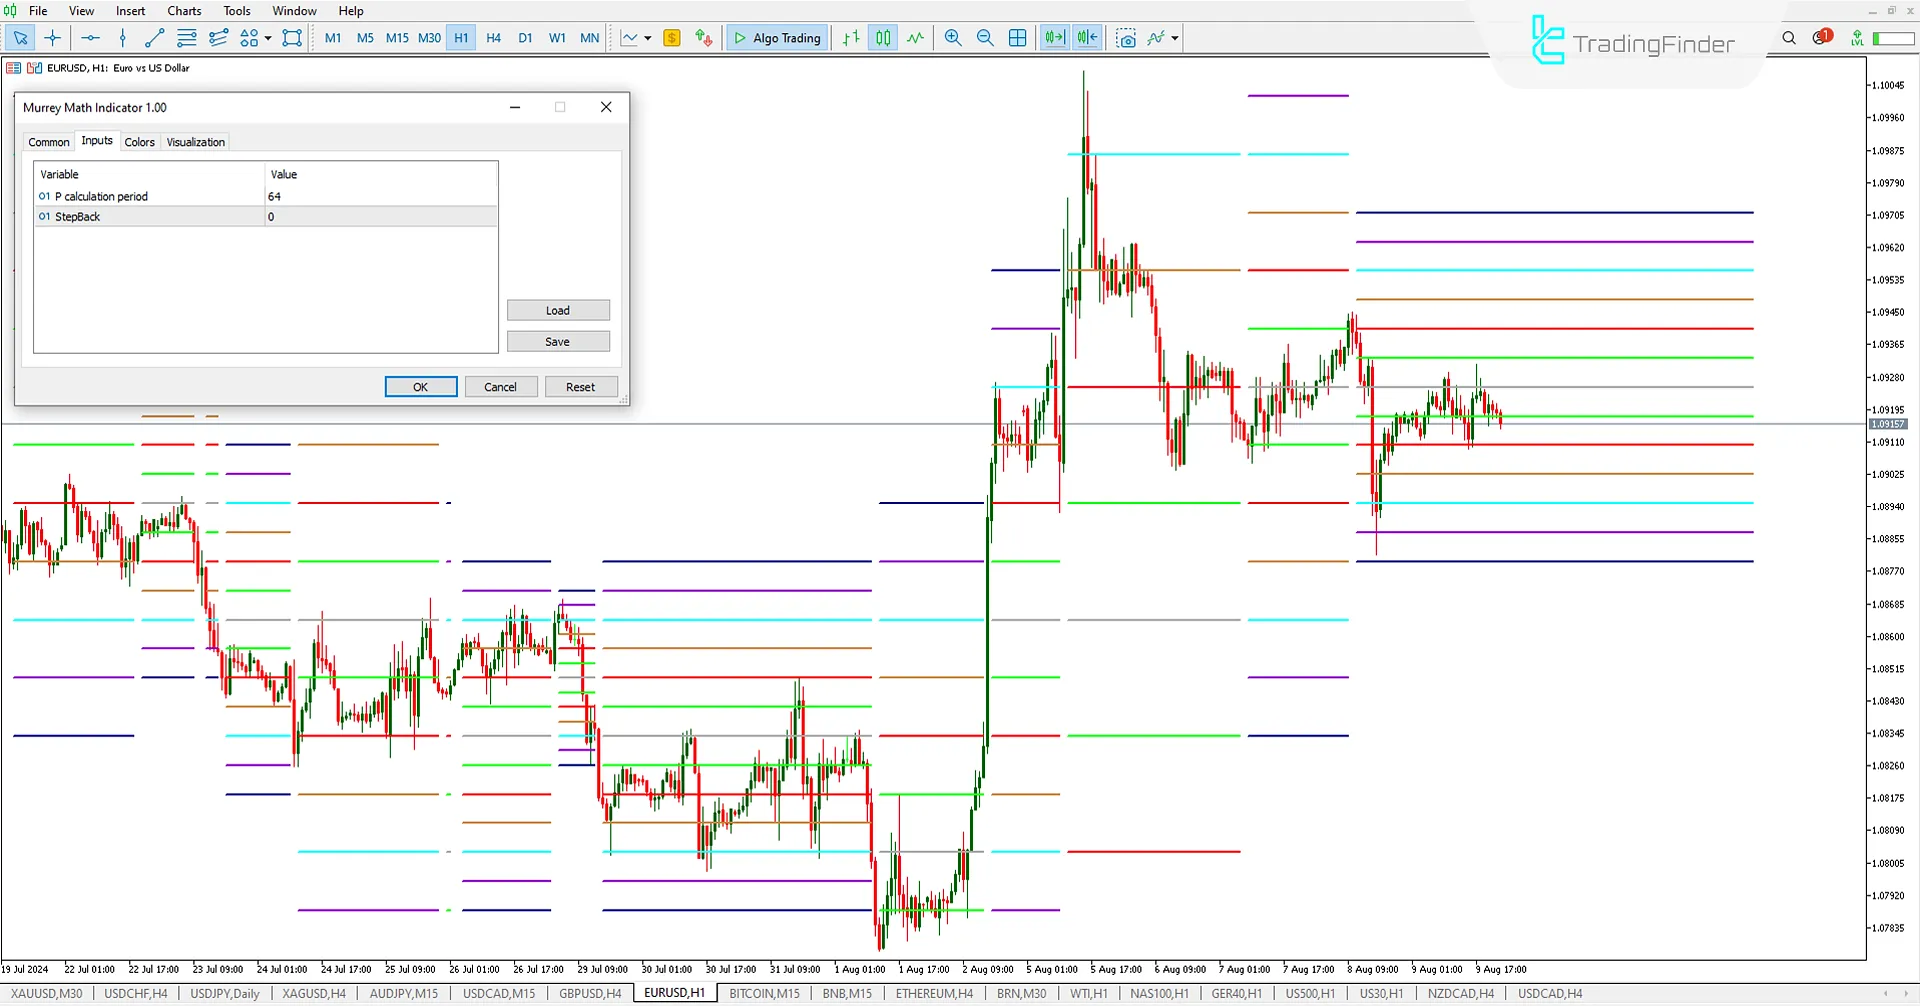
- P Calculation Period: Choose the period;
- Step Back: Choose the calculation starting point.
Conclusion
The Murrey Math (MM) Indicator is a powerful tool for identifying important price areas. Traders can use these levels to set their take profit and stop loss levels and levels indicator as support and resistance points in their trades.
Murrey Math MM MT5 PDF
Murrey Math MM MT5 PDF
Click to download Murrey Math MM MT5 PDFIs the Murrey Math Indicator suitable for all markets?
This indicator can be used in all markets, including stock markets, currencies, commodities, and even cryptocurrencies. However, its effectiveness may vary across different markets.
How can the Murrey Math Indicator be used in trading?
This indicator is used to identify price reversal points and to determine support and resistance levels. Traders typically enter or exit trades near strong levels such as 0/8, 4/8, and 8/8.


