![Navarro 200 Harmonic Pattern Indicator MT5 Download - Free - [TFlab]](https://cdn.tradingfinder.com/image/363989/13-118-en-navarro-200-harmonic-pattern-mt5-01.webp)
![Navarro 200 Harmonic Pattern Indicator MT5 Download - Free - [TFlab] 0](https://cdn.tradingfinder.com/image/363989/13-118-en-navarro-200-harmonic-pattern-mt5-01.webp)
![Navarro 200 Harmonic Pattern Indicator MT5 Download - Free - [TFlab] 1](https://cdn.tradingfinder.com/image/363990/13-118-en-navarro-200-harmonic-pattern-mt5-02.webp)
![Navarro 200 Harmonic Pattern Indicator MT5 Download - Free - [TFlab] 2](https://cdn.tradingfinder.com/image/363988/13-118-en-navarro-200-harmonic-pattern-mt5-03.webp)
![Navarro 200 Harmonic Pattern Indicator MT5 Download - Free - [TFlab] 3](https://cdn.tradingfinder.com/image/363991/13-118-en-navarro-200-harmonic-pattern-mt5-04.webp)
On July 2, 2025, in version 2, alert/notification and signal functionality was added to this indicator
The Navarro 200 Harmonic Pattern Indicator is a tool for identifying five-point XABCD harmonic structures, where Fibonacci ratios between the AB, BC, and CD legs are closely evaluated.
This indicator strongly emphasizes the accuracy of Fibonacci measurements and the identification of Potential Reversal Zones (PRZ).
Traders use the PRZ area, labeled as point "D" in the Navarro 200 indicator, to determine ideal entry and exit points. The trading tool visual layout displays bullish patterns in pink and bearish patterns in dark blue.
Navarro 200 Harmonic Pattern Indicator Specifications Table
The table below outlines the specifications of the Navarro 200 Harmonic Pattern Indicator:
Indicator Categories: | Chart & Classic MT5 Indicators Harmonic MT5 Indicators Candle Sticks MT5 Indicators |
Platforms: | MetaTrader 5 Indicators |
Trading Skills: | Intermediate |
Indicator Types: | Reversal MT5 Indicators |
Timeframe: | Multi-Timeframe MT5 Indicators |
Trading Style: | Intraday MT5 Indicators |
Trading Instruments: | Forex MT5 Indicators Crypto MT5 Indicators Stock MT5 Indicators Commodity MT5 Indicators Indices MT5 Indicators Share Stock MT5 Indicators |
Overview of the Navarro 200 Harmonic Reversal Indicator
In the Navarro 200 harmonic pattern indicator, a pattern is confirmed as a valid harmonic pattern structure only if all Fibonacci ratios precisely match the predefined standard values. These ratios are defined as follows:
- AB to XA ratio: between 0.382 to 0.618
- BC to AB ratio: between 0.382 to 0.886
- CD to BC ratio: between 1.618 to 2.618
- CD to XA (overall ratio): typically 0.786, 1.272, or 1.618, depending on the pattern type
Bullish Navarro 200 Pattern
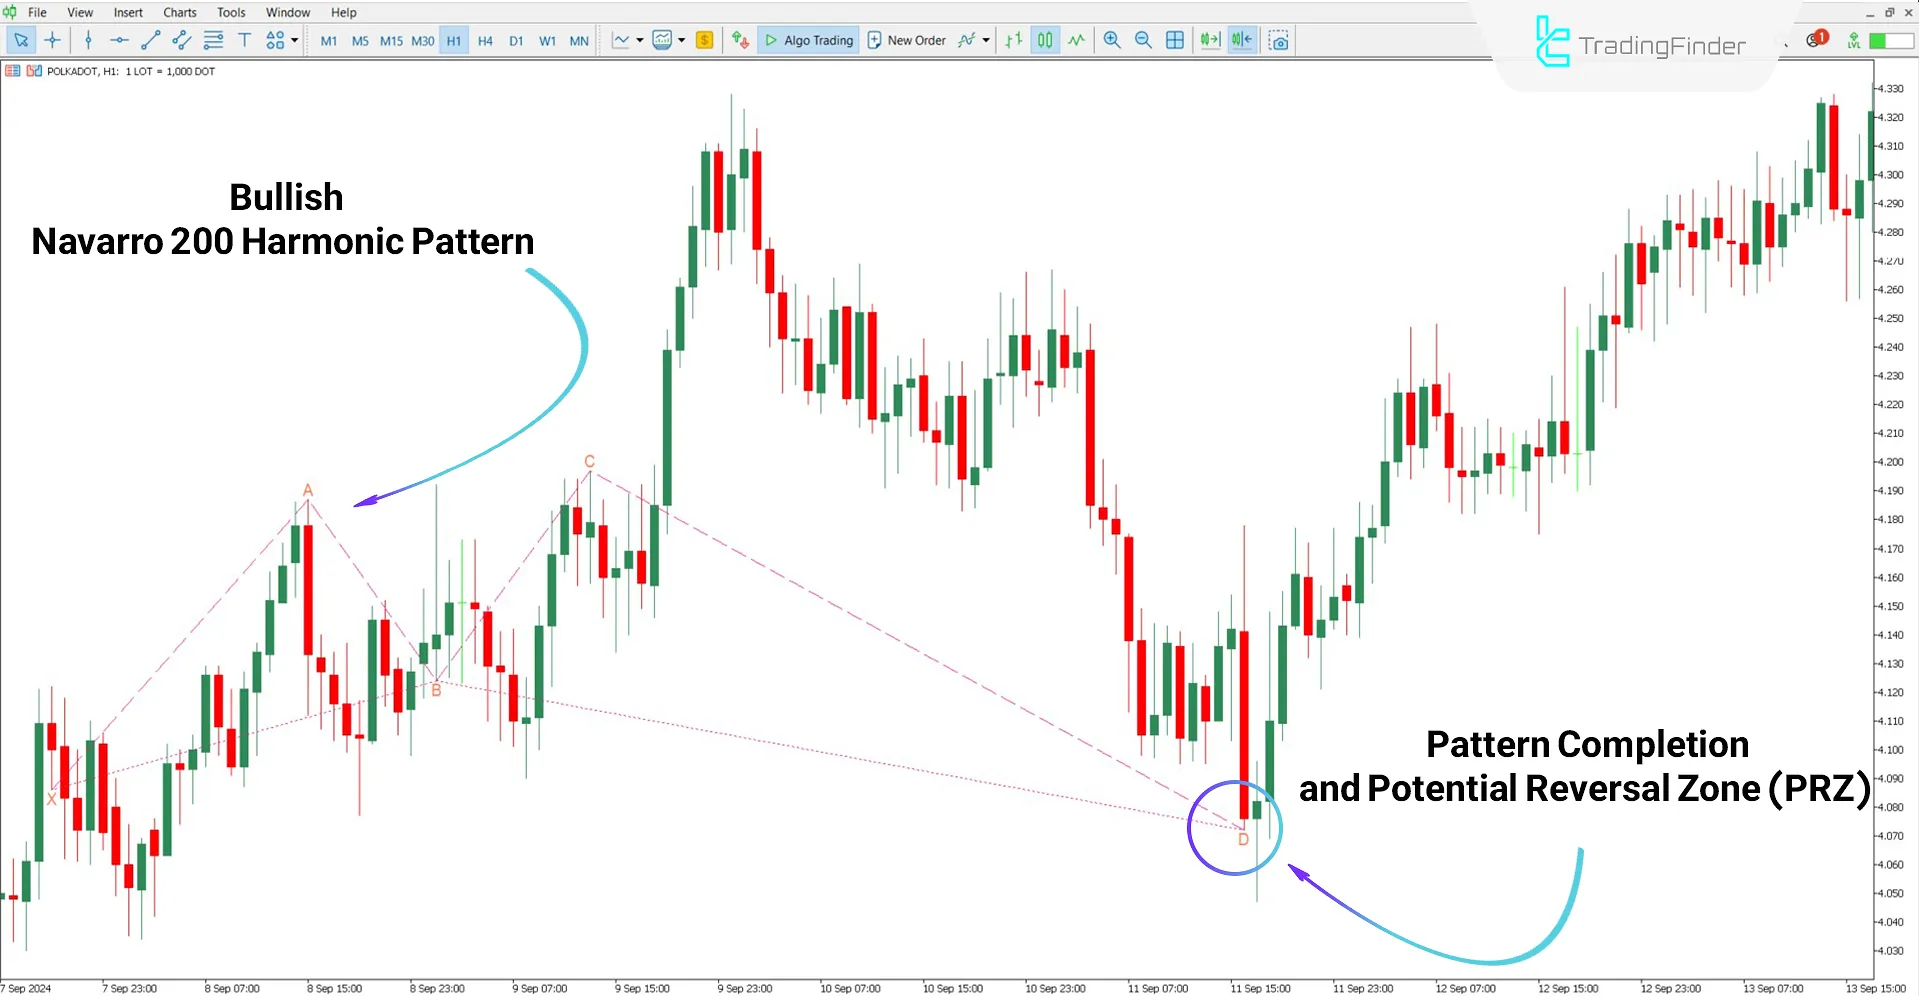
A 1-hour Polkadot (DOT) chart demonstrates how the Navarro 200 Harmonic Pattern Indicator works.
The chart shows that after the pattern completes at point "D," the price reverses and enters a bullish trend. Point "D" is considered the reversal zone and an entry point for buy trades.

Bearish Navarro 200 Pattern
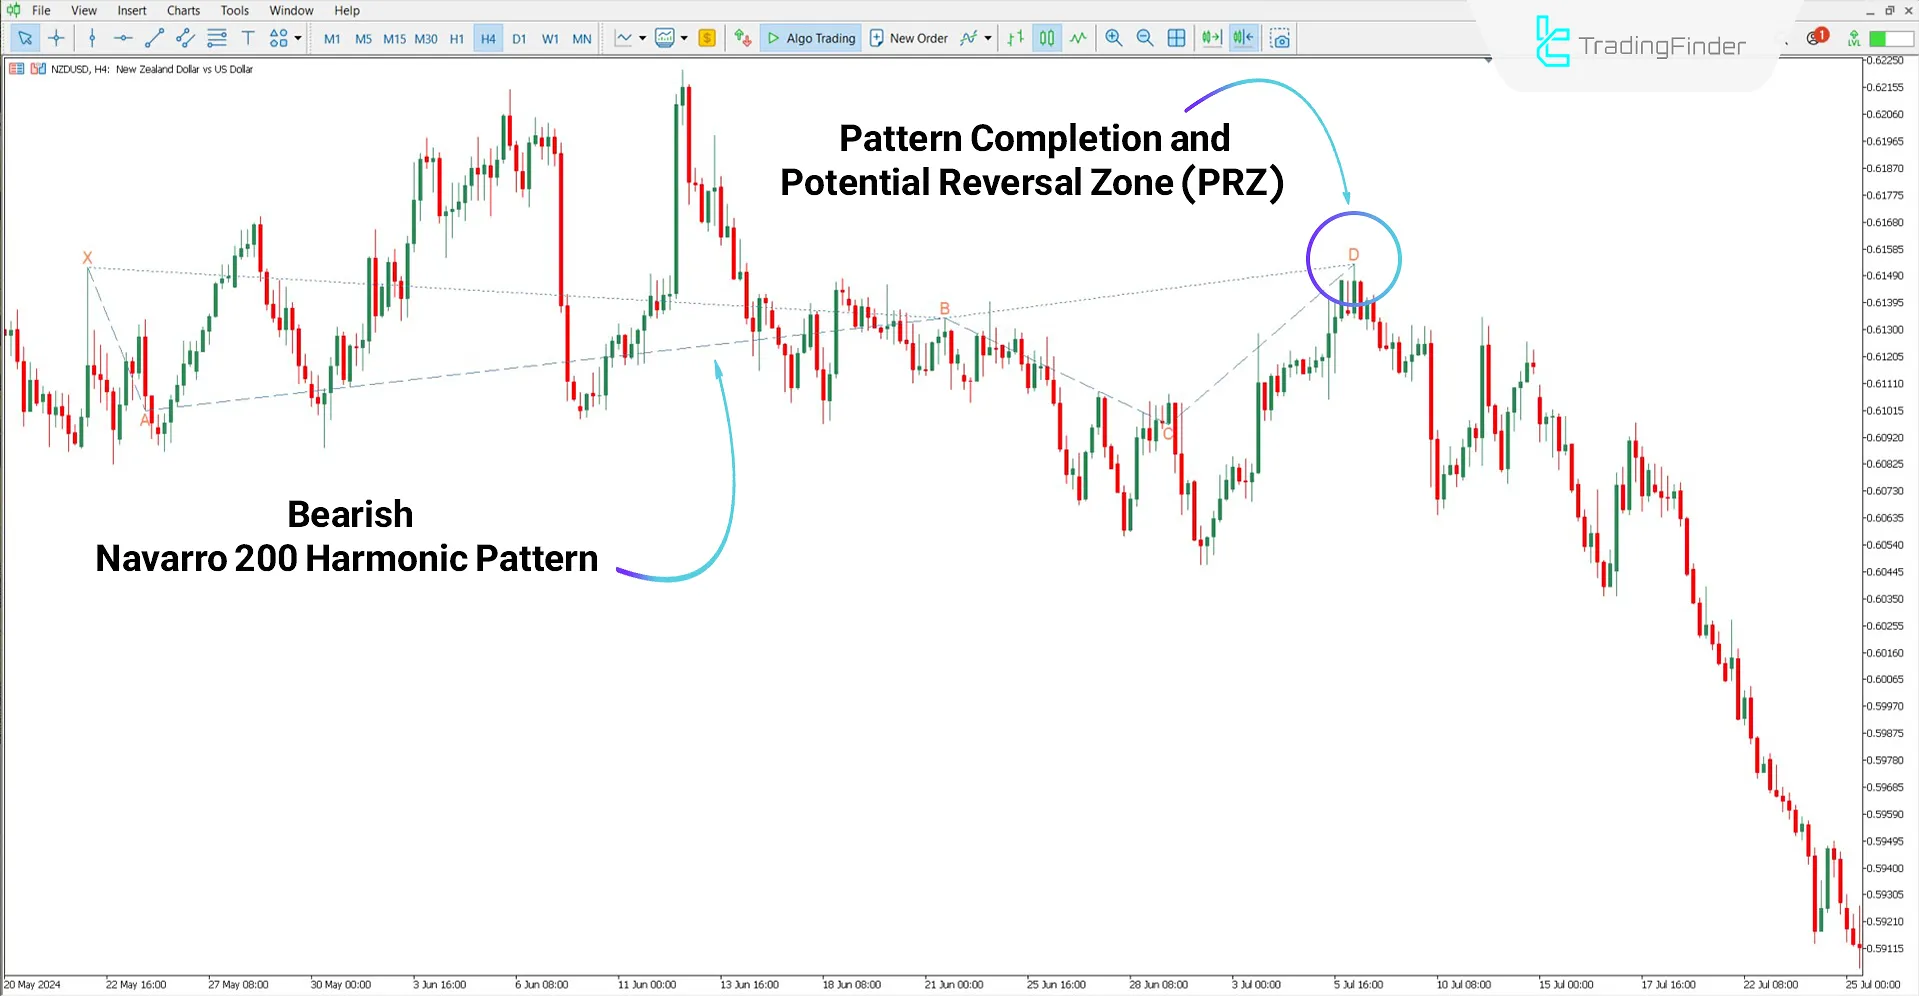
Based on a 4-hour chart of NZD/USD (New Zealand Dollar vs. US Dollar), the Navarro 200 indicator, displayed in blue, identifies a bearish harmonic pattern.
Point "D" represents the structure's completion and is considered suitable for entering short positions.

Navarro 200 Harmonic Pattern Indicator Settings
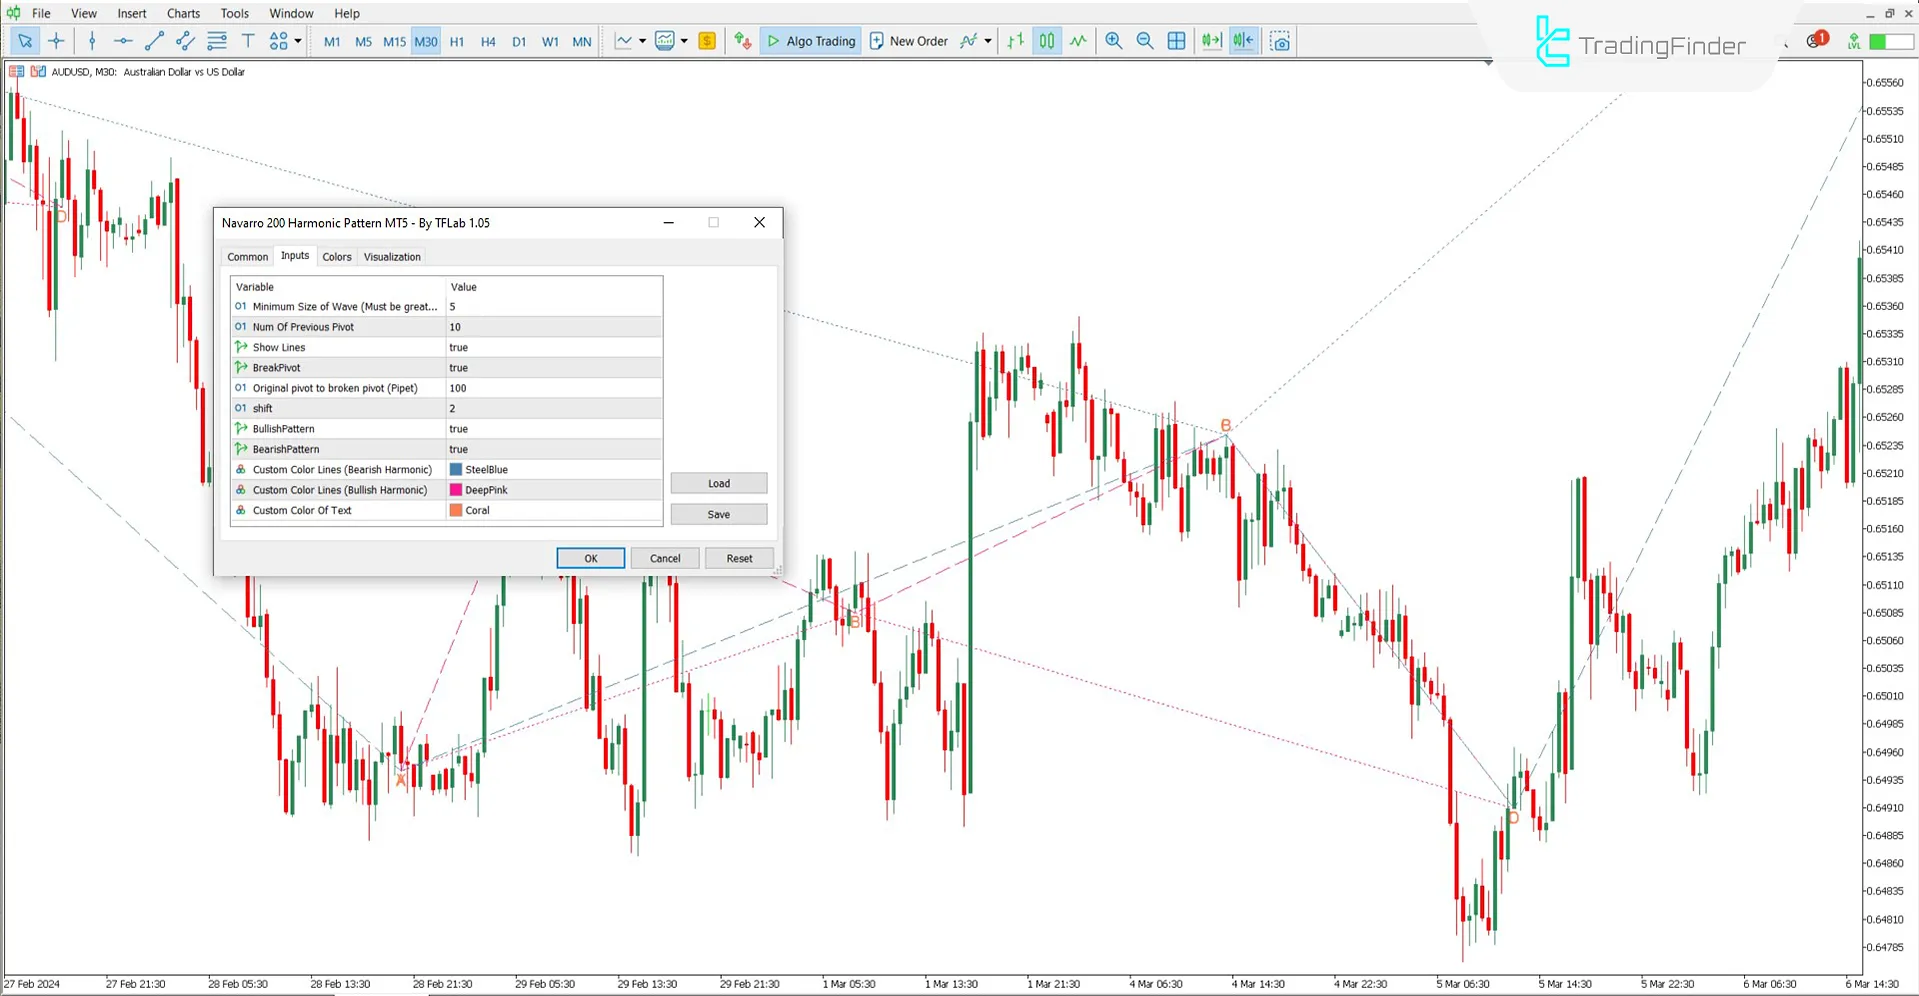
The image below shows the settings panel of the Navarro 200 Harmonic Pattern Indicator on MetaTrader 5:

- Minimum Length of Wave (candle): Minimum number of candles required to form each wave
- Num of Previous Candle: Number of past candles used to detect wave patterns
- Show Lines: Display harmonic structure lines
- Break Pivot: Toggle display of broken pivot lines
- Original pivot to broken pivot (Pipet): Permissible distance between the original and broken pivot points
- Shift: Move pattern lines forward or backward on the chart
- Bullish Pattern: Enable bullish pattern display
- Bearish Pattern: Enable bearish pattern display
- Custom Color Lines (Bearish Harmonic): Select a color for bearish pattern lines
- Custom Color Lines (Bullish Harmonic): Select a color for bullish pattern lines
- Custom Color of Text: Customize text and label colors
Conclusion
The Navarro 200 Harmonic Pattern Indicator identifies potential price reversal zones by charting specific bullish and bearish harmonic patterns.
It is widely applicable across various financial markets, including stocks, cryptocurrencies, forex and commodities.
Navarro 200 Harmonic Pattern MT5 PDF
Navarro 200 Harmonic Pattern MT5 PDF
Click to download Navarro 200 Harmonic Pattern MT5 PDFWhat is the Navarro 200 Harmonic Indicator?
The Navarro 200 is an analytical tool that detects five-point harmonic patterns with high precision on price charts.
What does PRZ mean?
PRZ stands for Potential Reversal Zone a price area where a trend will likely reverse.


