![New Aroon Up and Down Indicator for MetaTrader 5 - Free Download [TradingFinder]](https://cdn.tradingfinder.com/image/599032/2-168-en-new-aroon-up-and-down-mt5-1.webp)
![New Aroon Up and Down Indicator for MetaTrader 5 - Free Download [TradingFinder] 0](https://cdn.tradingfinder.com/image/599032/2-168-en-new-aroon-up-and-down-mt5-1.webp)
![New Aroon Up and Down Indicator for MetaTrader 5 - Free Download [TradingFinder] 1](https://cdn.tradingfinder.com/image/599026/2-168-en-new-aroon-up-and-down-mt5-2.webp)
![New Aroon Up and Down Indicator for MetaTrader 5 - Free Download [TradingFinder] 2](https://cdn.tradingfinder.com/image/599030/2-168-en-new-aroon-up-and-down-mt5-3.webp)
![New Aroon Up and Down Indicator for MetaTrader 5 - Free Download [TradingFinder] 3](https://cdn.tradingfinder.com/image/599027/2-168-en-new-aroon-up-and-down-mt5-4.webp)
The New Aroon Up and Down Indicator operates on the MetaTrader 5 platform based on timing price movements.
This indicator counts the number of candlesticks since the last High and Low within a specified period, evaluates the strength and momentum of the trend using a linear oscillator, and identifies entry signals for buy and sell trades by displaying blue and red arrows.
New Aroon Up and Down Indicator Table
The general specifications of the New Aroon Up and Down Indicator for MetaTrader 5 are shown in the table below:
Indicator Categories: | Oscillators MT5 Indicators Signal & Forecast MT5 Indicators Momentum Indicators in MT5 |
Platforms: | MetaTrader 5 Indicators |
Trading Skills: | Elementary |
Indicator Types: | Reversal MT5 Indicators |
Timeframe: | Multi-Timeframe MT5 Indicators |
Trading Style: | Intraday MT5 Indicators |
Trading Instruments: | Forex MT5 Indicators Crypto MT5 Indicators Stock MT5 Indicators Commodity MT5 Indicators Indices MT5 Indicators Share Stock MT5 Indicators |
New Aroon Up and Down Indicator at a Glance
The New Aroon Up and Down Indicator highlights bullish and bearish market conditions with blue and red arrows:
- In a bullish trend, when the Aroon Up line moves at higher levels and approaches the value of 100, it indicates buyers’ strength;
- In a bearish trend, when the Aroon Down line stabilizes at higher ranges, it reflects sellers’ pressure.
Additionally, the oscillator chart at the bottom of the screen displays the intensity and persistence of the trend.
Indicator in an Uptrend
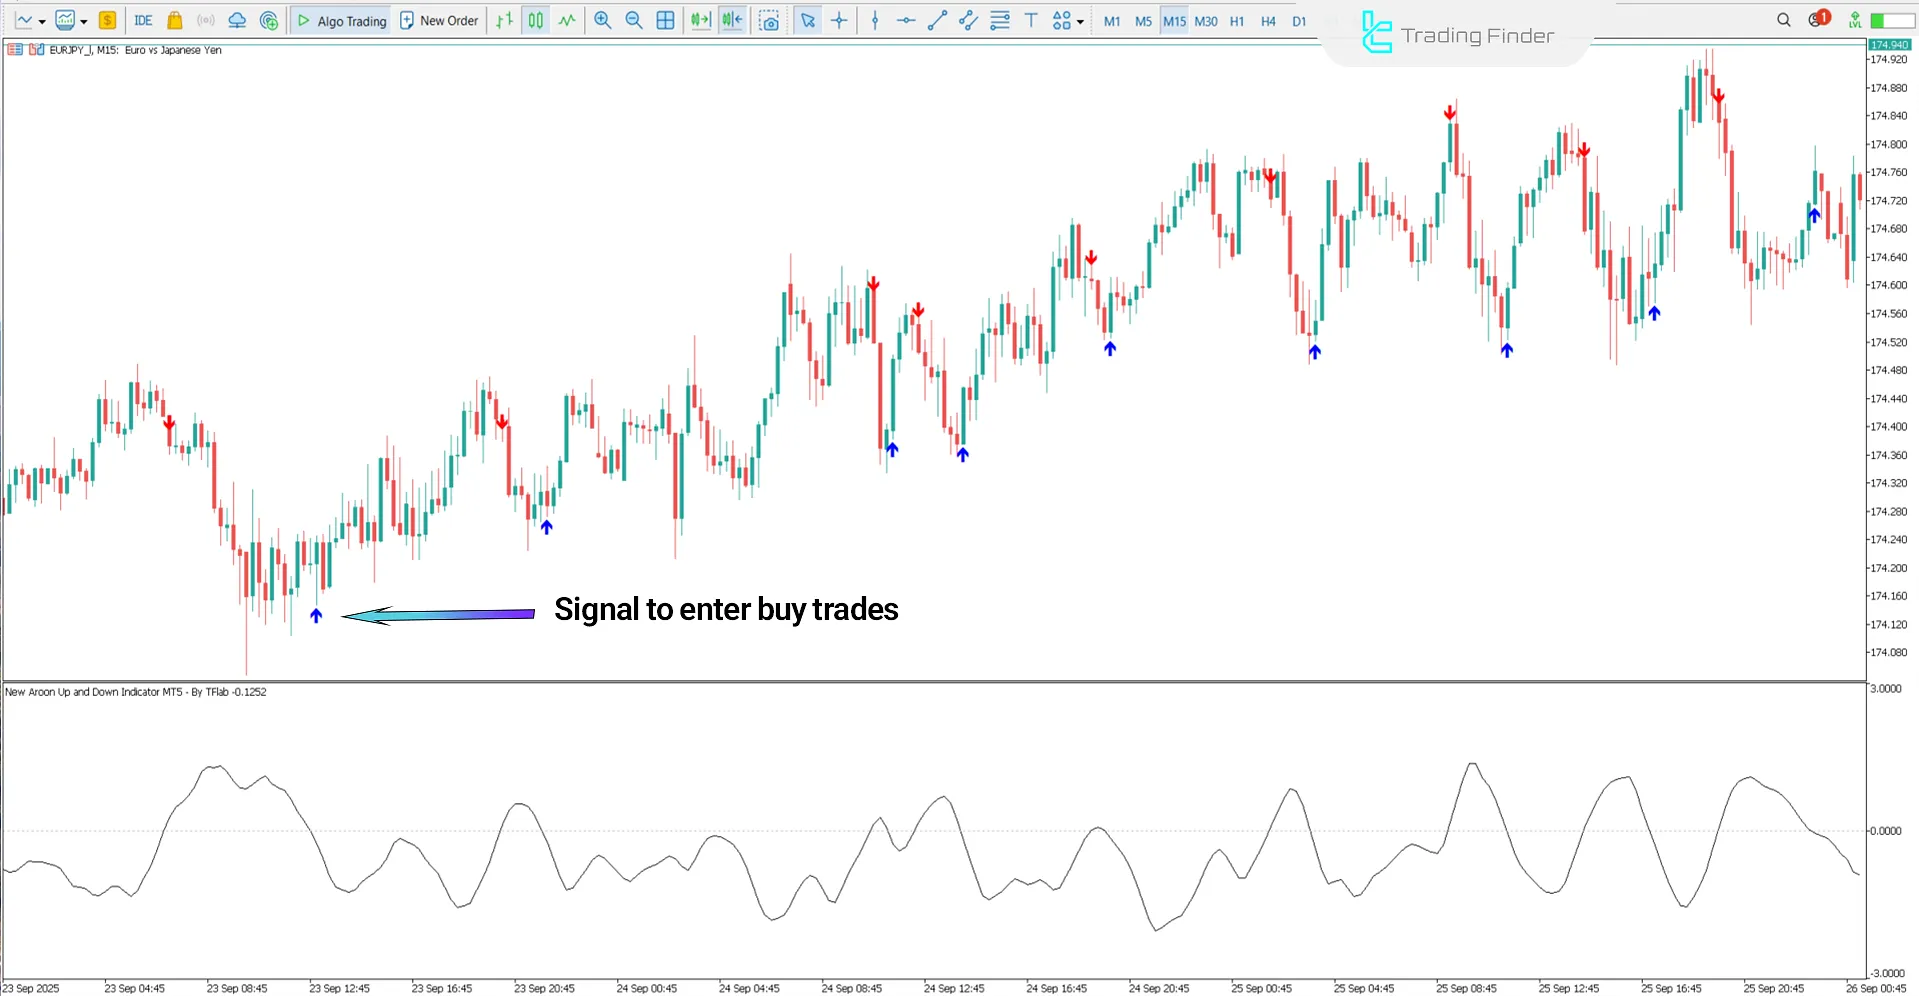
When the Aroon Up line crosses the Aroon Down line, bullish conditions are formed. At the same time, an increase in the oscillator value toward the +3 level indicates buyers’ pressure and strengthens the market’s bullish momentum.
In this case, blue arrows on the chart mark buy entry points.

Indicator in a Downtrend
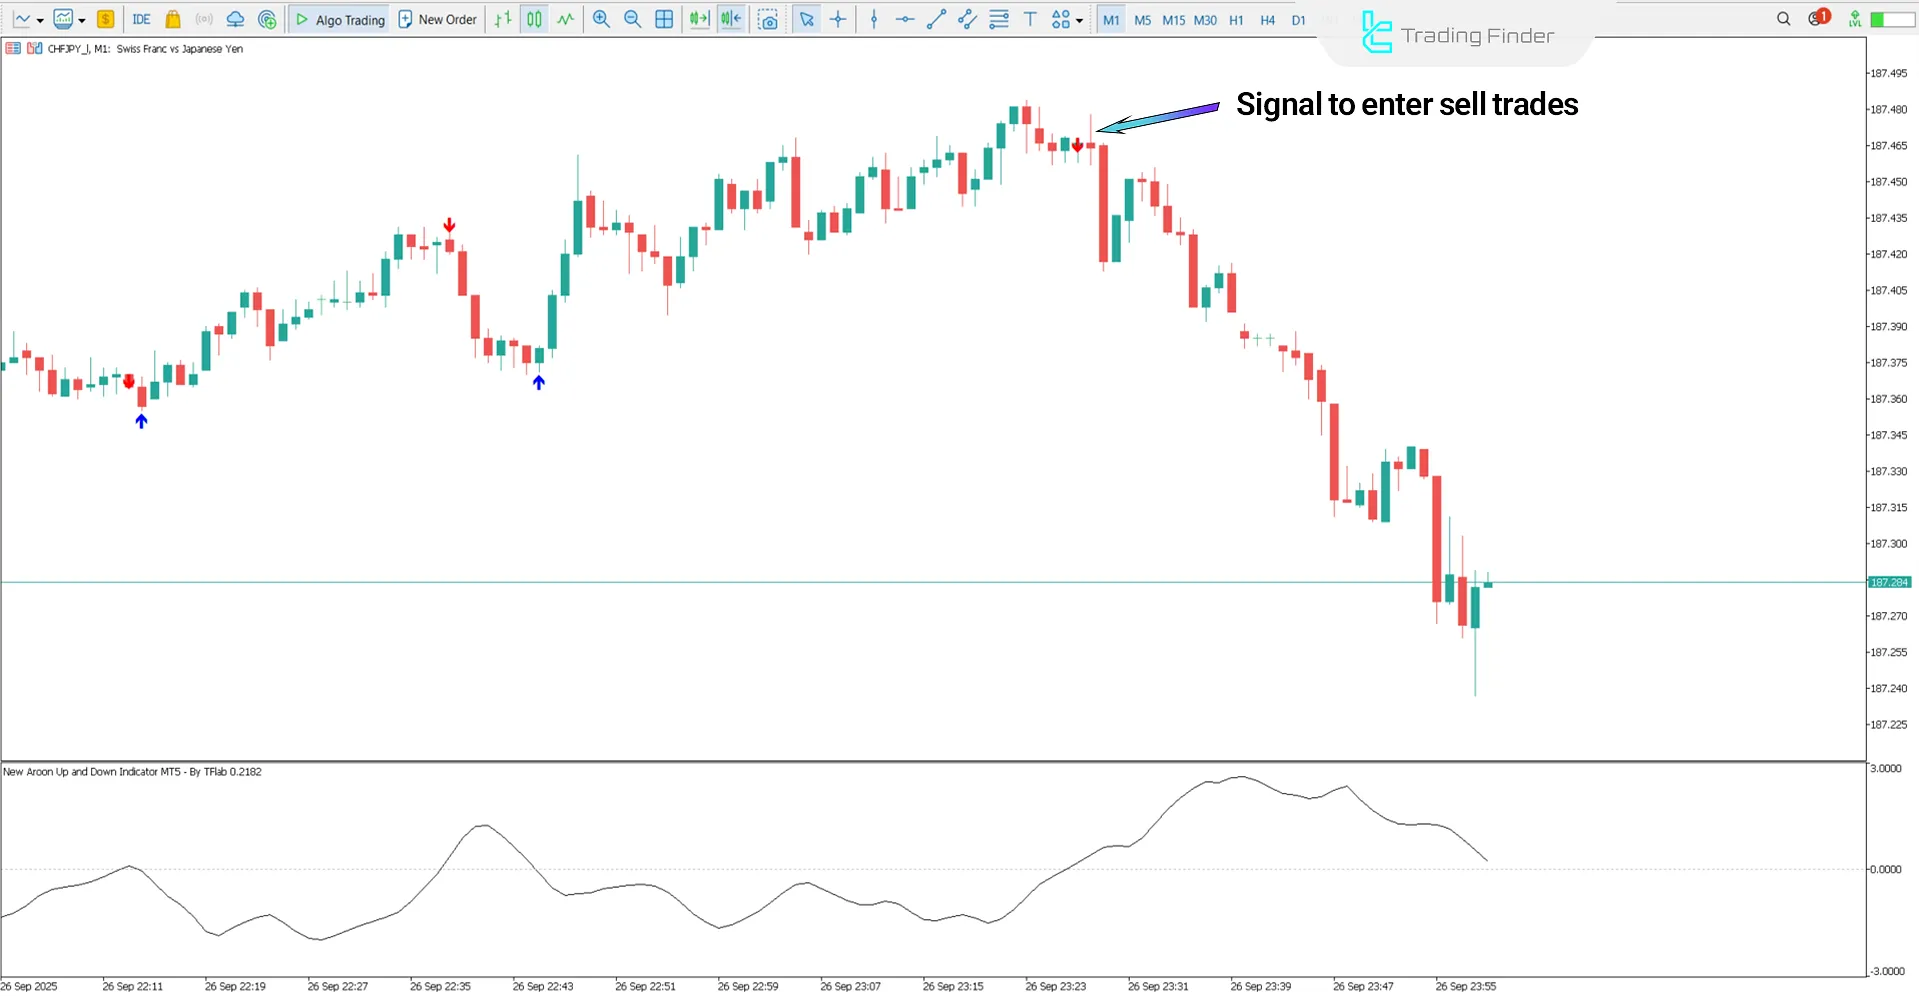
When the Aroon Down line crosses the Aroon Up line, bearish conditions occur. After this setup, consecutive red candlesticks appear, and the chart enters a bearish correction phase.
In such conditions, red arrows on the chart highlight sell entry signals.

New Aroon Up and Down Indicator Settings
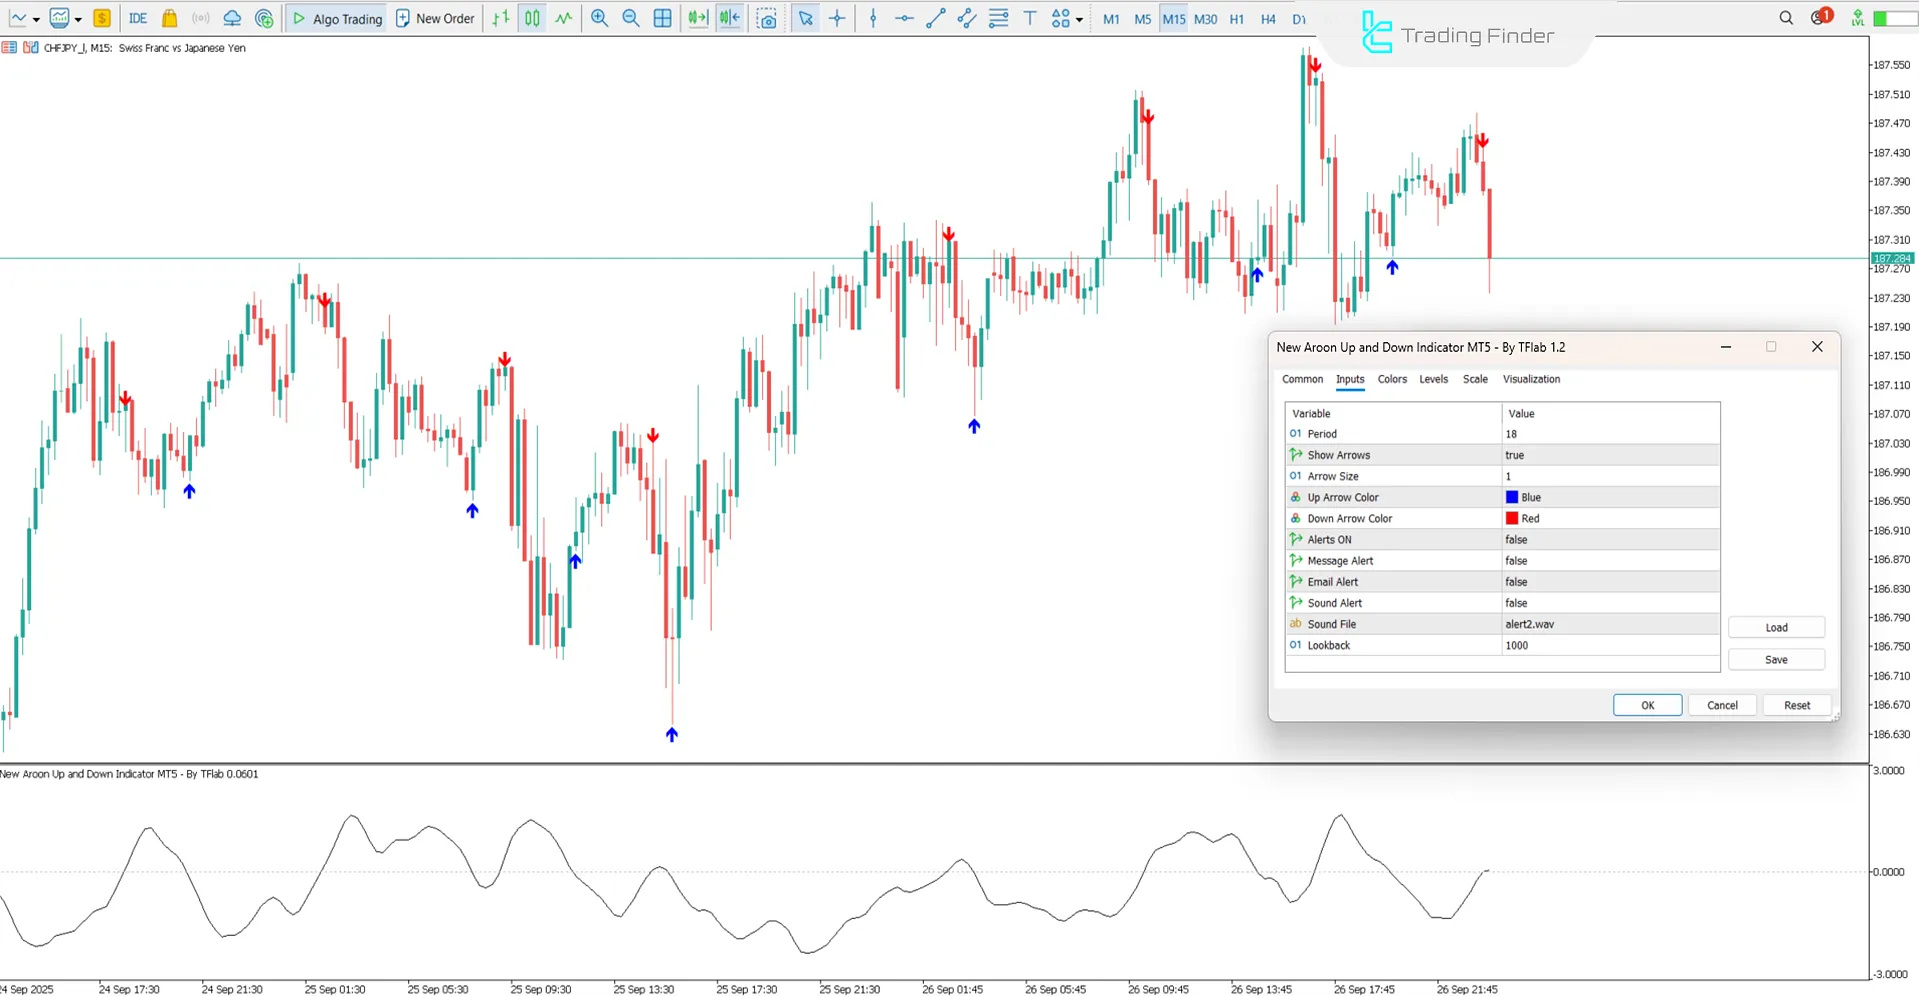
The image below shows the settings panel of the New Aroon Up and Down Indicator:

- Period: Defines the number of periods for indicator calculation
- Show Arrows: Enable or disable displaying arrows on the chart
- Arrow Size: Specify the size of the arrows
- Up Arrow Color: Select the color of bullish arrows
- Down Arrow Color: Select the color of bearish arrows
- Alerts ON: Enable or disable general alerts
- Message Alert: Display alerts as text messages on the platform
- Email Alert: Send alerts via email
- Sound Alert: Play an audio alert when a signal occurs
- Sound File: Select a preferred audio file for alerts
- Lookback: Analyze the number of past candlesticks
Conclusion
The New Aroon Up and Down Indicator combines visual signals and an oscillator fluctuating within the ±3 range to provide precise identification of entry and exit points.
In this trading tool, blue arrows signal the beginning of bullish momentum, while red arrows confirm increasing selling pressure.
New Aroon Up and Down Indicator for MetaTrader 5 PDF
New Aroon Up and Down Indicator for MetaTrader 5 PDF
Click to download New Aroon Up and Down Indicator for MetaTrader 5 PDFWhat does the New Aroon Up and Down Indicator do?
This indicator calculates the strength and momentum of the trend based on the distance between candlesticks from the last high and low, and it displays bullish and bearish market conditions with visual signals.
What does the oscillator in the New Aroon Up and Down Indicator represent?
The oscillator fluctuates within the ±3 range and reflects the intensity and persistence of the trend with positive or negative values.


