![Normalized Volume Indicator MT5 Download - Free - [TradingFinder]](https://cdn.tradingfinder.com/image/162294/13-49-en-normalized-volume-mt5-01.webp)
![Normalized Volume Indicator MT5 Download - Free - [TradingFinder] 0](https://cdn.tradingfinder.com/image/162294/13-49-en-normalized-volume-mt5-01.webp)
![Normalized Volume Indicator MT5 Download - Free - [TradingFinder] 1](https://cdn.tradingfinder.com/image/162295/13-49-en-normalized-volume-mt5-02.webp)
![Normalized Volume Indicator MT5 Download - Free - [TradingFinder] 2](https://cdn.tradingfinder.com/image/162296/13-49-en-normalized-volume-mt5-03.webp)
![Normalized Volume Indicator MT5 Download - Free - [TradingFinder] 3](https://cdn.tradingfinder.com/image/162293/13-49-en-normalized-volume-mt5-04.webp)
The Normalized Volume Indicator is part of the MetaTrader 5 indicator series, which significantly analyzes and compares current trading volume with its historical average.
This trading tool uses colored bars (as a histogram) to display the strengths and weaknesses of price movements to traders. Additionally, it uses a dashed line to create a Signal Threshold in the oscillator section.
Specifications Table of the Normalized Volume Indicator
Indicator Categories: | Oscillators MT5 Indicators Currency Strength MT5 Indicators Trading Assist MT5 Indicators |
Platforms: | MetaTrader 5 Indicators |
Trading Skills: | Elementary |
Indicator Types: | Reversal MT5 Indicators |
Timeframe: | Daily-Weekly Timeframe MT5 Indicators |
Trading Style: | Day Trading MT5 Indicators |
Trading Instruments: | Forex MT5 Indicators Crypto MT5 Indicators Stock MT5 Indicators Commodity MT5 Indicators Indices MT5 Indicators Forward MT5 Indicators Share Stock MT5 Indicators |
Indicator Overview
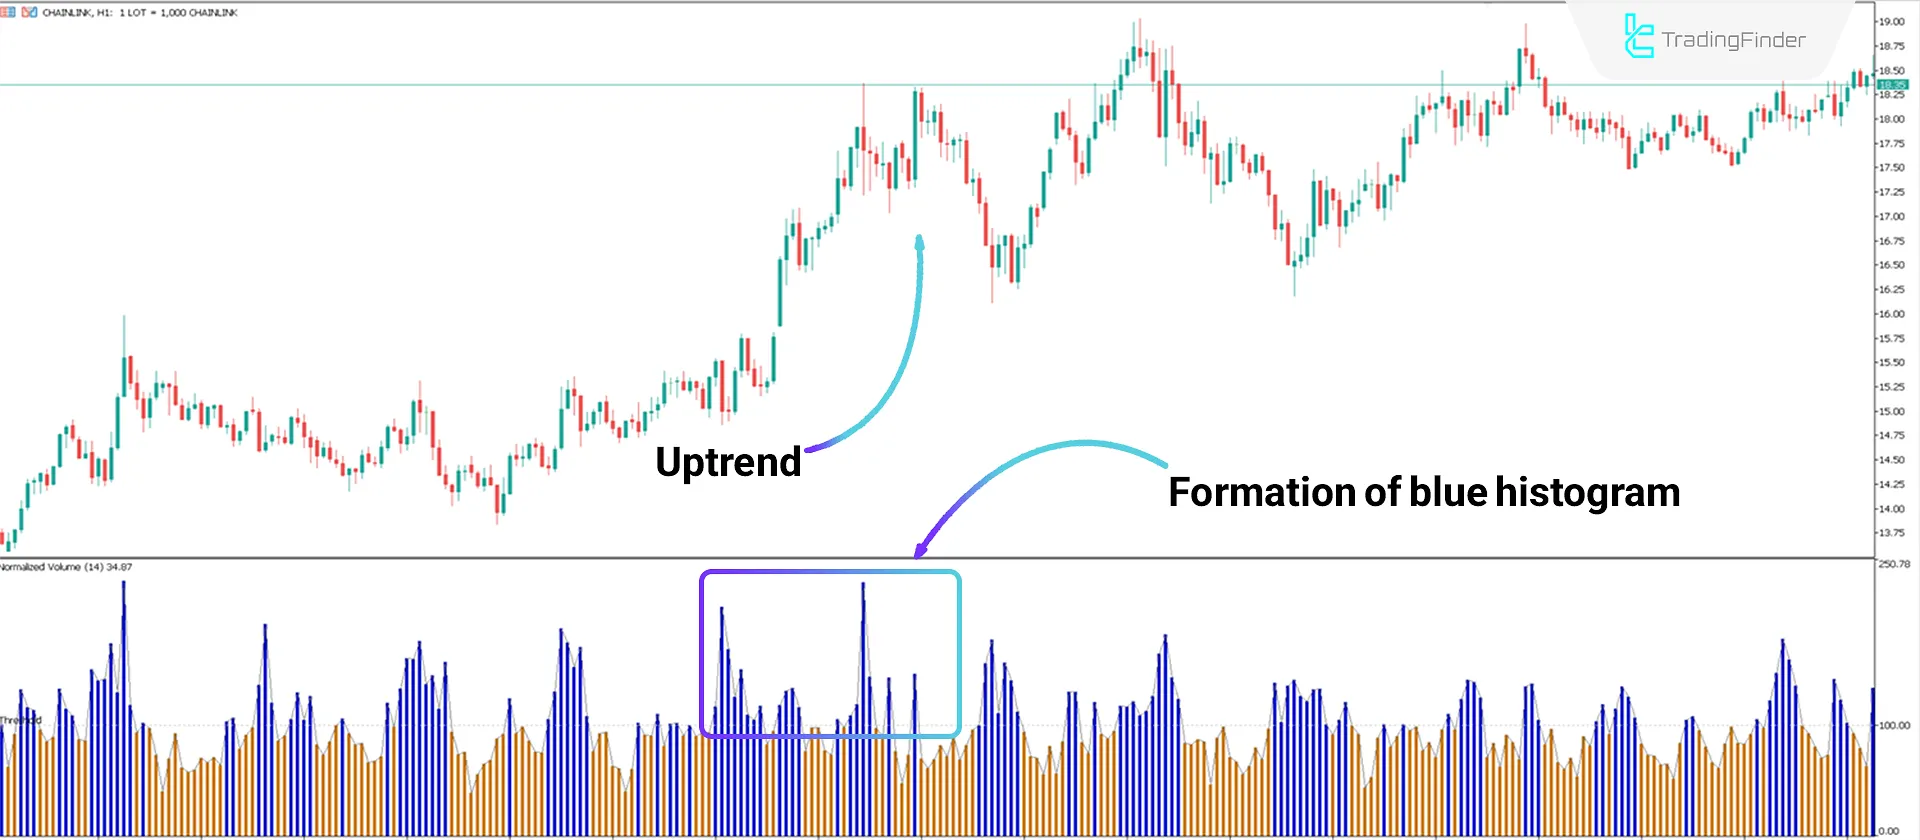
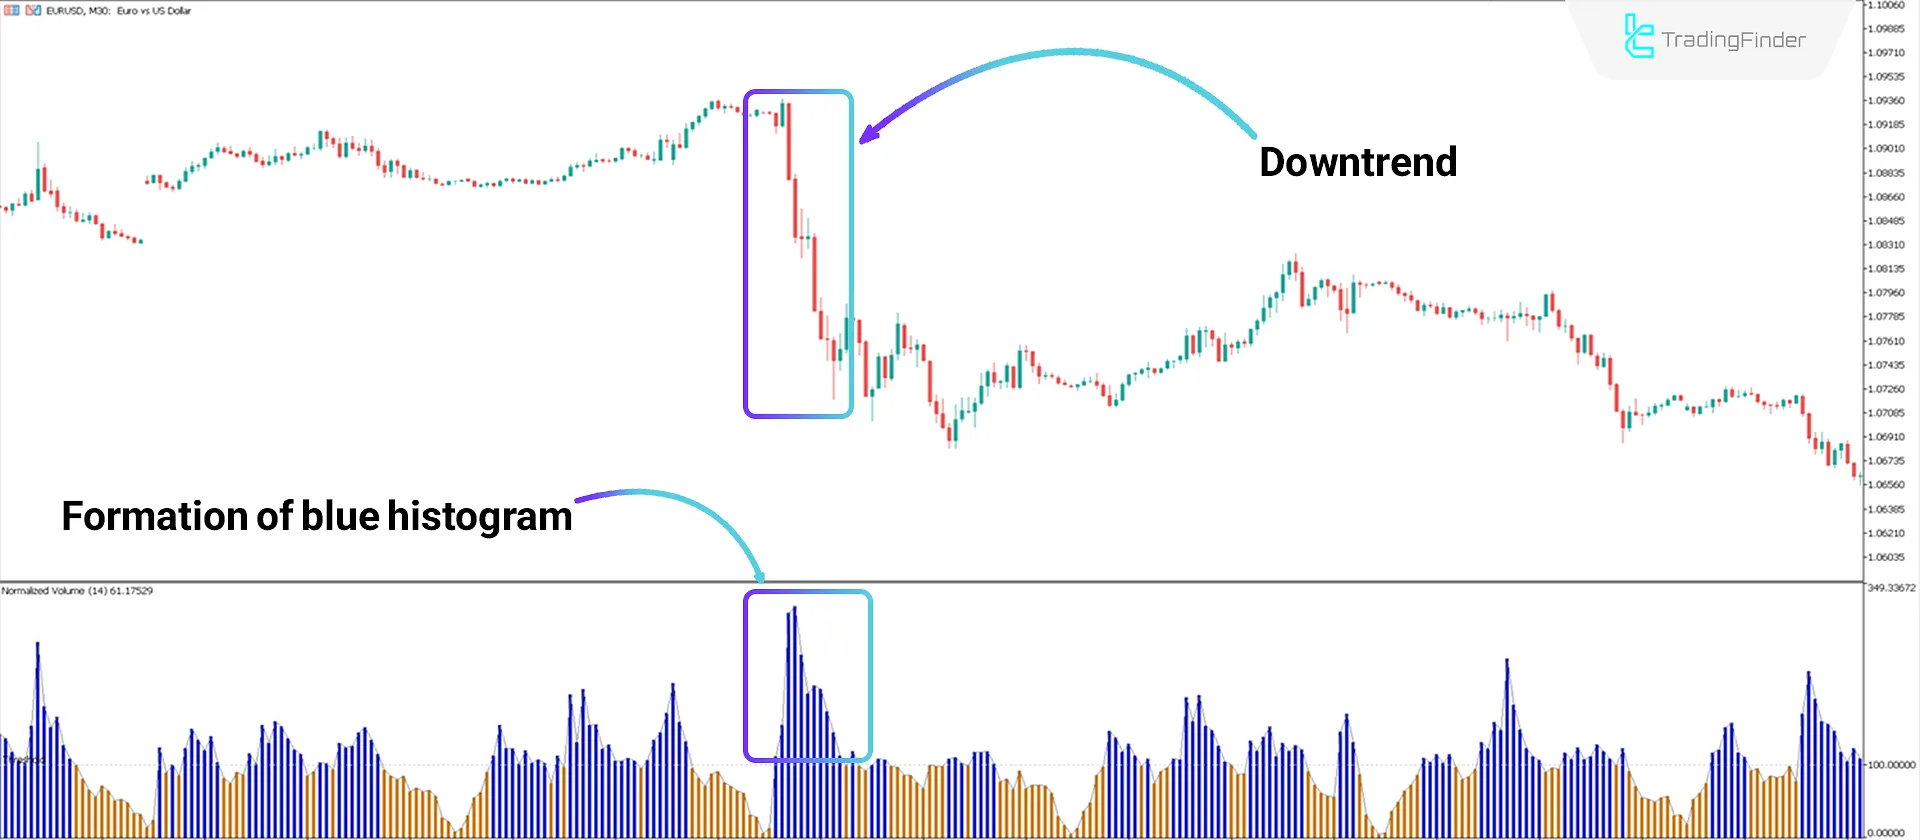
The Normalized Volume indicator normalizes trading volume over a specific timeframe and indicates whether trading activity is above or below normal levels. The blue bars show higher volumes than normal, while the orange bars indicate lower than normal levels.
Uptrend Conditions
Based on the Chainlink cryptocurrency price chart in a 1-hour timeframe, the price trend was upward, and the histogram consistently formed blue bars (indicating volume higher than normal).
In such conditions, traders can consider the formation of blue bars in the positive oscillator phase as the beginning of an uptrend.

Downtrend Conditions
According to the EUR/USD currency pair chart in a 30-minute timeframe, the price trend was downward, and the histogram consistently formed blue bars (indicating volume higher than normal).
In such conditions, traders can consider the formation of blue bars in the positive oscillator phase as the beginning of a downtrend.

Indicator Settings

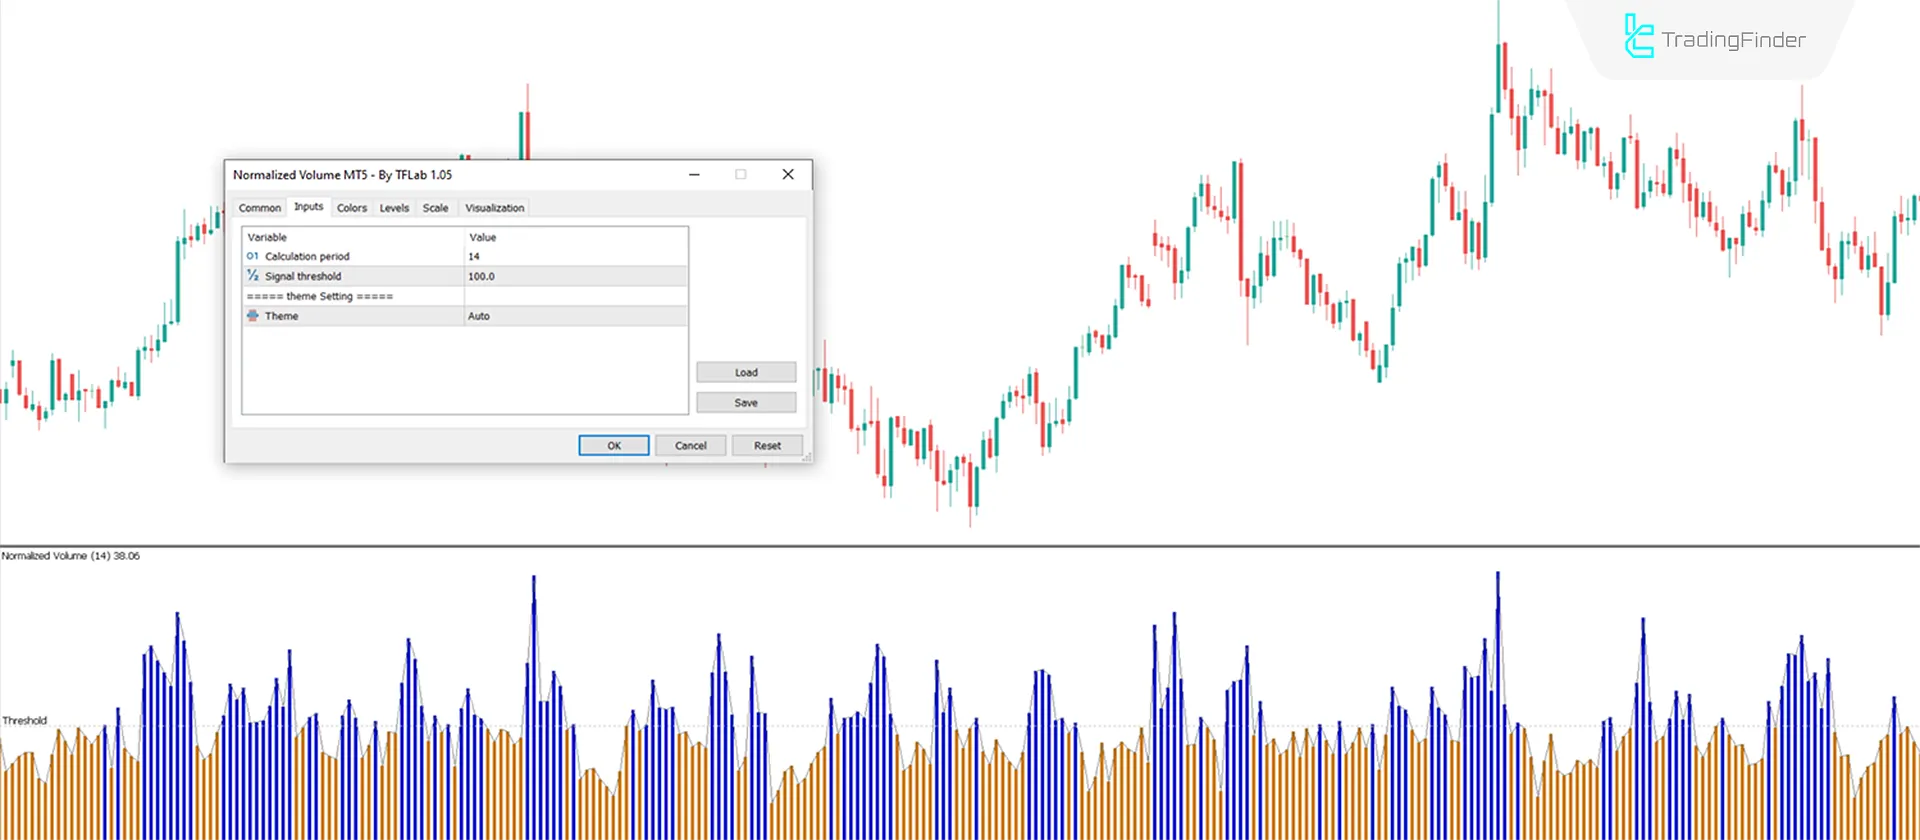
- Calculation Period: The number of candles used to calculate the normal volume is 14;
- Signal Threshold: The threshold value for identifying high or low volume is 100.0;
- Theme Setting: Indicator theme.
Conclusion
The Normalized Volume Indicator in MetaTrader 5 is a tool that visually displays market activity at each moment using a histogram.
This currency strength indicator effectively identifies the strengths and weaknesses of price movements and displays unusual Forex market fluctuations to traders.
Using this information, analysts can better understand price behavior and potential trend changes.
Normalized Volume MT5 PDF
Normalized Volume MT5 PDF
Click to download Normalized Volume MT5 PDFHow do I use the indicator's colored bars?
Blue bars indicate volumes higher than normal, while orange bars indicate volumes lower than normal, helping to quickly identify market conditions.
What is the role of the Signal Threshold?
The Signal Threshold allows traders to identify unusual volumes and use these levels to detect potential changes in the market.


