![On-Balance Volume (OBV) Divergence Indicator for MT5 Download - Free - [TFLab]](https://cdn.tradingfinder.com/image/106414/10-9-en-obv-divergence-mt5.webp)
![On-Balance Volume (OBV) Divergence Indicator for MT5 Download - Free - [TFLab] 0](https://cdn.tradingfinder.com/image/106414/10-9-en-obv-divergence-mt5.webp)
![On-Balance Volume (OBV) Divergence Indicator for MT5 Download - Free - [TFLab] 1](https://cdn.tradingfinder.com/image/31700/10-09-en-obv-divergence-mt5-02.avif)
![On-Balance Volume (OBV) Divergence Indicator for MT5 Download - Free - [TFLab] 2](https://cdn.tradingfinder.com/image/31705/10-09-en-obv-divergence-mt5-03.avif)
![On-Balance Volume (OBV) Divergence Indicator for MT5 Download - Free - [TFLab] 3](https://cdn.tradingfinder.com/image/31708/10-09-en-obv-divergence-mt5-04.avif)
On June 22, 2025, in version 2, alert/notification functionality was added to this indicator
The Automatic On Balance Volume Divergence (OBV Divergence) Indicator in MetaTrader 5 is a momentum oscillator that, like other automatic divergence tools, examines divergences on the price chart.
This tool draws a line in the Metatrader5 oscillator window, showing the divergence and marking buy and sell positions (Buy-Sell) on the price chart.
Divergences identified by this oscillator are signs of potential market trend reversals that occur when price changes and order volume are contradictory.
Indicator Table
Indicator Categories: | Oscillators MT5 Indicators Signal & Forecast MT5 Indicators Volatility MT5 Indicators |
Platforms: | MetaTrader 5 Indicators |
Trading Skills: | Elementary |
Indicator Types: | Non-Repaint MT5 Indicators Reversal MT5 Indicators |
Timeframe: | M1-M5 Timeframe MT5 Indicators M15-M30 Timeframe MT5 Indicators H1-H4 Timeframe MT5 Indicators |
Trading Style: | Intraday MT5 Indicators Scalper MT5 Indicators Day Trading MT5 Indicators |
Trading Instruments: | Forex MT5 Indicators Crypto MT5 Indicators Stock MT5 Indicators Share Stock MT5 Indicators |
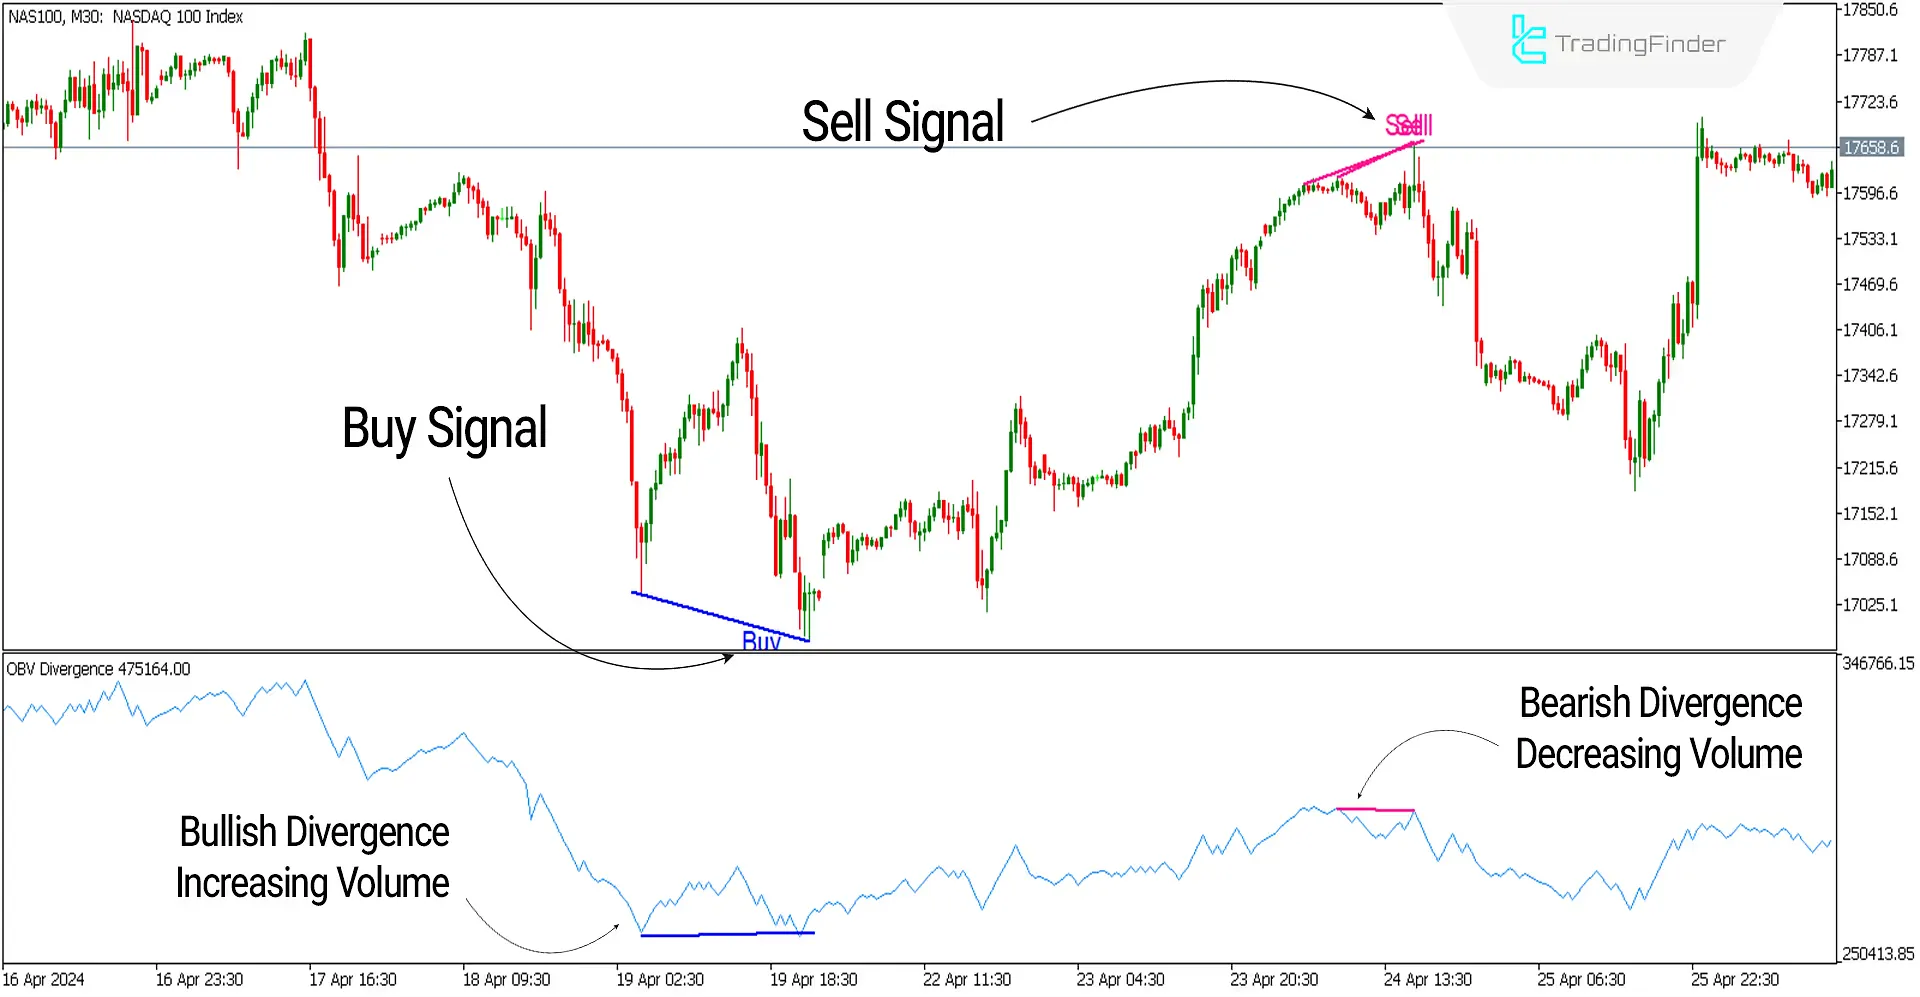
The image below shows the NASDAQ index chart with the symbol [NAS100] in a 30-minute timeframe.
On the left side of the image, at the end of a downtrend, the indicator detects a Bullish Divergence and issues a buy signal on the chart. Similarly, on the right side of the image, a Bearish Divergence is detected at the end of an uptrend, and a sell signal appears on the chart.

Overview
One reliable indicator for market trend reversals is the presence of divergences. The Automatic On Balance Volume Divergence (OBV Divergence) indicator, like other divergence detection tools, is a technical analysis tool that identifies the discrepancy between price performance and the direction of the indicator.
Divergence in trading volume is a sign of a potential market trend change, allowing the identification of the flow of buy and sell orders in the market.
Buy Signal (Buy Position)
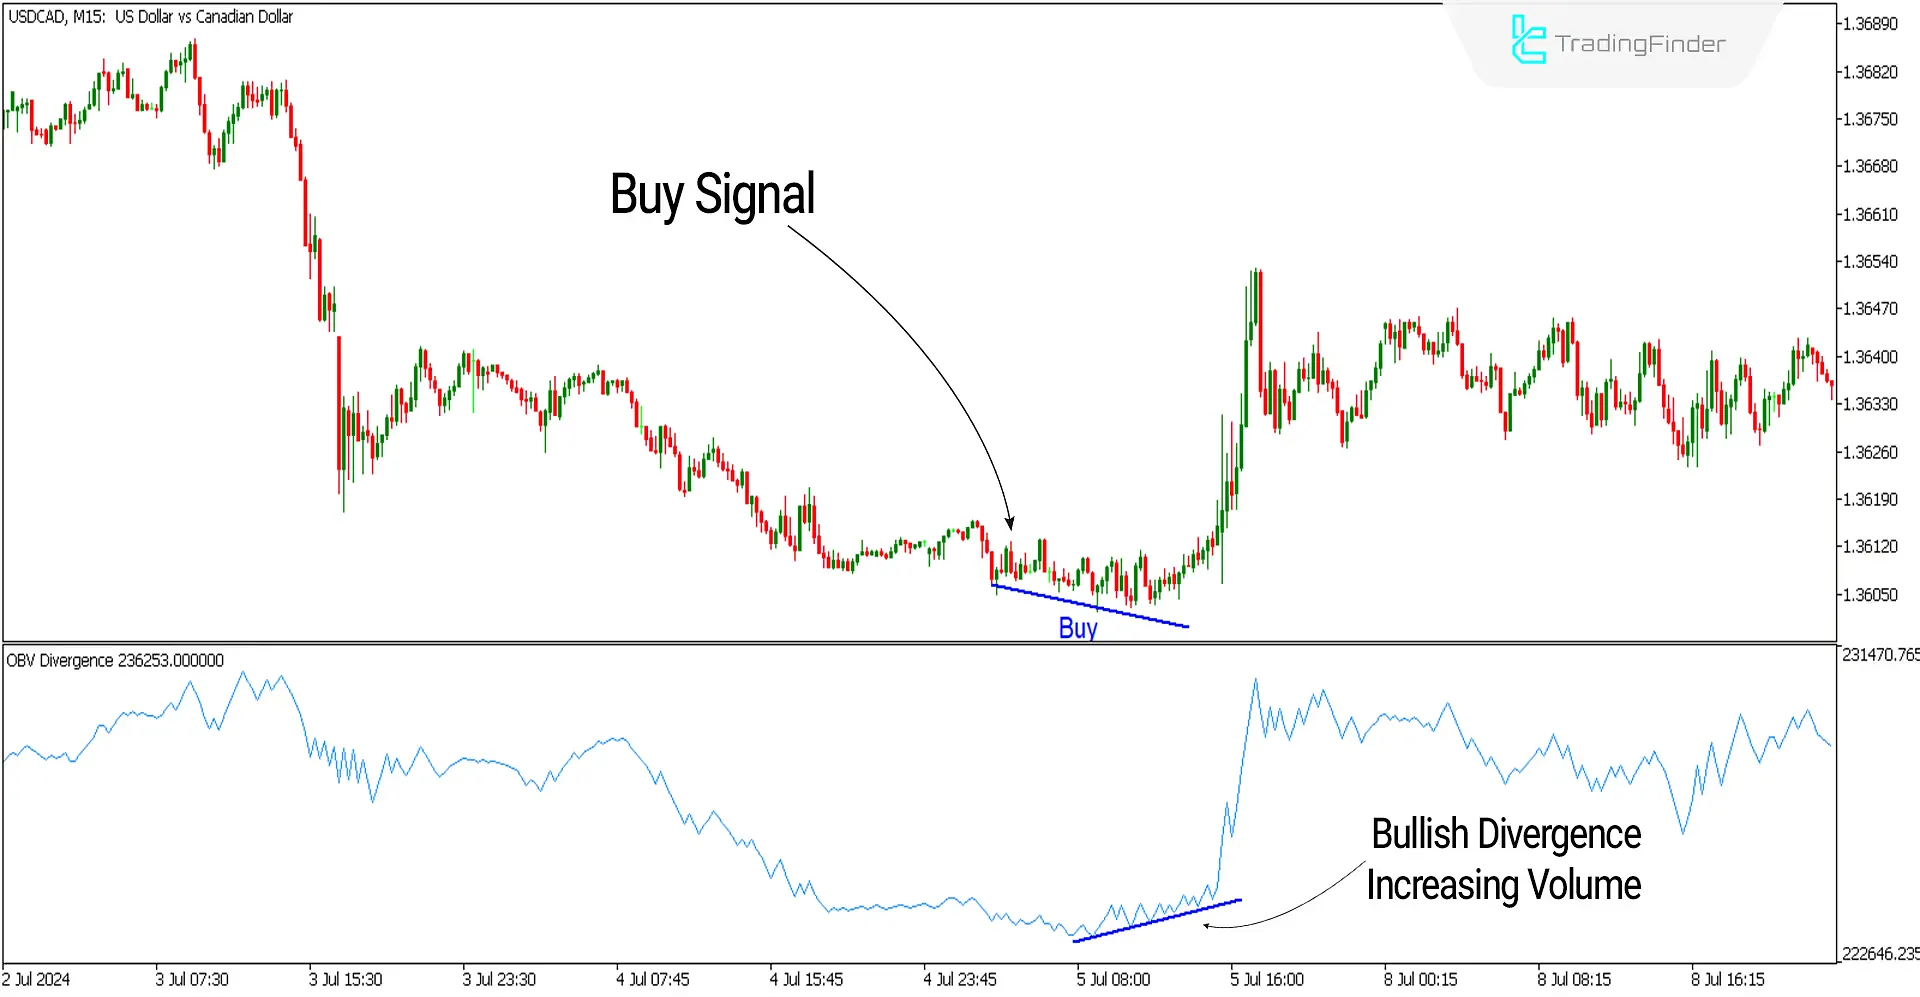
In the image below, the price chart of the US Dollar to Canadian Dollar pair (USDCAD) is shown in a 15-minute timeframe.
The weakening of the downtrend can be identified with a Bullish Divergence in the OBV indicator, as volume is increasing while the price is making lower lows.
This condition indicates the end of selling volumes and a potential trend reversal to the upside, with the indicator displaying a buy signal on the chart.

Sell Signal (Sell Position)
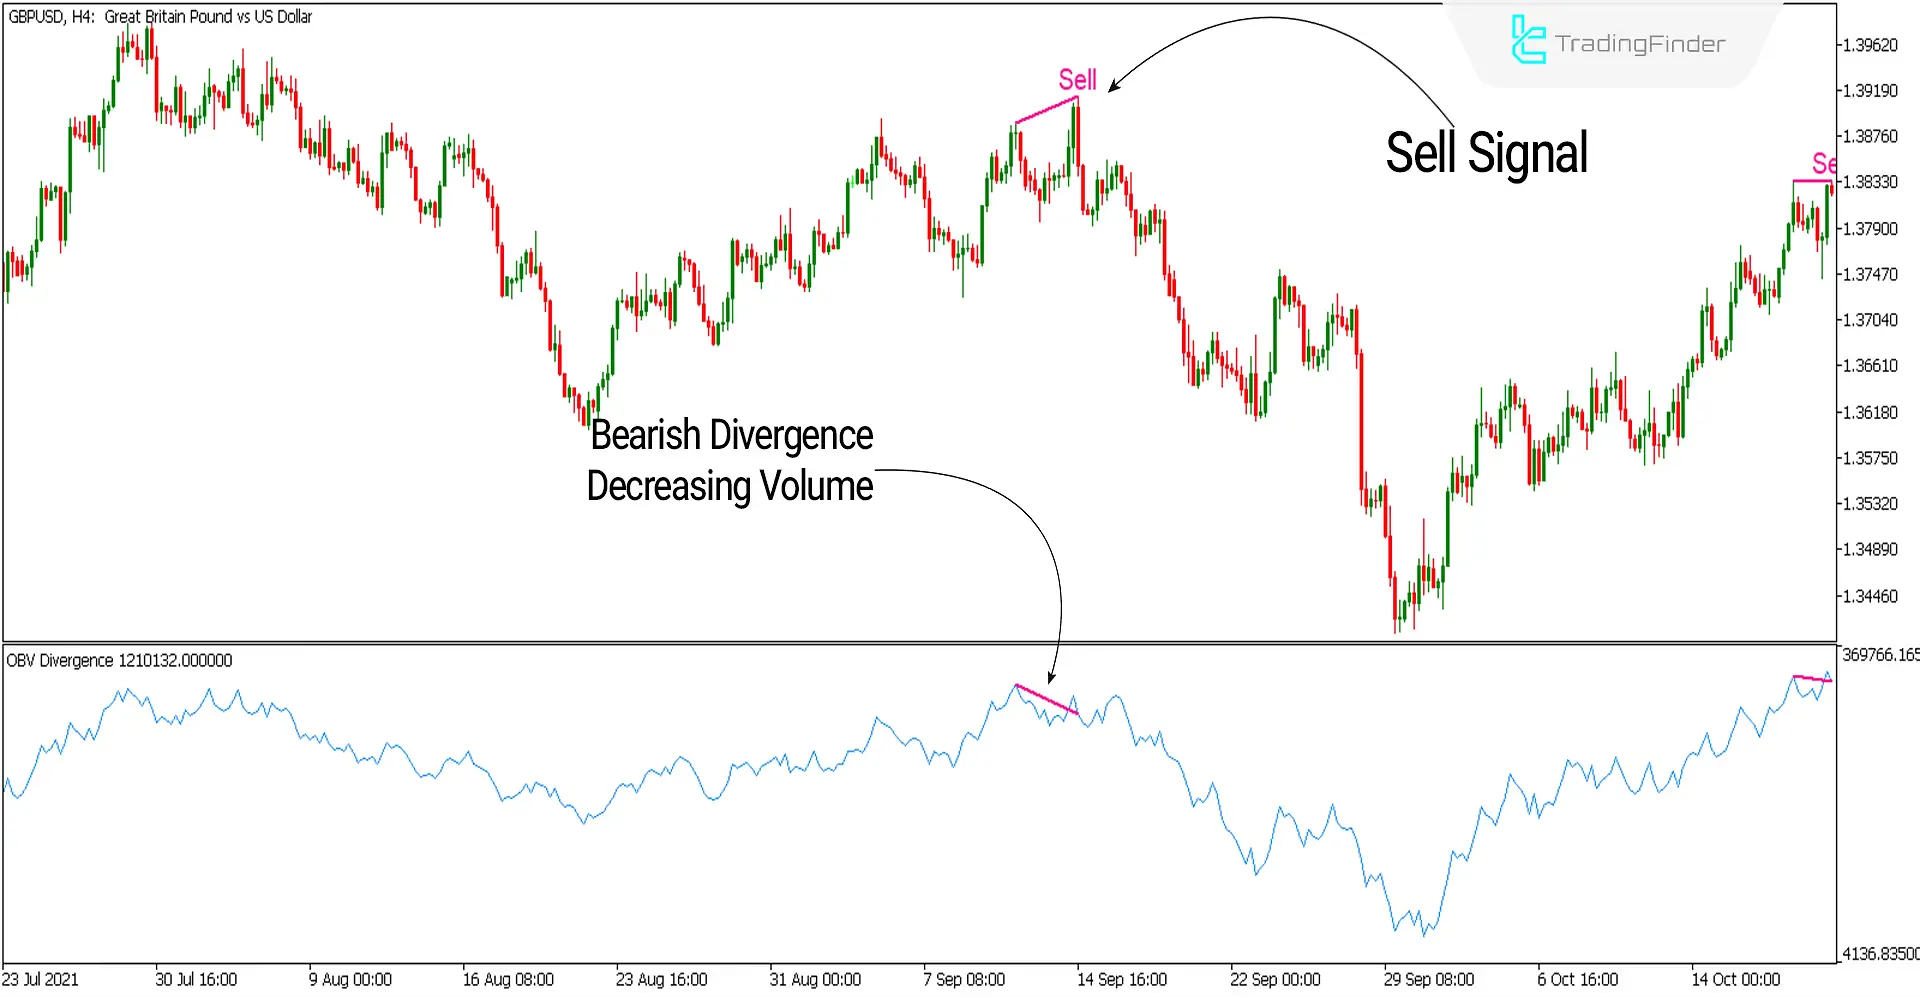
In the image below, the price chart of the British Pound to US Dollar pair (GBPUSD) in a 4-hour timeframe indicates a weakening uptrend, signaling the end of buying volumes and a potential trend reversal due to the presence of a Bearish Divergence in the OBV indicator.
As the volume in the indicator decreases while the price increases, this condition indicates the end of buying volumes and a trend reversal to the downside, with the indicator displaying a sell signal on the chart.

Settings of the OBV Divergence Indicator

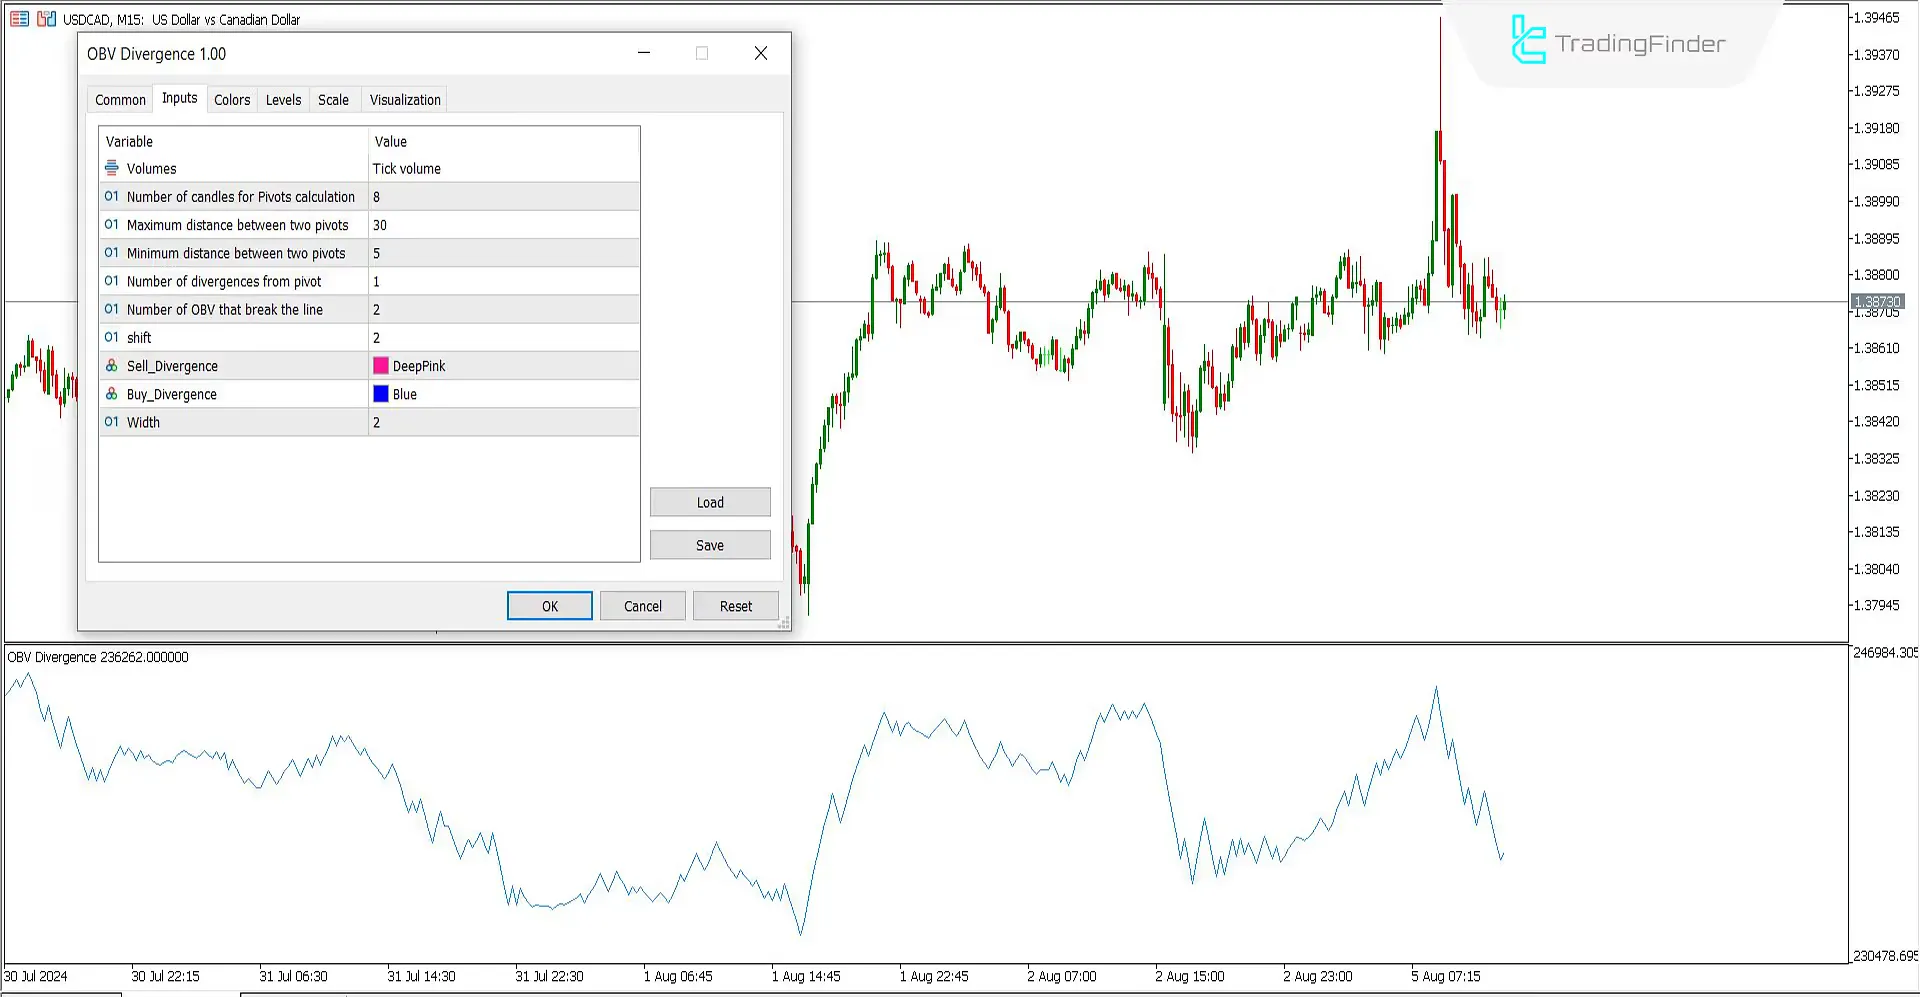
- Volumes: For volume calculations in Forex, select Tick volume;
- Number of candles for Pivots calculation: The number for pivot calculation is set to 8;
- Maximum distance between two pivots: The maximum distance between two pivots is 30;
- Minimum distance between two pivots: The minimum distance between two pivots is 5;
- Number of divergences from pivot: The number of divergences from each pivot is 1;
- Number of OBV that break the line: The number of RSI line breaks is set to 2;
- Shift: The shift is set to 2;
- Sell_Divergence: Set the color for sell signals to pink or any color you choose;
- Buy_Divergence: Set the color for buy signals to blue or any color you choose;
- Width: The width of the divergence line can be set to 2.
Summary
The OBV Divergence Indicator is a handy technical analysis tool for identifying divergence points on the chart. This indicator detects divergences between price and trading volume across various timeframes.
Divergences occur when the price and OBV indicators move in opposite directions, providing strong signals for potential trend changes.
This Volatility indicator performs best in volatile markets like Forex and stocks and is less effective in range-bound (Sideway) markets with lower volatility.
On-Balance Volume OBV Divergence MT5 PDF
On-Balance Volume OBV Divergence MT5 PDF
Click to download On-Balance Volume OBV Divergence MT5 PDFHow are OBV Divergences Identified?
Divergences occur when the price movement direction contradicts the On Balance Volume indicator.
Can the On Balance Volume Divergence Indicator be Used in All Markets?
No, for optimal performance, this indicator should be used in volatile markets like Forex, and it is best avoided in range-bound and low-volatility markets.


