![OBV Divergence Indicator for MT5 Download – Free – [TradingFinder]](https://cdn.tradingfinder.com/image/477466/13-178-fa-obv-divergence-mt5-01.webp)
![OBV Divergence Indicator for MT5 Download – Free – [TradingFinder] 0](https://cdn.tradingfinder.com/image/477466/13-178-fa-obv-divergence-mt5-01.webp)
![OBV Divergence Indicator for MT5 Download – Free – [TradingFinder] 1](https://cdn.tradingfinder.com/image/477465/13-178-fa-obv-divergence-mt5-02.webp)
![OBV Divergence Indicator for MT5 Download – Free – [TradingFinder] 2](https://cdn.tradingfinder.com/image/477467/13-178-fa-obv-divergence-mt5-03.webp)
![OBV Divergence Indicator for MT5 Download – Free – [TradingFinder] 3](https://cdn.tradingfinder.com/image/477469/13-178-fa-obv-divergence-mt5-04.webp)
The OBV Divergence Indicator is an analytical tool available on the MetaTrader 5 platform, designed to identify discrepancies between price movement and volume flow in technical analysis.
This indicator is based on the concept of On-Balance Volume (OBV) and visually highlights bullish and bearish divergences on the chart using colored lines, such as green and red.
OBV Divergence Indicator Specification Table
The specifications of the OBV-based divergence indicator are as follows:
Indicator Categories: | Volume MT5 Indicators Signal & Forecast MT5 Indicators Trading Assist MT5 Indicators |
Platforms: | MetaTrader 5 Indicators |
Trading Skills: | Intermediate |
Indicator Types: | Reversal MT5 Indicators |
Timeframe: | Multi-Timeframe MT5 Indicators |
Trading Style: | Swing Trading MT5 Indicators Scalper MT5 Indicators Day Trading MT5 Indicators |
Trading Instruments: | Forex MT5 Indicators Crypto MT5 Indicators Stock MT5 Indicators Commodity MT5 Indicators Indices MT5 Indicators Share Stock MT5 Indicators |
OBV-Based Divergence Indicator at a Glance
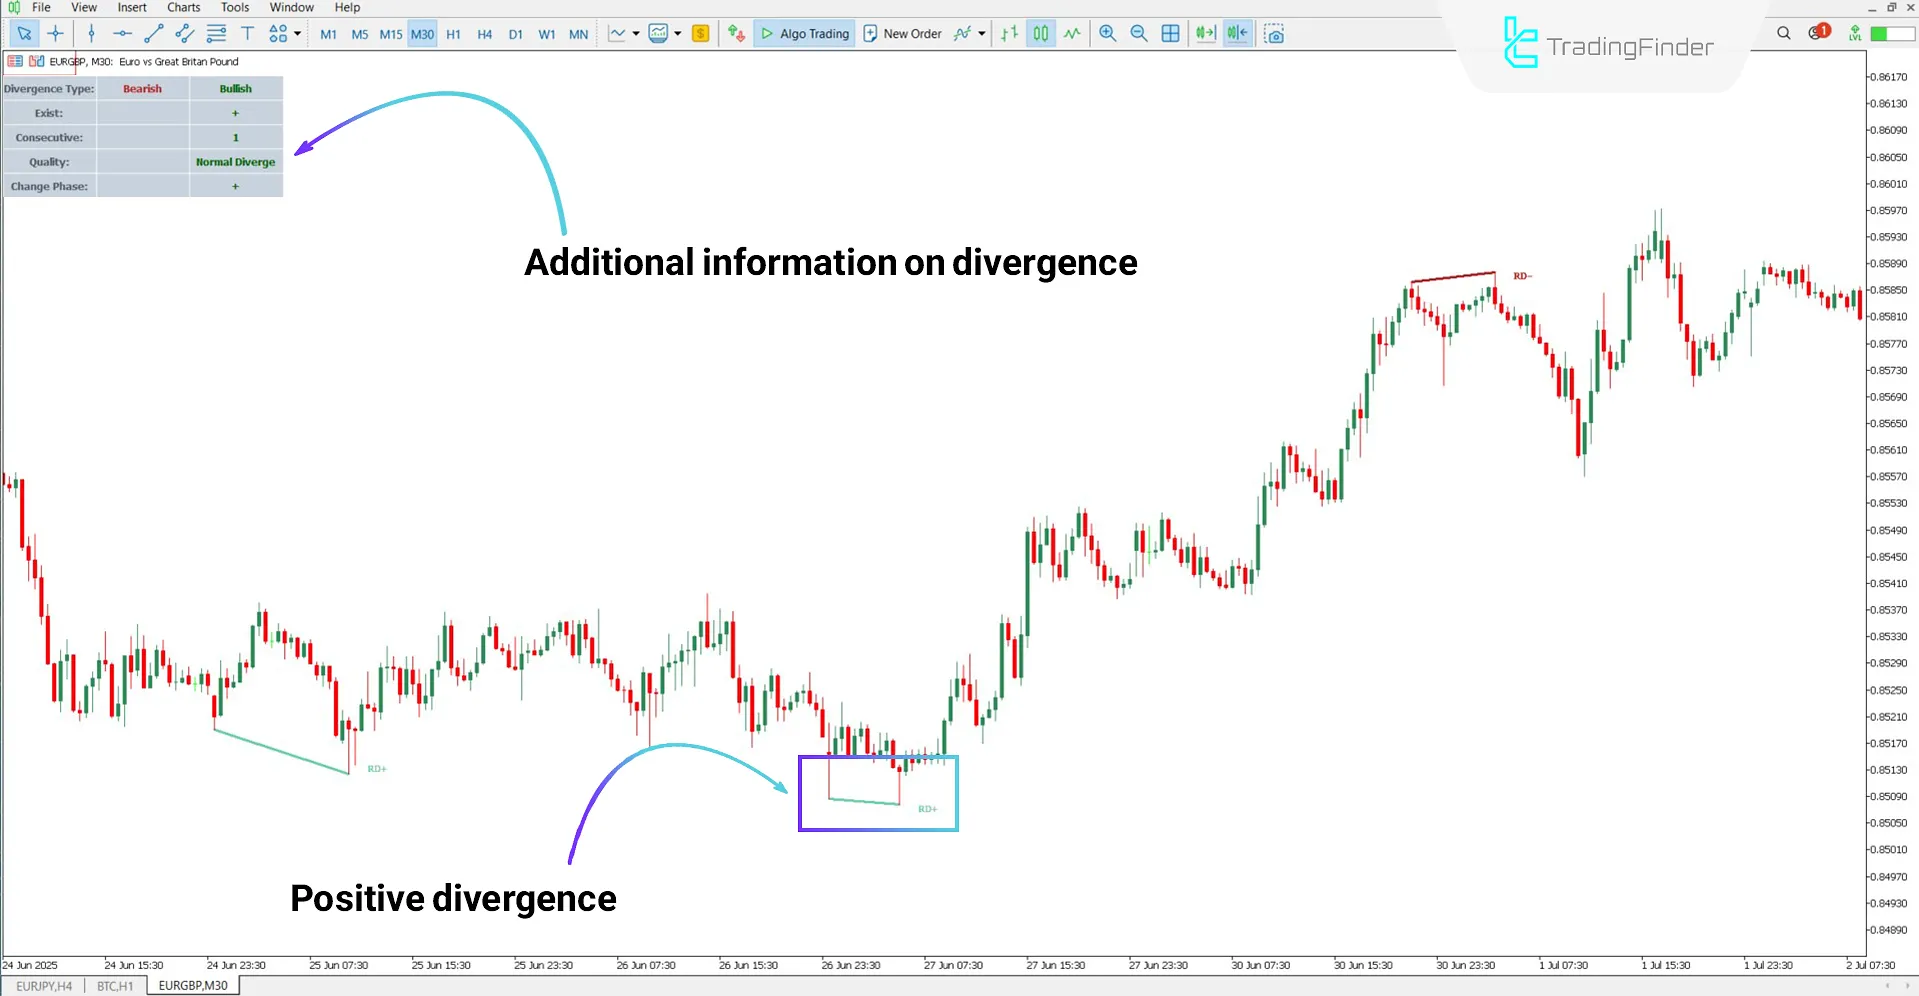
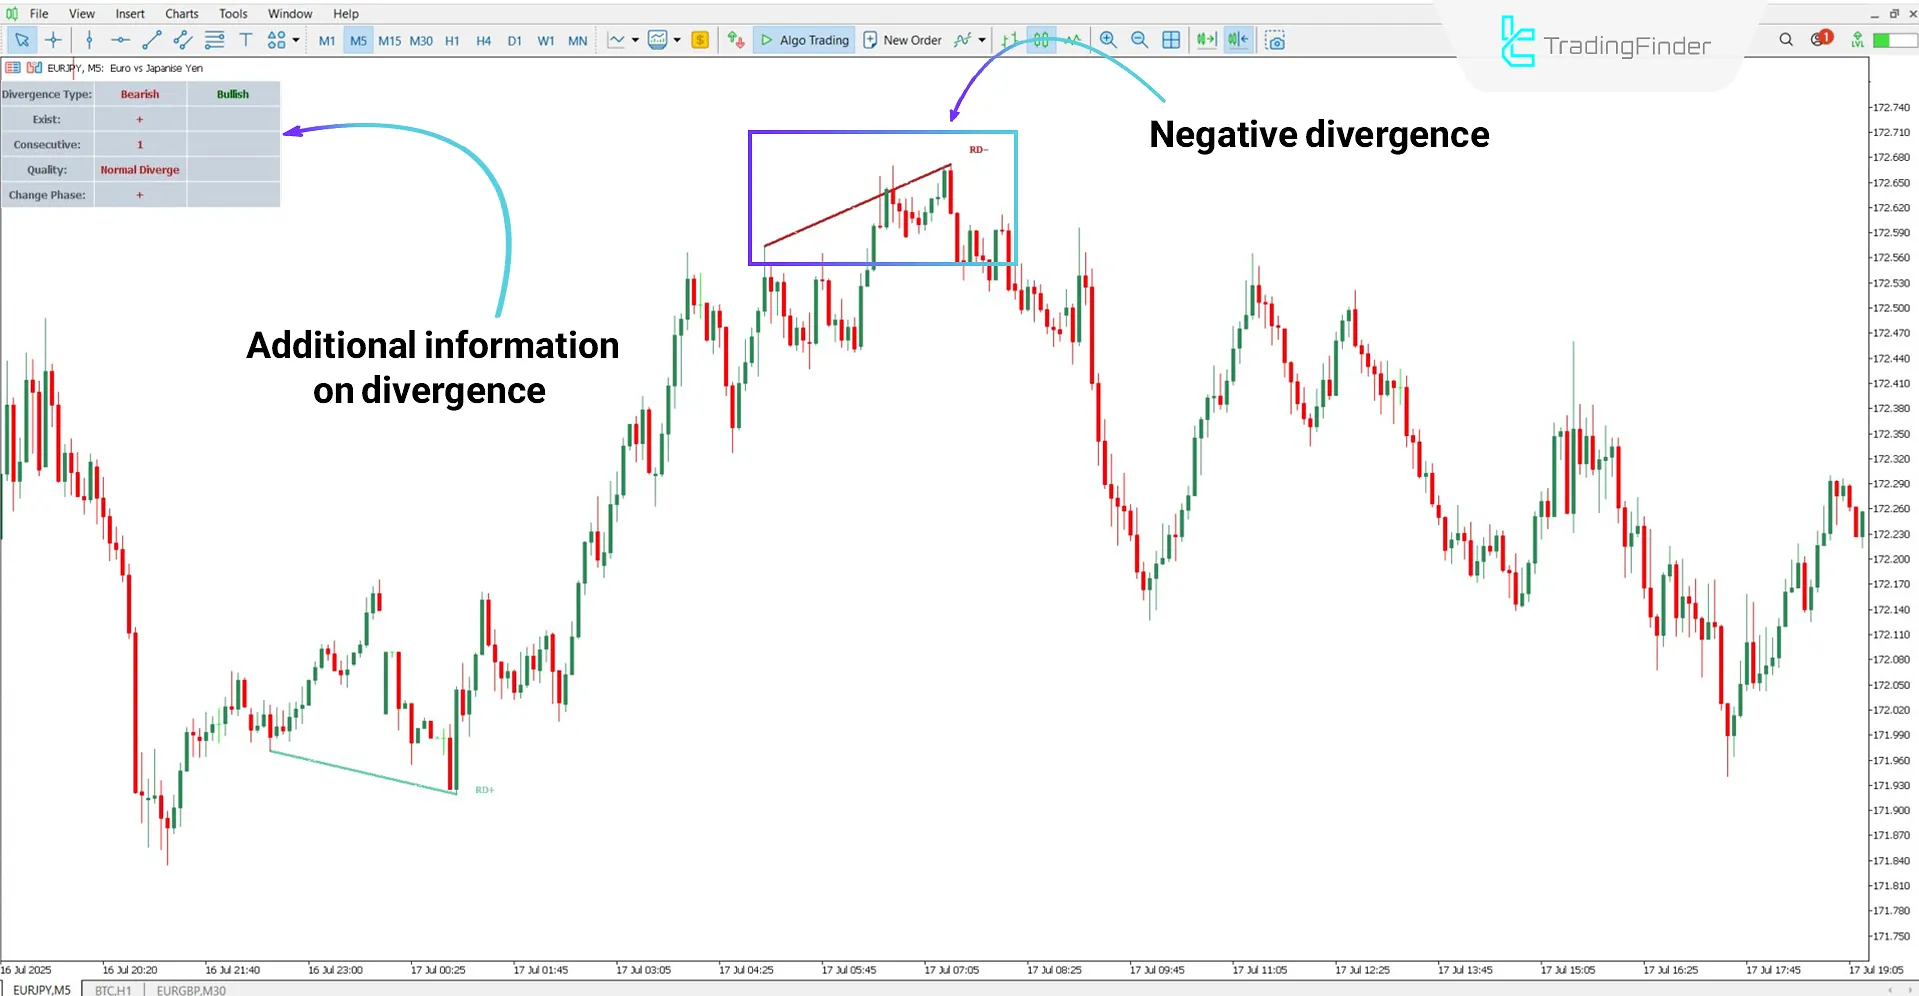
In addition to visually displaying divergences with colored lines, the OBV Divergence Indicator also displays an information table on the chart, providing more detailed insights into the divergence state. These include:
- Divergence Type: Type of divergence displayed
- Exist: Indicates whether a divergence is present, marked with a positive or negative sign
- Consecutive: Number of consecutive divergences formed
- Quality: Strength and quality assessment of the divergence
- Change Phase: Examination of price phase change
Note: This information applies only to the current divergence.
Bullish Trend Conditions (Positive Divergence)
According to the EUR/GBP chart in the 30-minute timeframe, the OBV indicator displays a detected positive divergence, marked by a green line on the chart.
As seen in the image, after the formation of this divergence, the price continues to move upward, initiating a bullish trend. Additionally, the indicator places supplementary divergence information in the table, making it available to traders.

Bearish Trend Conditions (Negative Divergence)
Based on the EUR/JPY chart in the 5-minute timeframe, the OBV Divergence Indicator plots the negative divergence as a red line across the candlesticks.
Following this signal, the price enters a correction phase and begins a downward trend.

OBV Divergence Indicator Settings
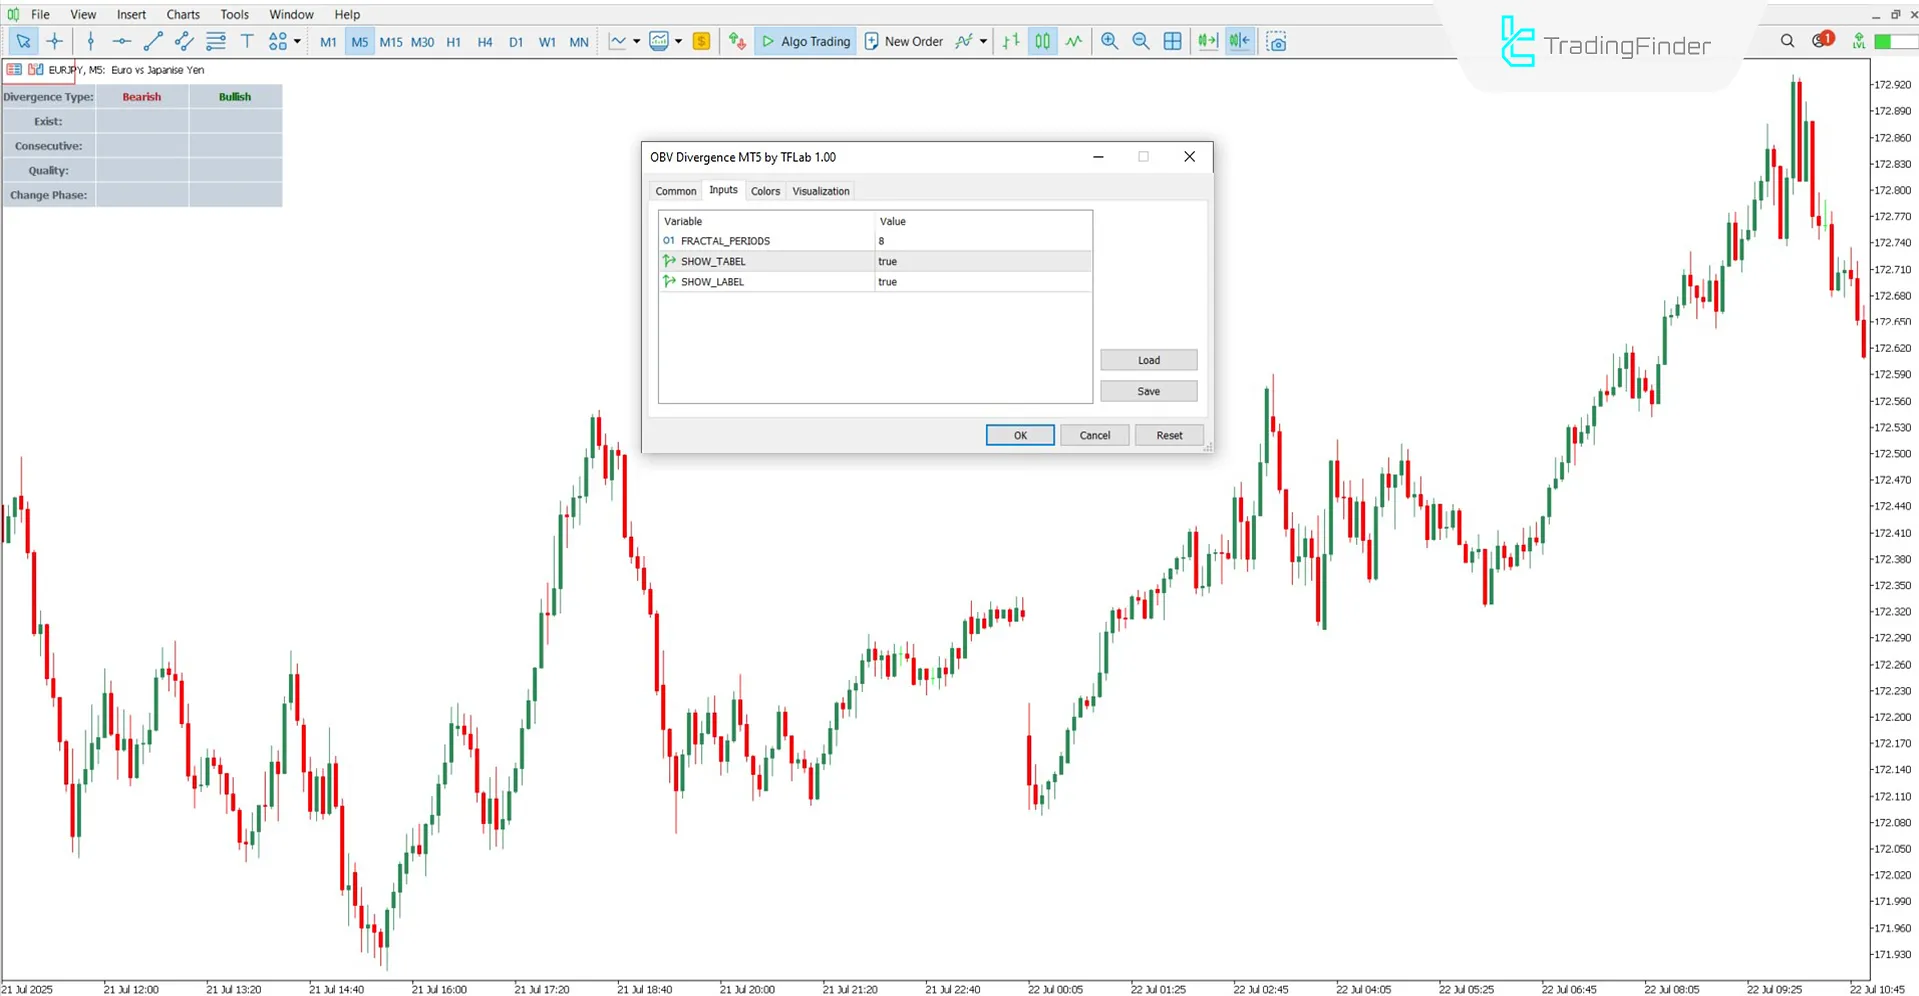
Settings for the OBV Divergence Indicator are as shown in the image below:

- FRACTAL_PERIODS: Number of reference candles for identifying peaks and troughs
- SHOW_TABEL: Toggle display of the information table
- SHOW_LABEL: Toggle display of divergence labels
Conclusion
The OBV Divergence Indicator intelligently detects divergence between price and trading volume by combining visual data and analytical algorithms.
In addition to showing divergence lines, this tool also provides an information table that includes details such as divergence type (bullish or bearish), repetition count, signal quality, and more.
OBV Divergence Indicator MT5 PDF
OBV Divergence Indicator MT5 PDF
Click to download OBV Divergence Indicator MT5 PDFWhat does the green line mean?
The green line indicates the presence of a positive, bullish divergence.
Does the OBV Divergence Indicator display all types of divergence?
No, this indicator only displays divergences based on On-Balance Volume.


