![On Balance Volume Divergence (OBV) Indicator for MT5 Download - Free - [TFlab]](https://cdn.tradingfinder.com/image/185201/4-35-en-obv-divergence-mt5-1.webp)
![On Balance Volume Divergence (OBV) Indicator for MT5 Download - Free - [TFlab] 0](https://cdn.tradingfinder.com/image/185201/4-35-en-obv-divergence-mt5-1.webp)
![On Balance Volume Divergence (OBV) Indicator for MT5 Download - Free - [TFlab] 1](https://cdn.tradingfinder.com/image/185178/4-35-en-obv-divergence-mt5-2.webp)
![On Balance Volume Divergence (OBV) Indicator for MT5 Download - Free - [TFlab] 2](https://cdn.tradingfinder.com/image/185179/4-35-en-obv-divergence-mt5-3.webp)
![On Balance Volume Divergence (OBV) Indicator for MT5 Download - Free - [TFlab] 3](https://cdn.tradingfinder.com/image/185198/4-35-en-obv-divergence-mt5-4.webp)
The On Balance Volume Divergence Indicator, one of the essential tools in MetaTrader 5 indicators, is used for identifying price divergences. Developed by Joseph Granville, this indicator combines trading volume and price movement to analyze buy pressure and sell pressure effectively.
One of OBV's unique features is its ability to detect hidden trends and divergences, making it valuable for traders seeking lucrative trading opportunities.
Indicator Specifications
The table below briefly explains the details of this indicator:
Indicator Categories: | Oscillators MT5 Indicators Signal & Forecast MT5 Indicators Trading Assist MT5 Indicators |
Platforms: | MetaTrader 5 Indicators |
Trading Skills: | Intermediate |
Indicator Types: | Trend MT5 Indicators Leading MT5 Indicators |
Timeframe: | Multi-Timeframe MT5 Indicators |
Trading Style: | Intraday MT5 Indicators |
Trading Instruments: | Forex MT5 Indicators Crypto MT5 Indicators Stock MT5 Indicators Share Stock MT5 Indicators |
Overview of the Indicator
When OBV and price move in the same direction, this alignment signifies the continuation of the current trend and indicates a strong uptrend. Conversely, the divergence between OBV and price can serve as a warning for a potential trend reversal.
These features and buy and sell signals displayed via green and red arrows provide traders with opportunities to enter trades.
Indicator in an Uptrend
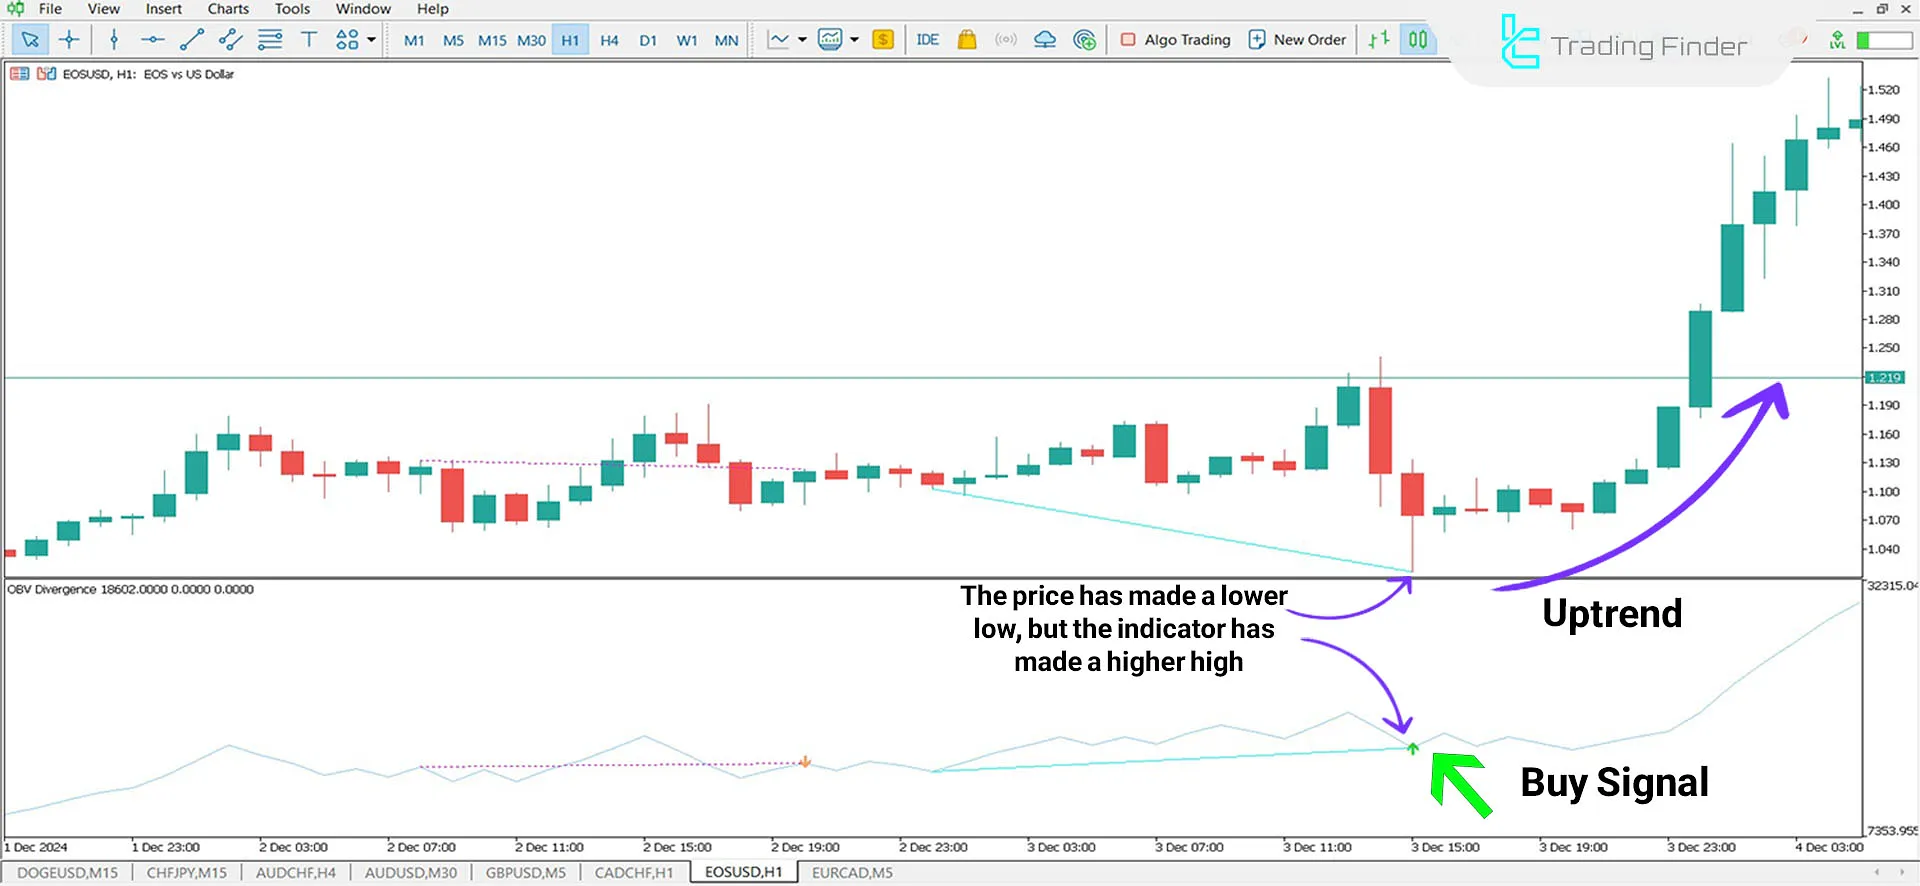
In the one-hour chart of EOS cryptocurrency, the price registers a new low below the level identified by the indicator.
After recognizing the price trend, the indicator issues a Buy Signal, offering traders a suitable trading opportunity.

Indicator in a Downtrend
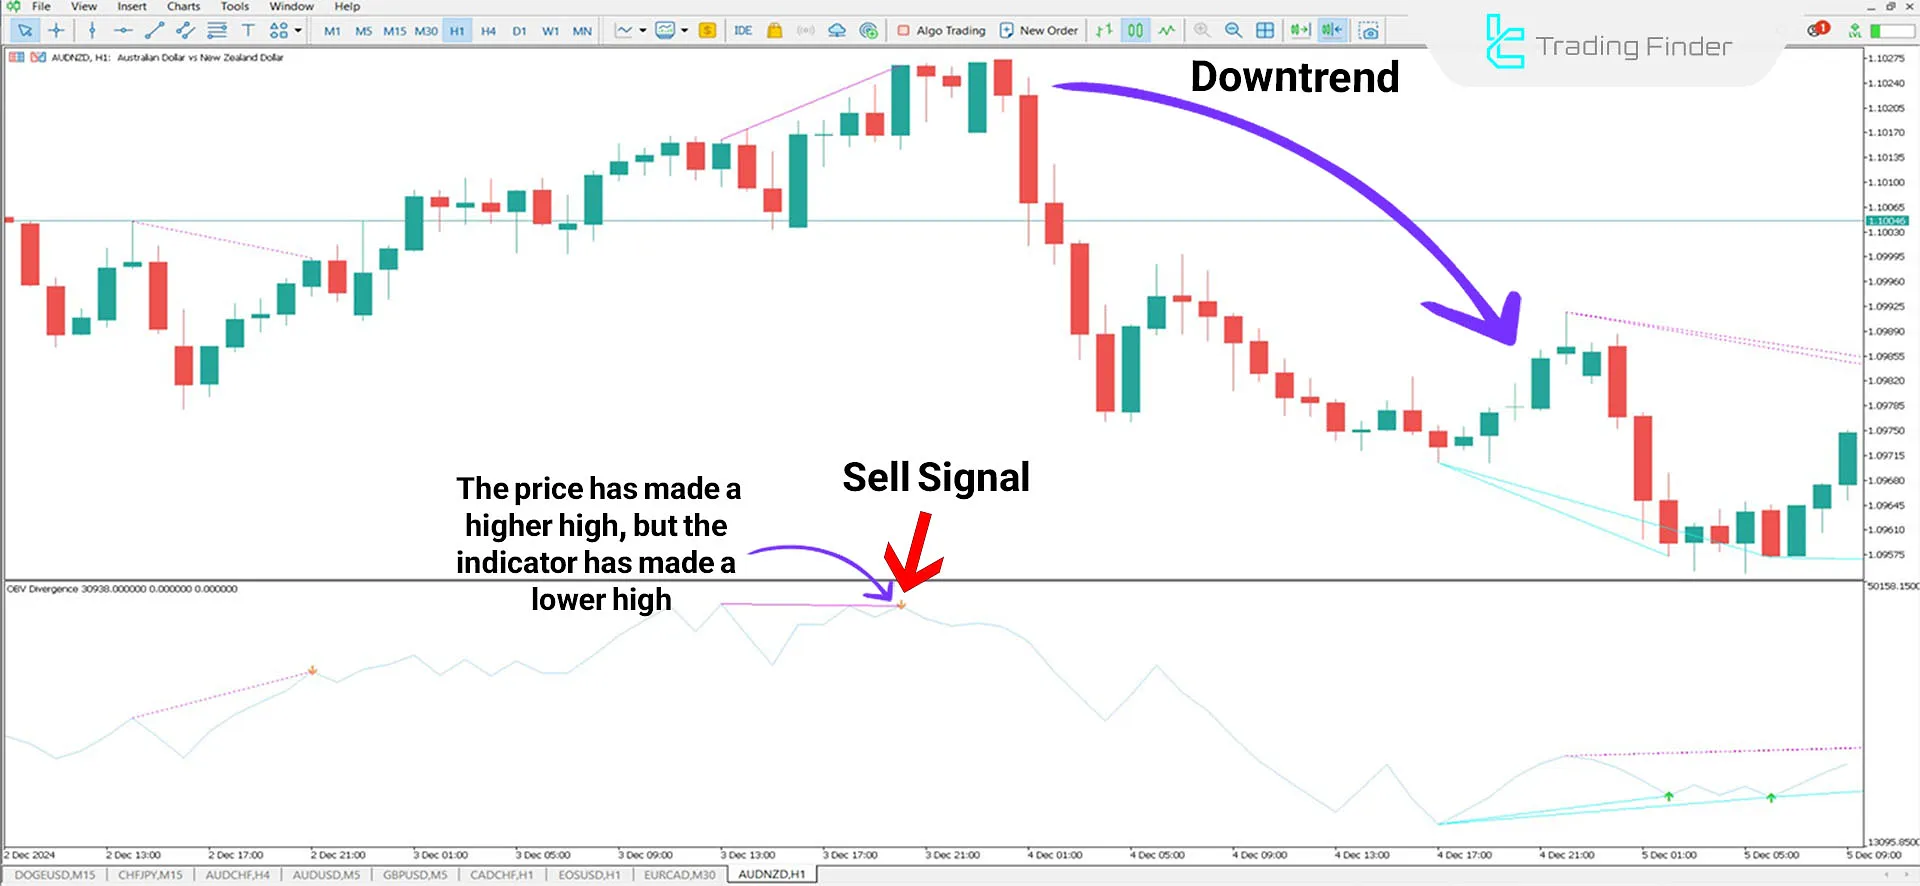
When the price rises but OBV decreases, this scenario indicates a bearish divergence. In the price chart of the AUD/NZD pair, the bearish divergence suggests a weakening of the price's uptrend.
This condition increases the likelihood of a reversal or a shift to a downtrend, and the indicator issues a Sell Signal after identifying these areas.

OBV Indicator Settings
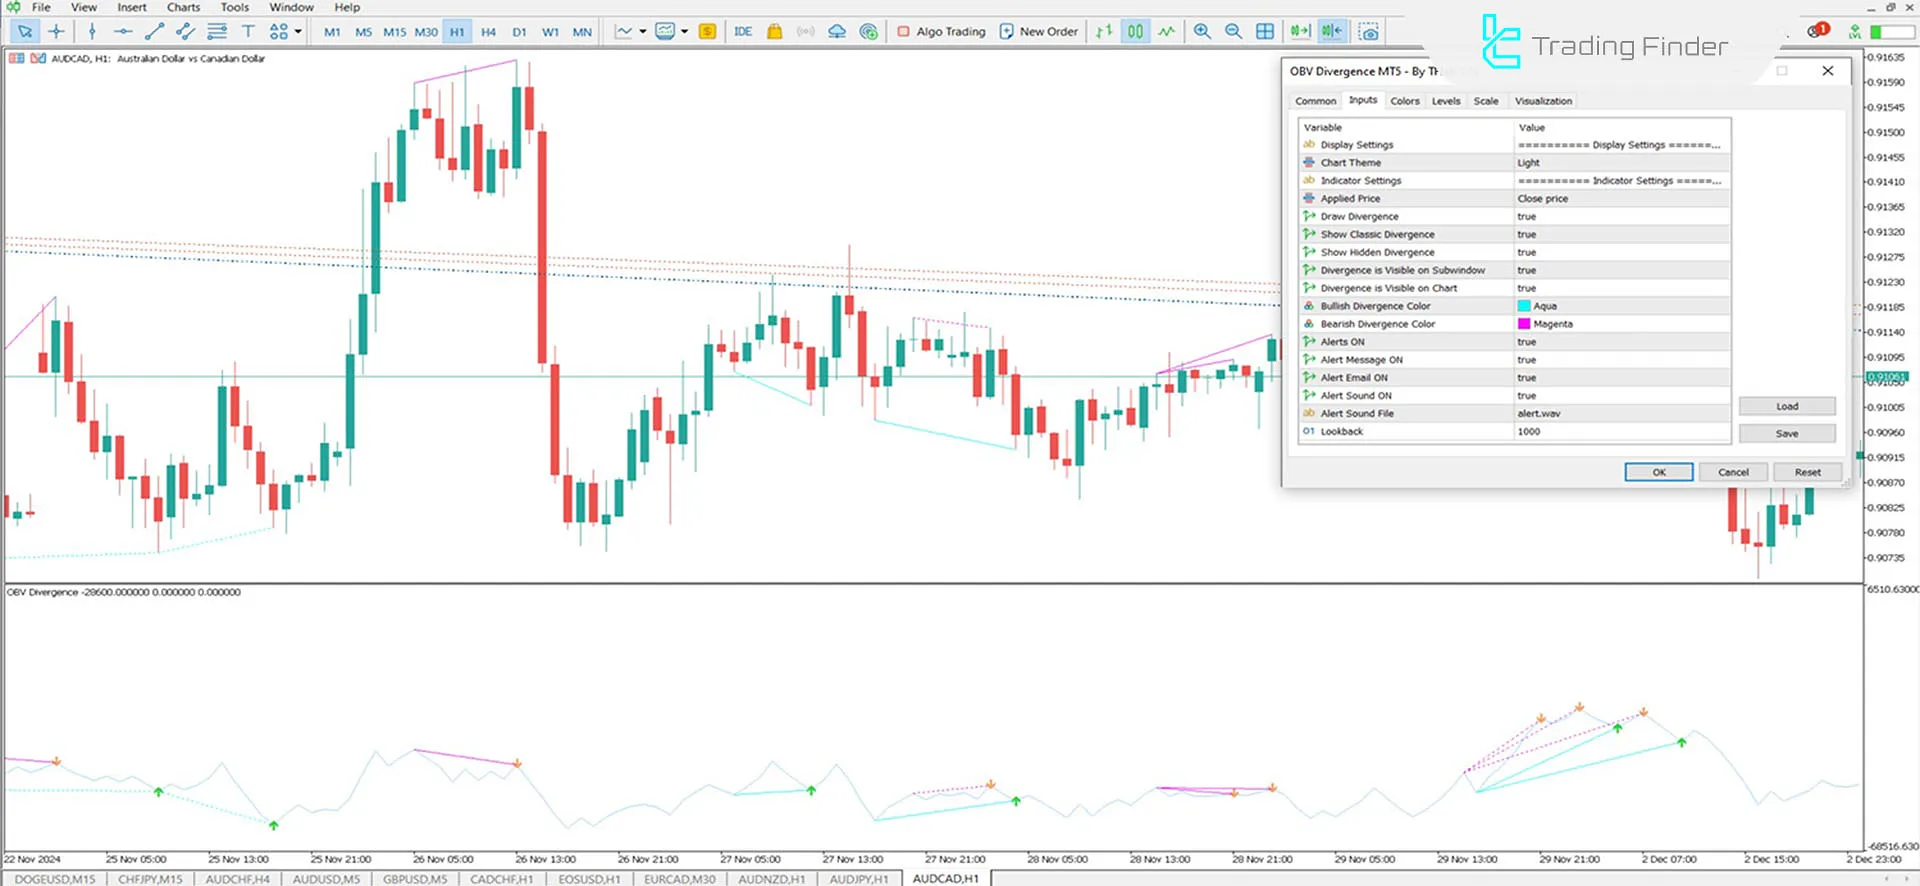
The complete details of this indicator’s settings are visible in the image ahead:

- Chart Theme: Adjust the chart theme;
- Applied Price: Select the reference price (e.g. closing price) for indicator calculations;
- Draw Divergence: Enable the drawing of divergence lines on the chart;
- Show Classic Divergence: Display classic divergences to identify standard trend changes;
- Show Hidden Divergence: Display hidden divergences to uncover hidden trading opportunities;
- Divergence Visible On Subwindow: Display divergences in the indicator's subwindow;
- Divergence Visible On Chart: Display divergences directly on the price chart;
- Bullish Divergence Color: Choose the color of bullish divergence lines (typically light blue);
- Bearish Divergence Color: Choose the color of bearish divergence lines (typically pinkish purple);
- Alerts On: Enable alerts when divergence signals are detected;
- Alert Message: Send alert messages upon signal occurrence;
- Alert Email: Send alerts to the user's registered email address;
- Alert Sound: Enable sound alerts when divergence is identified;
- Sound File: Select a specific sound file.
Conclusion
One of the key advantages of the OBV indicator is its ability to confirm ongoing trends and signal potential trend reversals.
For example, in this Signal & Forecast Indicator, alignment between OBV and price indicates trend strength and continuity, whereas divergence between them serves as a warning for a possible reversal.
On Balance Volume Divergence MT5 PDF
On Balance Volume Divergence MT5 PDF
Click to download On Balance Volume Divergence MT5 PDFIs the On Balance Volume Indicator suitable for identifying divergences?
Yes, OBV is an effective tool for identifying hidden and classic divergences, helping pinpoint potential trend reversal points.
Is the OBV Indicator sufficient on its own?
While the OBV indicator is powerful on its own, it is recommended that it be used alongside other technical analysis tools to confirm signals.


