![Order Flow Trader Oscillator for MT5 Download – Free – [TradingFinder]](https://cdn.tradingfinder.com/image/394979/13-134-en-order-flow-trader-mt5-01.webp)
![Order Flow Trader Oscillator for MT5 Download – Free – [TradingFinder] 0](https://cdn.tradingfinder.com/image/394979/13-134-en-order-flow-trader-mt5-01.webp)
![Order Flow Trader Oscillator for MT5 Download – Free – [TradingFinder] 1](https://cdn.tradingfinder.com/image/394981/13-134-en-order-flow-trader-mt5-02.webp)
![Order Flow Trader Oscillator for MT5 Download – Free – [TradingFinder] 2](https://cdn.tradingfinder.com/image/394980/13-134-en-order-flow-trader-mt5-03.webp)
![Order Flow Trader Oscillator for MT5 Download – Free – [TradingFinder] 3](https://cdn.tradingfinder.com/image/394978/13-134-en-order-flow-trader-mt5-04.webp)
The Order Flow Trader Indicator is designed to analyze buy and sell volume. This trading tool offers insights beyond what is visible in traditional price charts.
The oscillator uses histogramvisuals to present detailed information about the volume of each candle, based on volume fluctuations.
Order Flow Trader Oscillator Specifications Table
The table below outlines the specifications of the Order Flow Trader Indicator.
Indicator Categories: | Oscillators MT5 Indicators Signal & Forecast MT5 Indicators Currency Strength MT5 Indicators Order Flow Indicators in MetaTrader 5 |
Platforms: | MetaTrader 5 Indicators |
Trading Skills: | Intermediate |
Indicator Types: | Reversal MT5 Indicators |
Timeframe: | Multi-Timeframe MT5 Indicators |
Trading Style: | Swing Trading MT5 Indicators Scalper MT5 Indicators Day Trading MT5 Indicators |
Trading Instruments: | Forex MT5 Indicators Crypto MT5 Indicators Stock MT5 Indicators Forward MT5 Indicators |
Order Flow Trader at a Glance
The Order Flow Trader Oscillator is a powerful technical analysis tool that simplifies the detection of entry and exit levels.
Histogram formation is defined as follows:
- Green Histogram: Plotted when the current candle's volume is higher than the previous candle's volume
- Red Histogram:Plotted when the current candle's volume is lower than the previous candle's volume
Bullish Trend Conditions
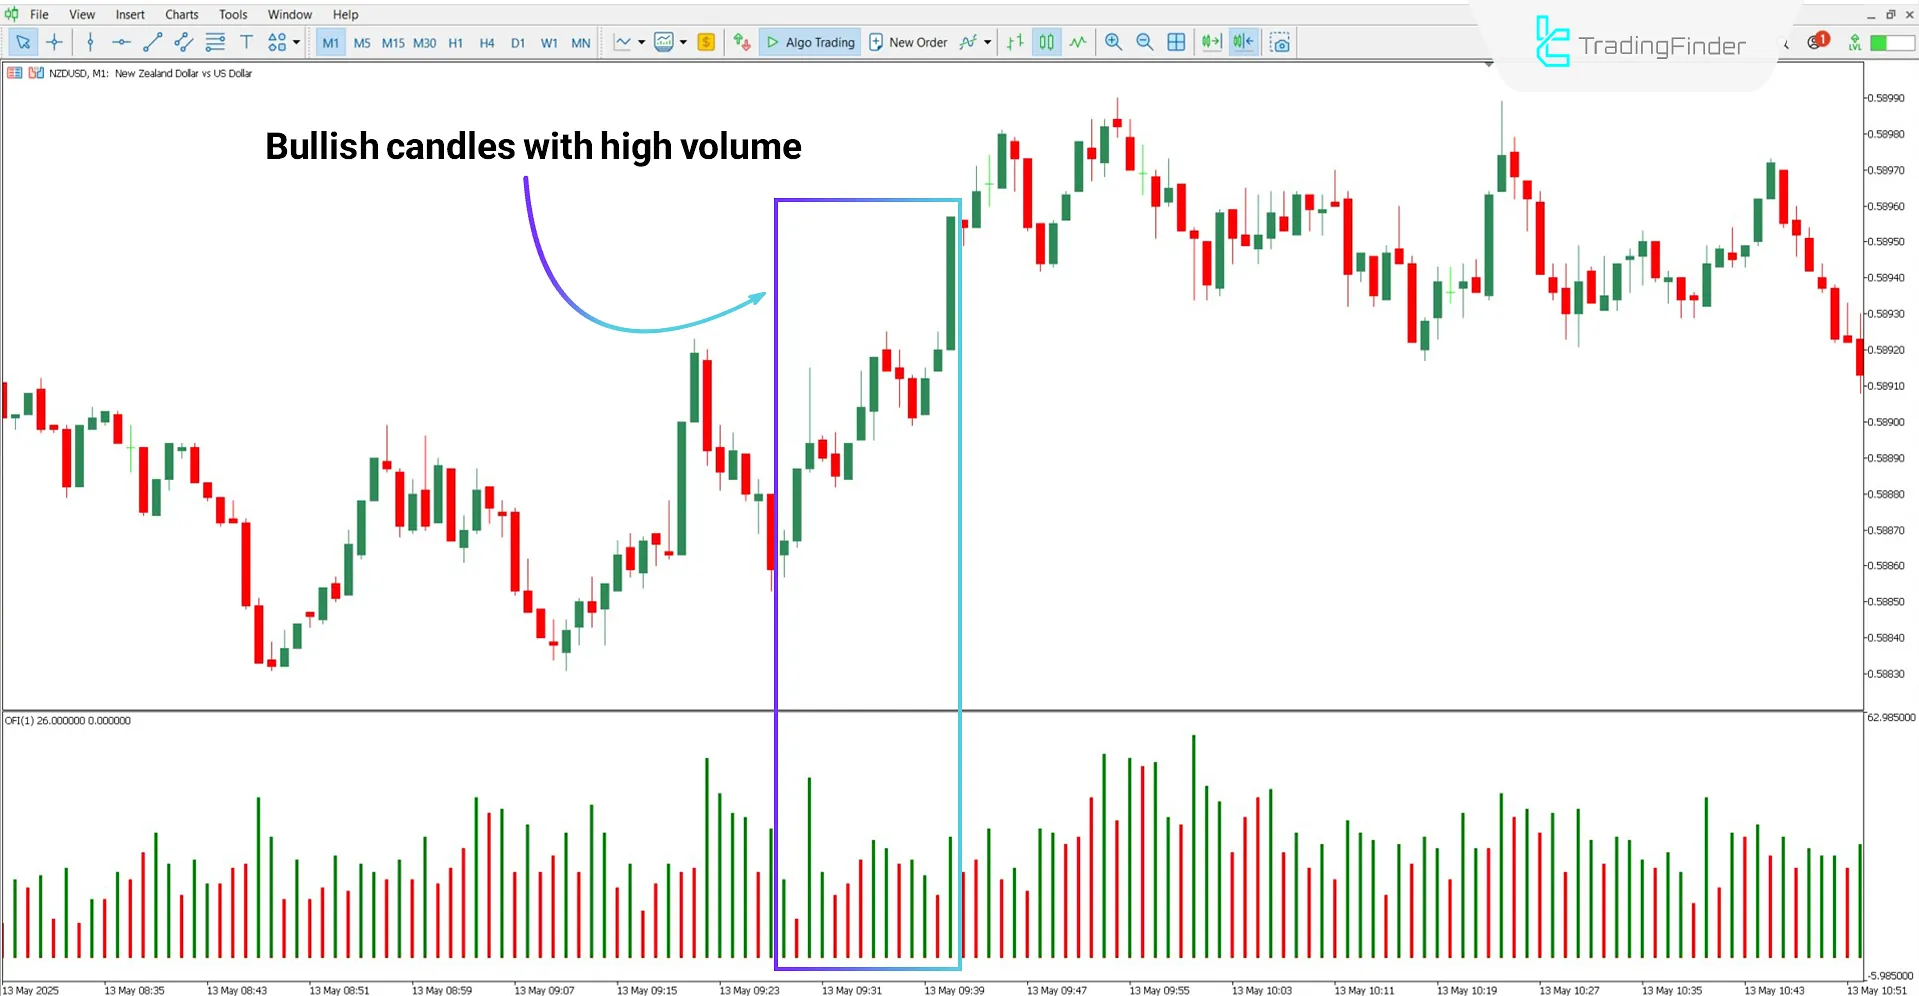
A 1-minute chart example of NZD/USD demonstrates the oscillator's behavior in an uptrend.
According to the chart, green histograms below bullish candles confirm increasing volume and buying pressure dominance.

Bearish Trend Conditions
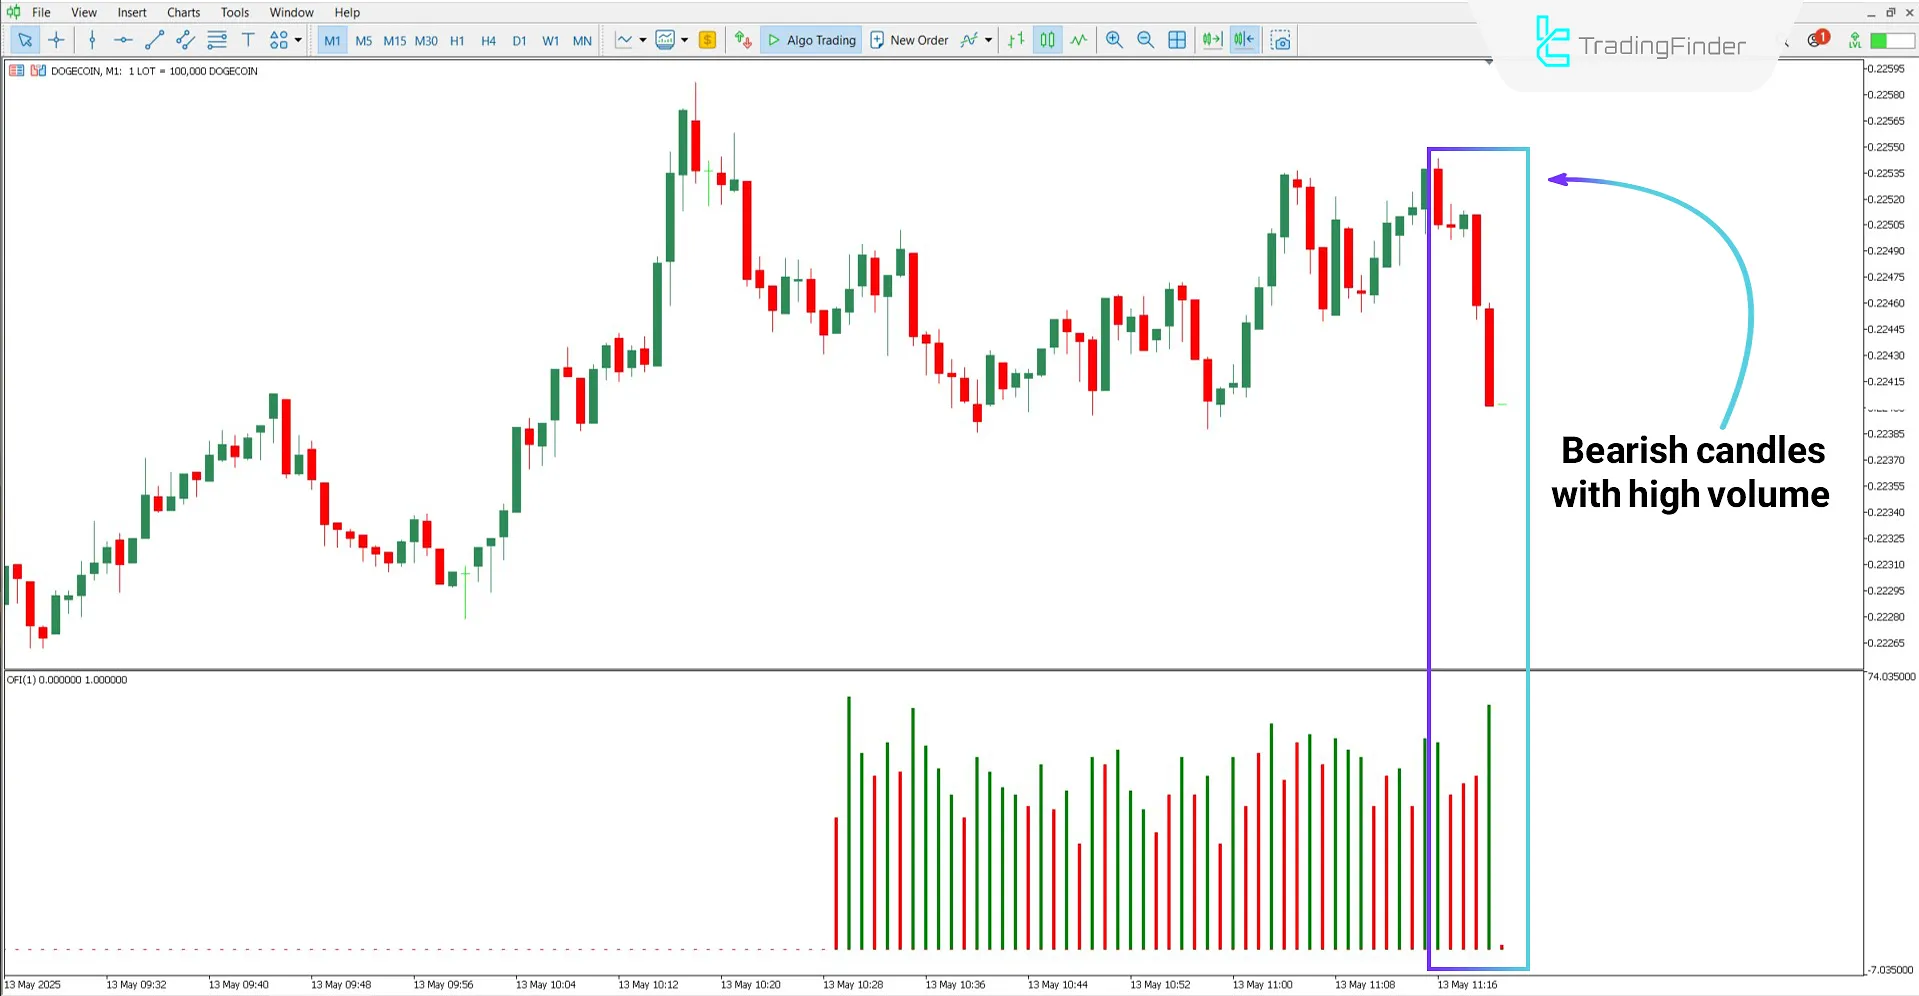
According to the 1-minute chart analysis of the cryptocurrency Dogecoin (DOGE), greenhistograms below bearish candles indicate high trading volume and seller dominance in the market.
In such a situation, a sell position can be maintained as long as no significant decrease in the volume of bearishcandles is observed.

Order Flow Trader Indicator Settings
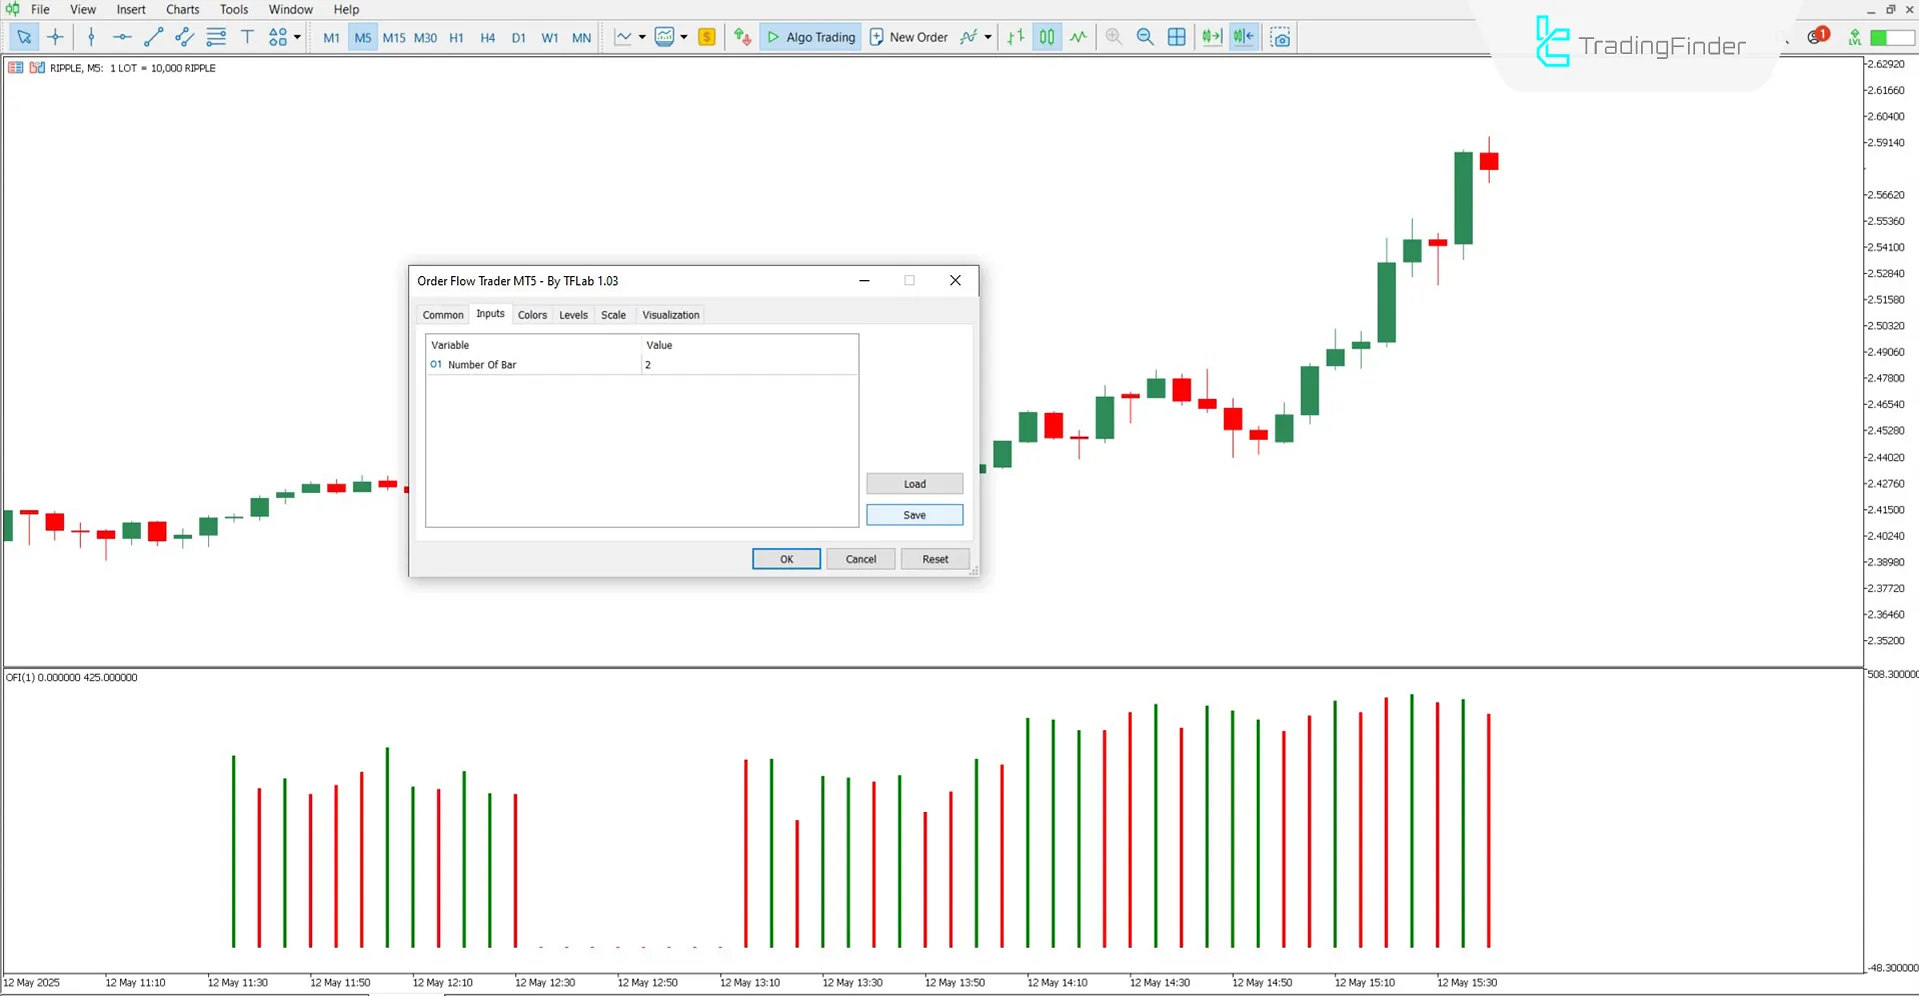
The settings section of the Order Flow Trader Indicator includes the following:

- Number of bars: Number of previous candles used for indicator calculation
Conclusion
The Order Flow Trader Indicator is developed to display trade volume in the MetaTrader 5 environment.
It compares the current candle's volume to the previous one and displays the result using color coded histogram bars.
This indicator can be used across various financial markets, including cryptocurrencies, forex, stock indices, and other trading instruments.
Order Flow Trader Oscillator MT5 PDF
Order Flow Trader Oscillator MT5 PDF
Click to download Order Flow Trader Oscillator MT5 PDFWhat does the color of histogram bars mean?
In the Order Flow Trader Oscillator, a green bar indicates that the current candle's volume is higher than the previous one, while a red bar shows that the current candle's volume is lower than the previous one.
Can the Order Flow Trader Indicator be used in stock markets?
Yes, this indicator is fully functional and applicable in all markets.


