![PAFX Secret Indicator for MetaTrader 5 Download - Free - [TFlab]](https://cdn.tradingfinder.com/image/163435/4-22-en-pafx-secret-mt5-1.webp)
![PAFX Secret Indicator for MetaTrader 5 Download - Free - [TFlab] 0](https://cdn.tradingfinder.com/image/163435/4-22-en-pafx-secret-mt5-1.webp)
![PAFX Secret Indicator for MetaTrader 5 Download - Free - [TFlab] 1](https://cdn.tradingfinder.com/image/163402/4-22-en-pafx-secret-mt5-2.webp)
![PAFX Secret Indicator for MetaTrader 5 Download - Free - [TFlab] 2](https://cdn.tradingfinder.com/image/163403/4-22-en-pafx-secret-mt5-3.webp)
![PAFX Secret Indicator for MetaTrader 5 Download - Free - [TFlab] 3](https://cdn.tradingfinder.com/image/163404/4-22-en-pafx-secret-mt5-4.webp)
The PAFX Secret Indicator is one of the popular technical analysis tools among MetaTrader 5 indicators, helping traders identify potential trend reversal points.
This indicator is a combination of six well-known indicators, including Momentum, CCI, RSI, Stochastic, MACD, and AO, specifically designed to display divergences on the chart. By using this indicator, traders can detect potential trend changes with greater accuracy.
Indicator Table
Indicator Categories: | Price Action MT5 Indicators Oscillators MT5 Indicators Trading Assist MT5 Indicators |
Platforms: | MetaTrader 5 Indicators |
Trading Skills: | Intermediate |
Indicator Types: | Trend MT5 Indicators Reversal MT5 Indicators |
Timeframe: | Multi-Timeframe MT5 Indicators |
Trading Style: | Intraday MT5 Indicators |
Trading Instruments: | Forex MT5 Indicators Crypto MT5 Indicators Stock MT5 Indicators Forward MT5 Indicators Share Stock MT5 Indicators |
Indicator Overview
Divergence is one of the most fascinating and widely used concepts in technical analysis, helping traders predict potential price trend changes. Simply put, divergence occurs when the price and indicator behaviors are not aligned.
This discrepancy can signal a weakness in the current trend and alert traders to a possible price direction change.
Bullish Trend Example
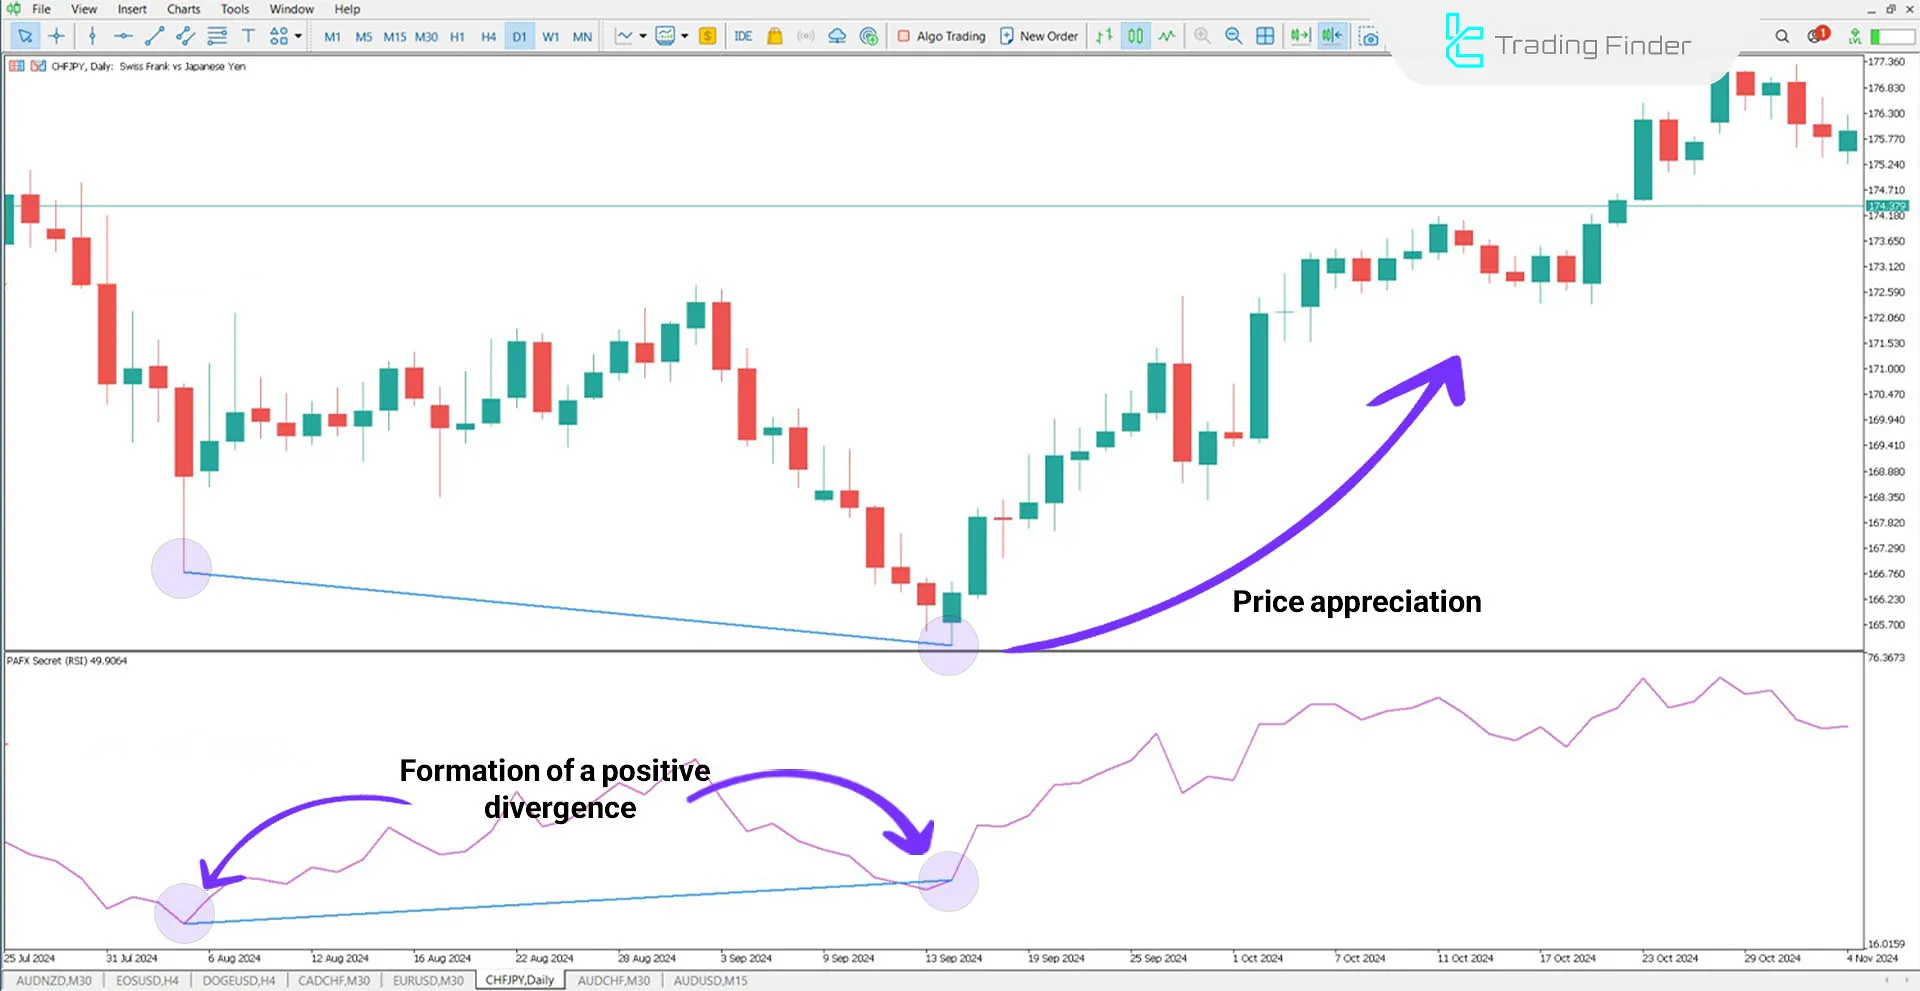
A positive divergence is observed on the daily chart of the CHF/JPY currency pair. While the price of this pair appears to continue its downtrend, the indicator shows the opposite, recording a higher high.
This signal highlights a weakness in the downtrend, indicating a potential start of an upward movement.

Bearish Trend Example
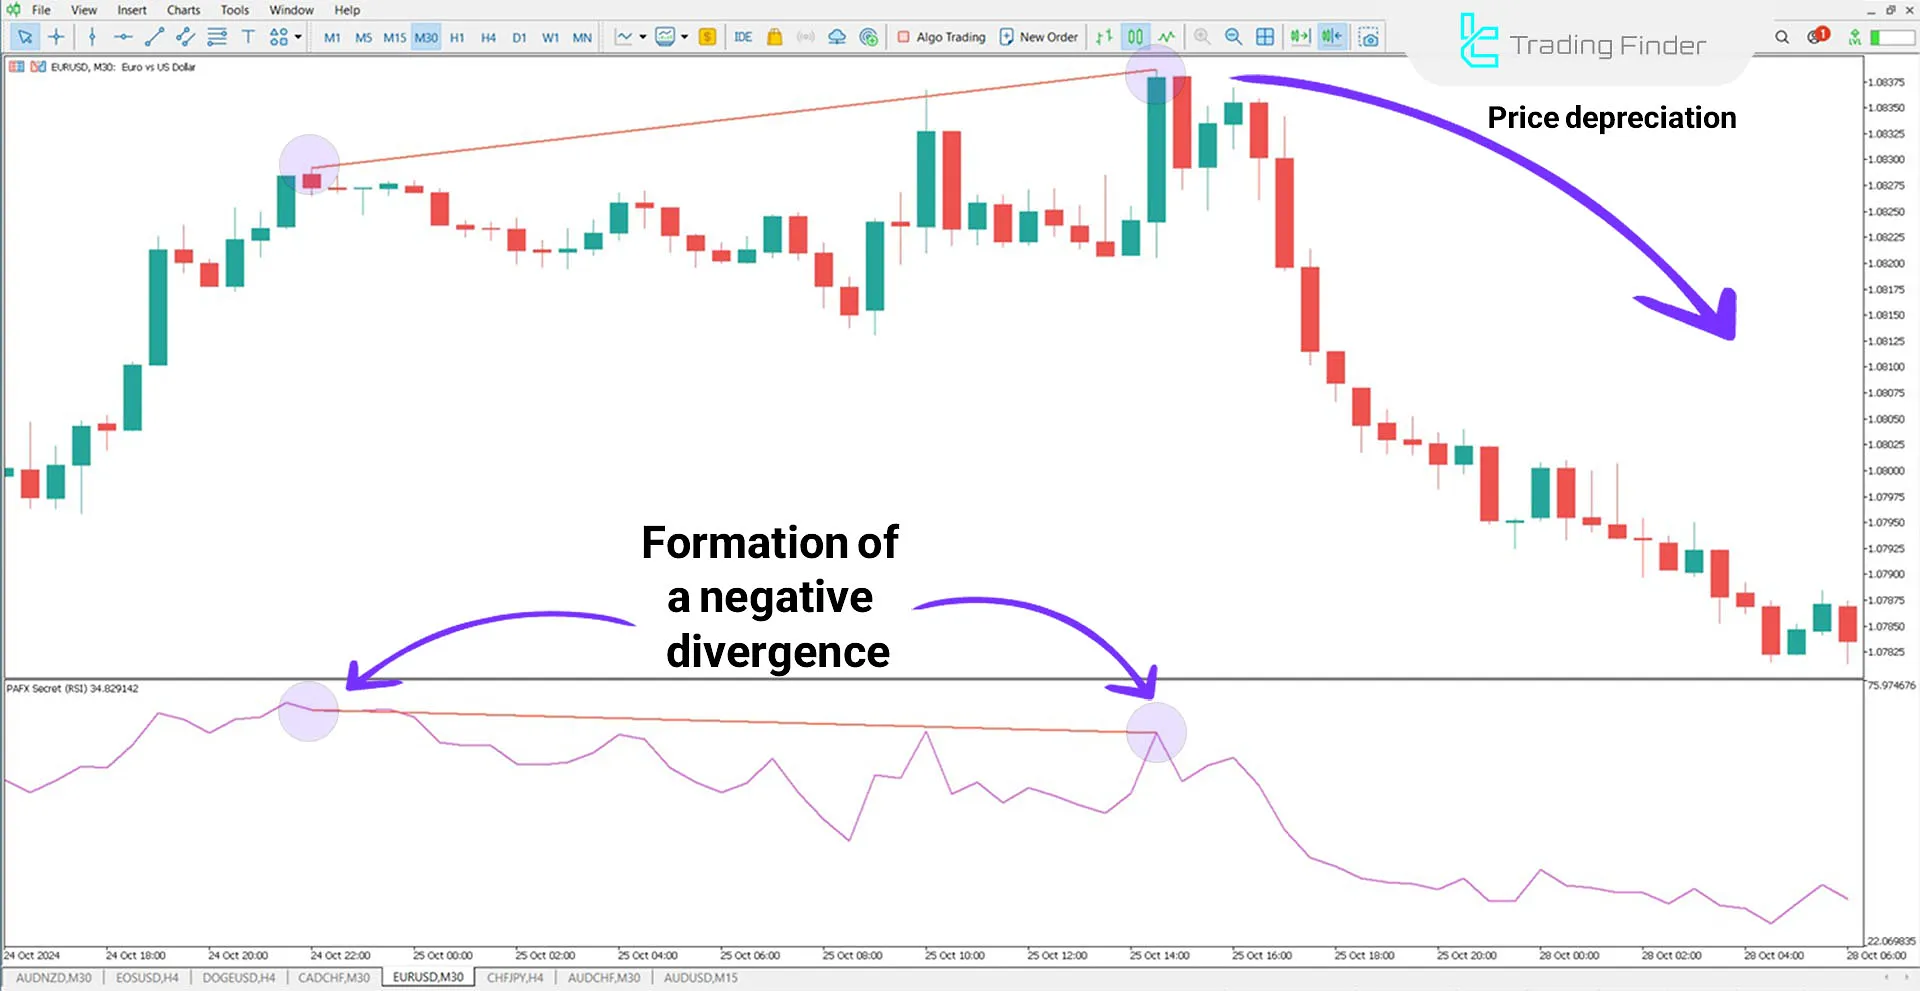
A negative divergence is observed on the 30-minute chart of the EUR/USD currency pair. The price records new highs, but the indicator moves in the opposite direction, showing lower highs.
This discrepancy between price and indicator movement may weaken the bullish trend’s strength.

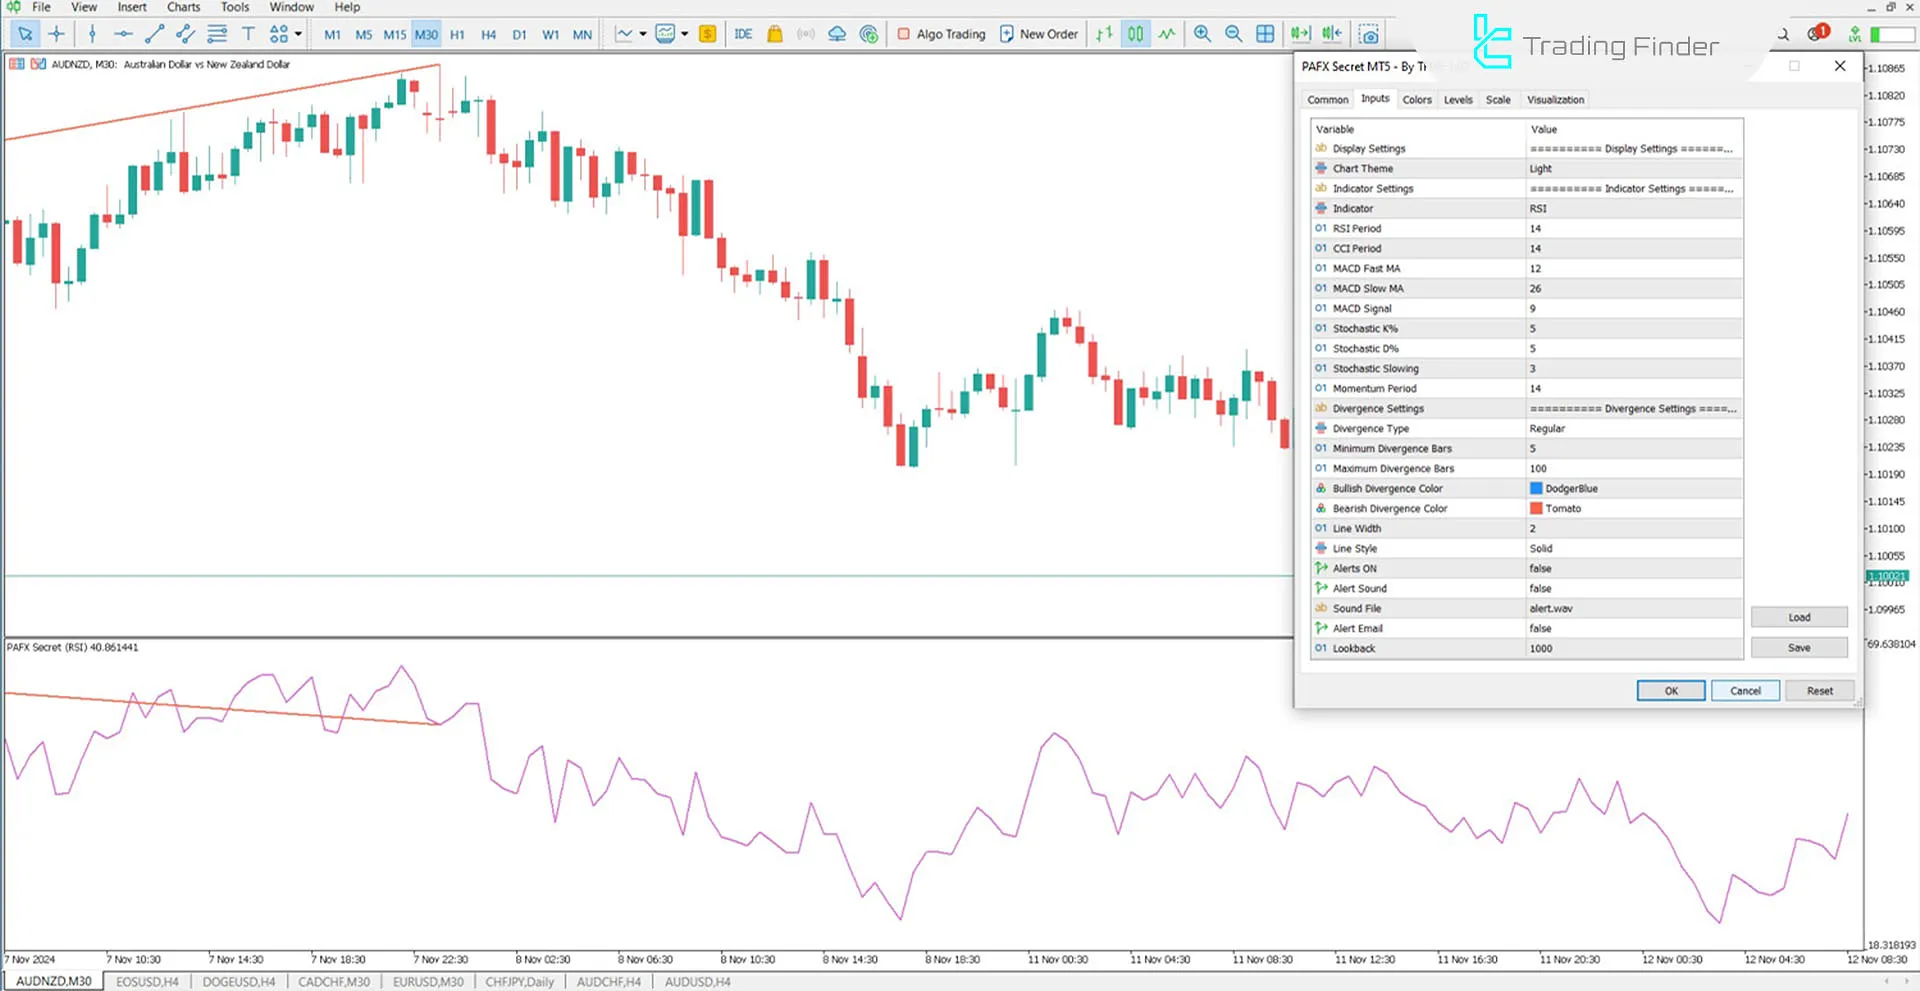
Indicator Settings

- Chart Theme: Background color of the chart;
- Indicator: Type of indicator, including MOMENTUM, CCI, RSI, and MACD (default: RSI);
- RSI Period: Calculation period for RSI (default: 14);
- CCI Period: Calculation period for CCI (default: 14);
- MACD Fast Ma: Fast MA calculation for MACD (default: 12);
- MACD Slow Ma: Slow MA calculation for MACD (default: 26);
- MACD Signal: Number of MACD signals (default: 9);
- Stoch K: Stochastic K parameter (default: 5);
- Stoch D: Stochastic D parameter (default: 5);
- Stoch Slowing: Stochastic slowing parameter (default: 3);
- Momentum Period: Calculation period for Momentum (default: 14);
- Div Type: Divergence display type (default: Regular);
- Div Min: Minimum number of candles for divergence calculation (default: 5);
- Div Max: Maximum number of candles for divergence calculation (default: 100);
- Line Width: Width of divergence lines (default: 2);
- Line Style: Divergence line style (default: Solid);
- Alert: Alerts when a divergence is detected;
- Alert Sound: Type of sound for alerts;
- Alert Mail: Email notification when divergence occurs;
- Lookback: Number of candles calculated in the indicator window.
Conclusion
In this MetaTrader 5 oscillator, divergences help traders make better and more precise decisions by highlighting potential trend reversal points. These signals allow traders to enter buy (Buy) or sell (Sell) positions at the right time and profit from price movements.
For this reason, divergences are considered one of the most useful elements in technical analysis and are widely used in financial markets.
PAFX Secret MT5 PDF
PAFX Secret MT5 PDF
Click to download PAFX Secret MT5 PDFCan this indicator be used in all financial markets?
This indicator is designed for use in forex, cryptocurrency, and stock markets.
How can the indicator settings be changed?
This indicator includes various settings, such as RSI, CCI, MACD, and Stochastic periods. You can customize the default settings based on your needs and adjust the parameters to achieve better results.
You guys are awesome! Thank you, thank you, thank you!


