![Parabolic SAR Oscillator Indicator for MT5 Download – Free – [TradingFinder]](https://cdn.tradingfinder.com/image/480832/13-181-en-prabolic-sar-oscillator-indicator-mt5-01.webp)
![Parabolic SAR Oscillator Indicator for MT5 Download – Free – [TradingFinder] 0](https://cdn.tradingfinder.com/image/480832/13-181-en-prabolic-sar-oscillator-indicator-mt5-01.webp)
![Parabolic SAR Oscillator Indicator for MT5 Download – Free – [TradingFinder] 1](https://cdn.tradingfinder.com/image/480831/13-181-en-prabolic-sar-oscillator-indicator-mt5-02.webp)
![Parabolic SAR Oscillator Indicator for MT5 Download – Free – [TradingFinder] 2](https://cdn.tradingfinder.com/image/480833/13-181-en-prabolic-sar-oscillator-indicator-mt5-03.webp)
![Parabolic SAR Oscillator Indicator for MT5 Download – Free – [TradingFinder] 3](https://cdn.tradingfinder.com/image/480830/13-181-en-prabolic-sar-oscillator-indicator-mt5-04.webp)
The Parabolic SAR Oscillator Indicator is a precise tool for identifying overbought and oversold levels, evaluating momentum strength or weakness, and timely detecting trend direction changes.
This tool is based on the classic "Parabolic SAR" version, with the difference that instead of showing dots on the price chart, it displays its signals as a standalone oscillator below the chart.
Parabolic SAR Oscillator Specifications Table
The following table provides Parabolic SAR Oscillator Specifications..
Indicator Categories: | Oscillators MT5 Indicators Momentum Indicators in MT5 |
Platforms: | MetaTrader 5 Indicators |
Trading Skills: | Intermediate |
Indicator Types: | Overbought & Oversold MT5 Indicators Reversal MT5 Indicators |
Timeframe: | Multi-Timeframe MT5 Indicators |
Trading Style: | Swing Trading MT5 Indicators Scalper MT5 Indicators Day Trading MT5 Indicators |
Trading Instruments: | Forex MT5 Indicators Crypto MT5 Indicators Stock MT5 Indicators |
Parabolic SAR Oscillator at a Glance
The Parabolic SAR Oscillator consists of two lines, green and red, which smoothly display momentum changes in the market.
When the oscillator enters overbought or oversold zones, the indicator highlights these areas with red dots to provide warnings for potential trend reversals.
Bullish Trend Conditions
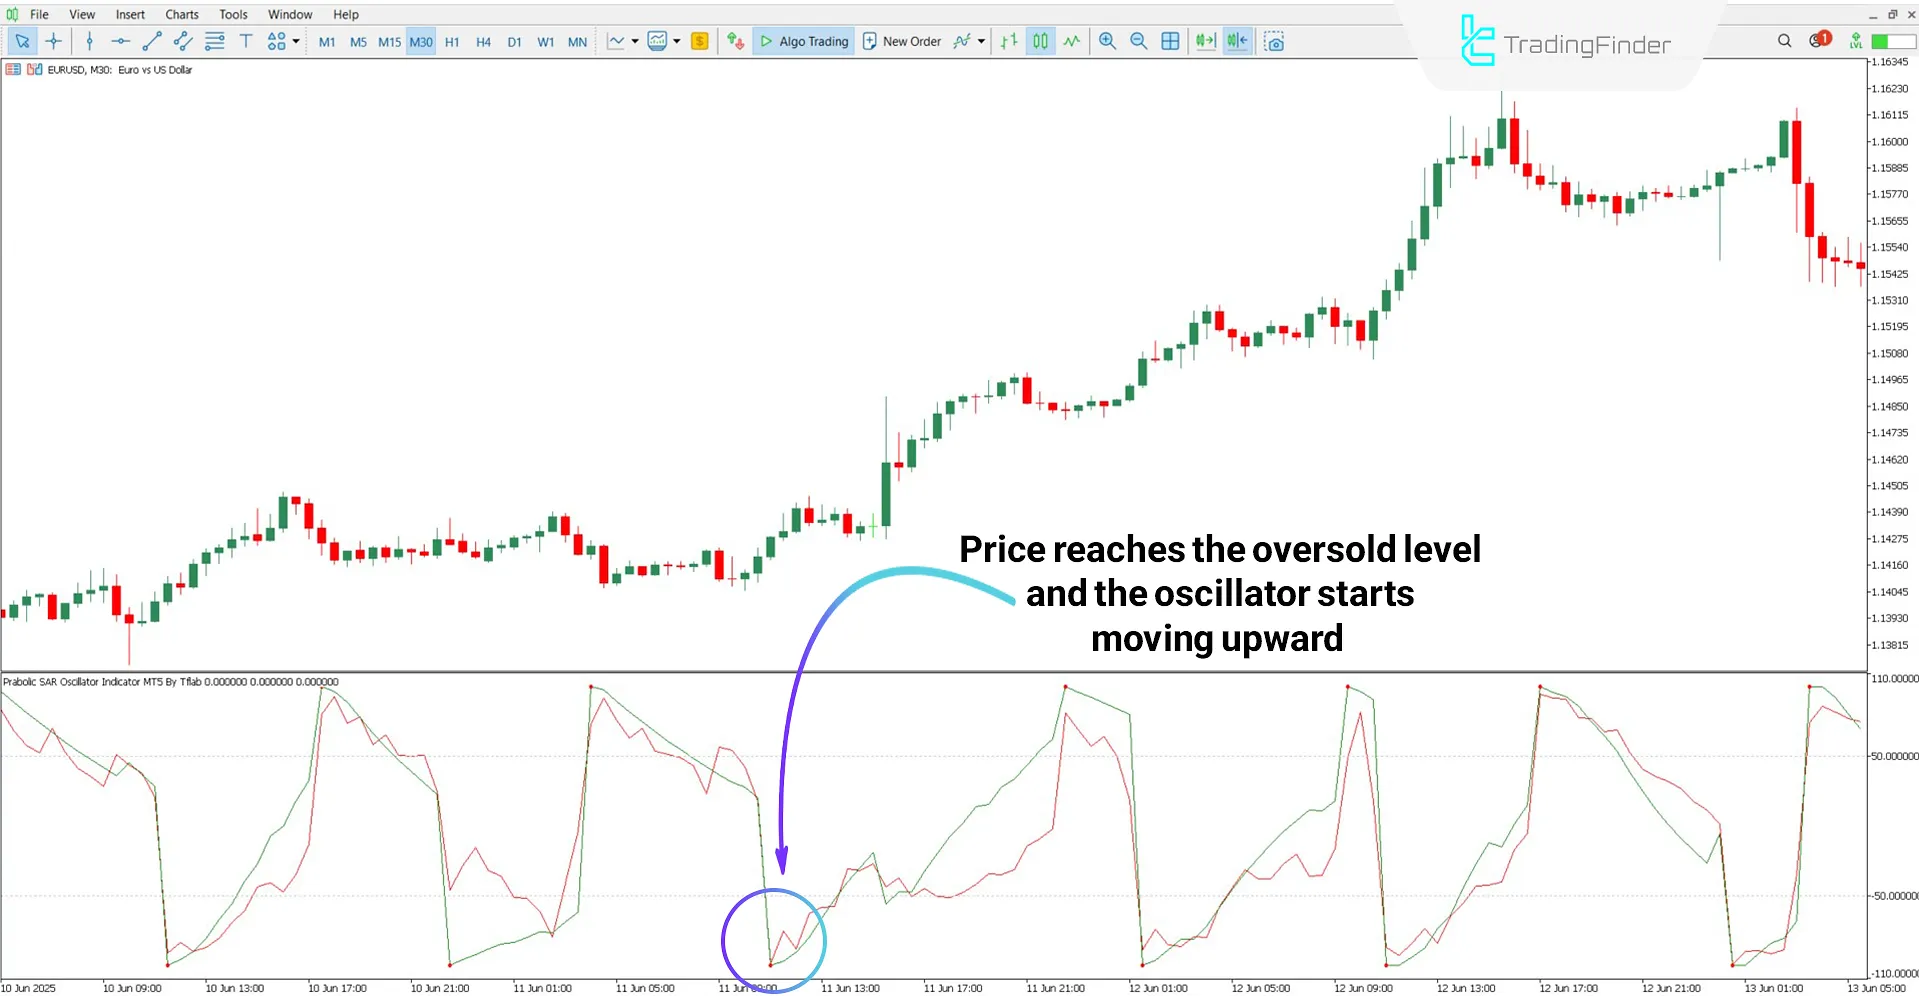
According to the 30-minute EUR/USD chart analysis, the oscillator has entered the oversold zone and a red dot has appeared below the oscillator.
Additionally, the steeper upward slope of the oscillator lines indicates a trend reversal and a potential market turnaround.

Bearish Trend
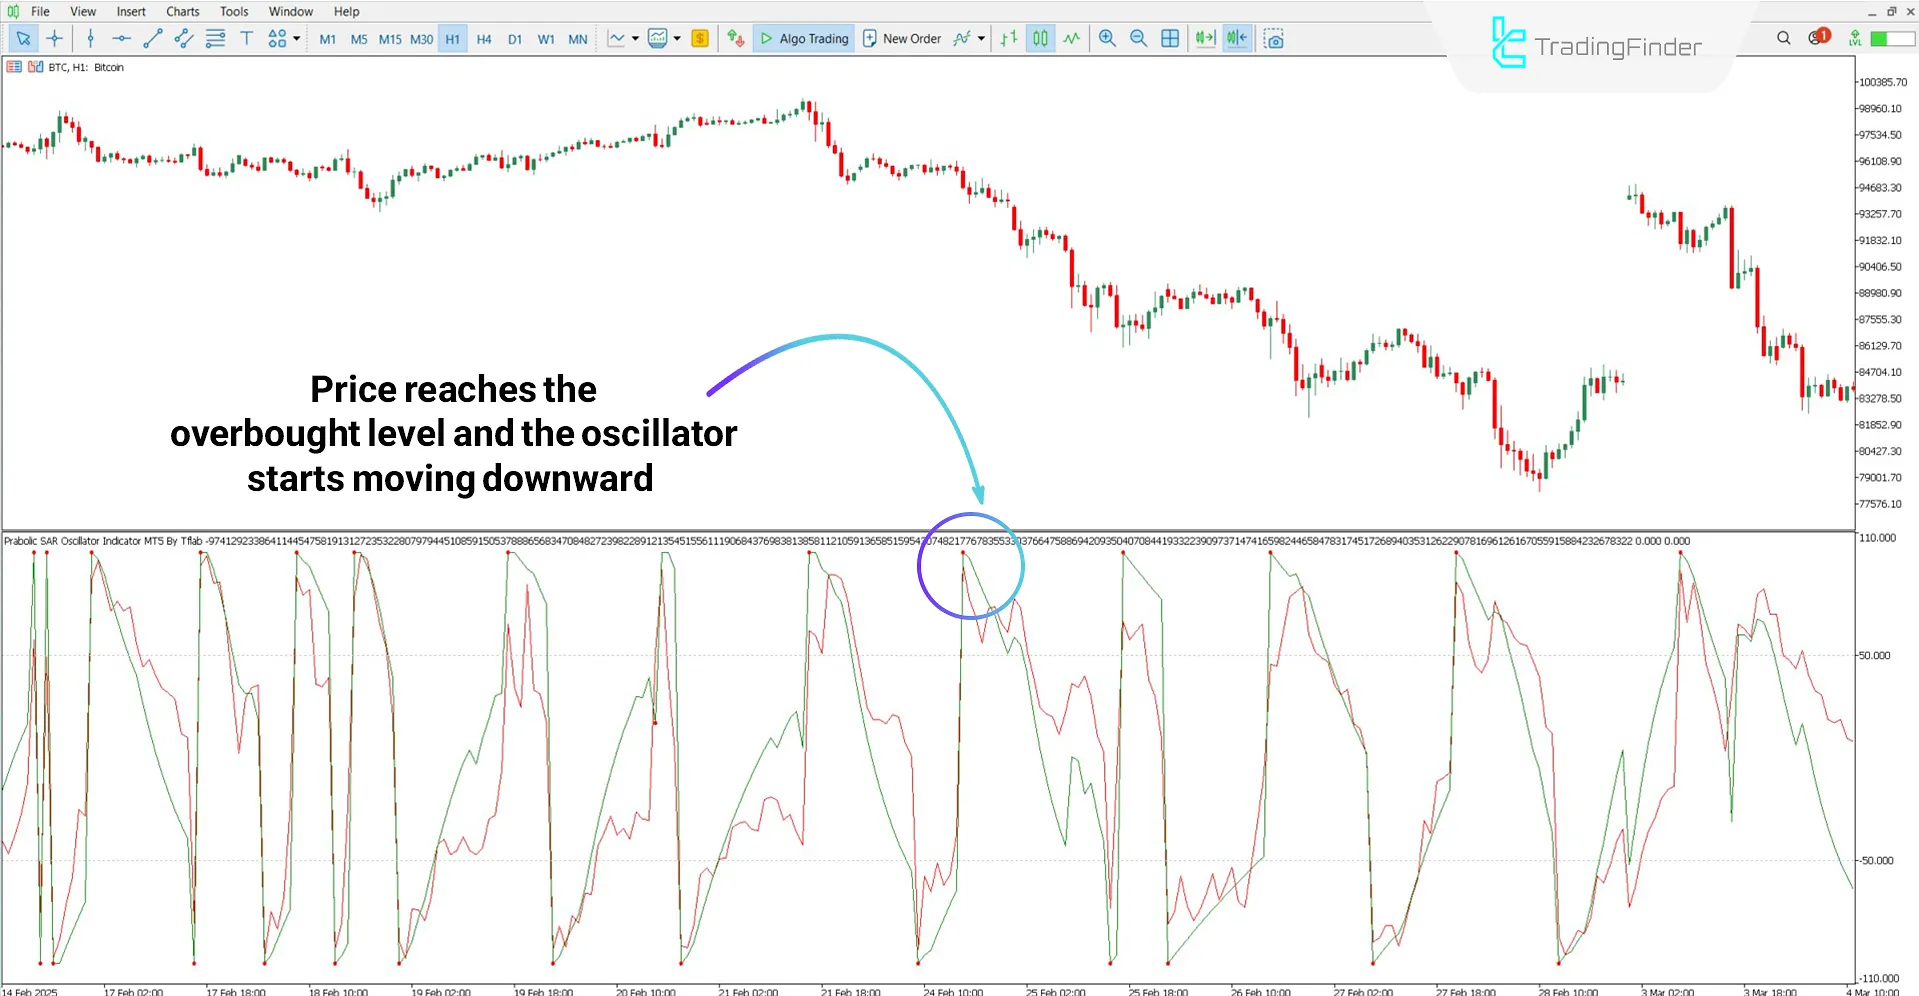
Based on the 1-hour chart of Bitcoin (BTC), the marked area represents the overbought level. After the price entered this zone, a trend reversal occurred and the market moved into a corrective or bearish phase.

Parabolic SAR Oscillator Settings
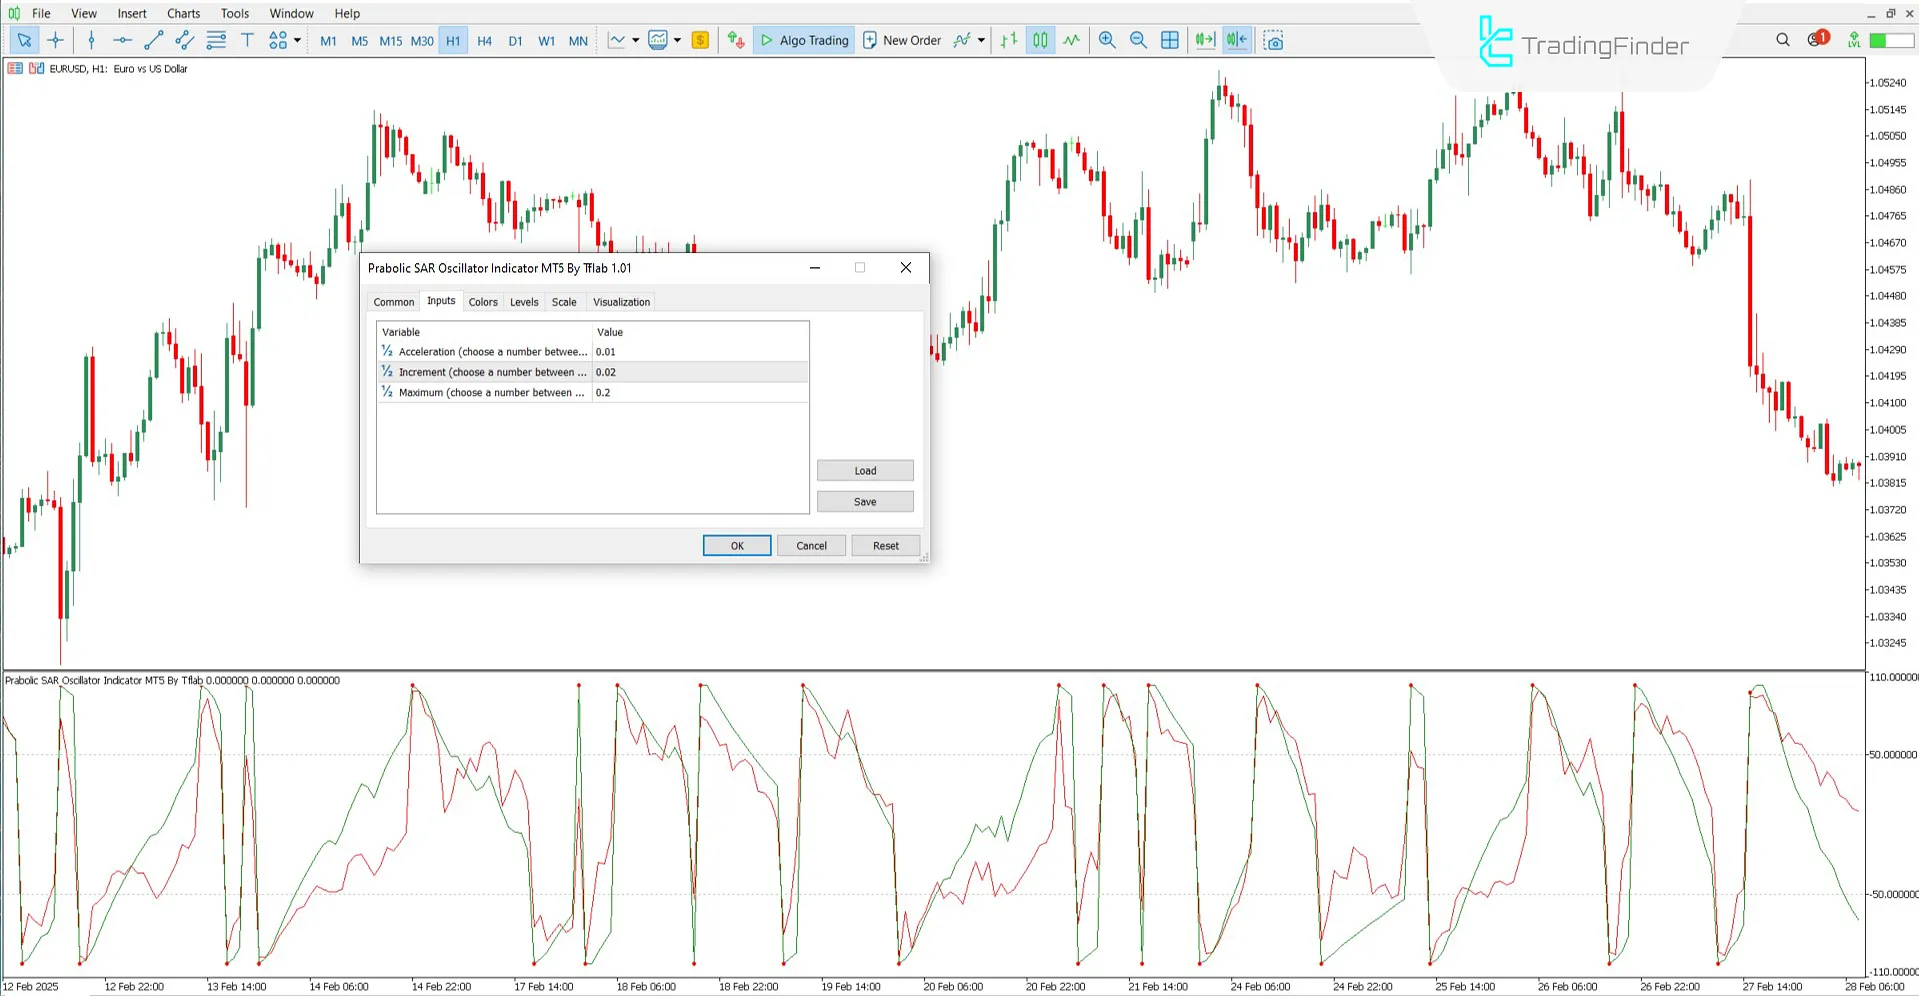
The following are the Parabolic SAR Oscillator settings:

- Acceleration: Initial acceleration in SAR calculations
- Increment: The amount of acceleration increase at each step of the trend
- Maximum: The maximum permissible acceleration value
Conclusion
The Parabolic SAR Oscillator, by using oscillating lines instead of the classic "SAR" dots, provides a clearer view of market momentum and potential reversals.
Its main settings include acceleration parameters that adjust the indicator’s precision and responsiveness.
This analytical tool is an effective option for identifying trend direction and determining the right time to enter or exit trades.
Parabolic SAR Oscillator MT5 PDF
Parabolic SAR Oscillator MT5 PDF
Click to download Parabolic SAR Oscillator MT5 PDFHow does the Parabolic SAR Oscillator indicate overbought and oversold conditions?
This tool includes two levels at the top and bottom of the oscillator panel that represent overbought and oversold zones. If the oscillator penetrates these levels, the indicator marks the point of penetration with a red dot.
Can this oscillator be used on higher time frames as well?
Yes, the Parabolic SAR Oscillator is multi-timeframe and can be applied across all time frames.


