![Spearman Correlation Indicator MT5 Download - [TradingFinder]](https://cdn.tradingfinder.com/image/263949/2-25-en-spearman-correlation-mt5-1.webp)
![Spearman Correlation Indicator MT5 Download - [TradingFinder] 0](https://cdn.tradingfinder.com/image/263949/2-25-en-spearman-correlation-mt5-1.webp)
![Spearman Correlation Indicator MT5 Download - [TradingFinder] 1](https://cdn.tradingfinder.com/image/263951/2-25-en-spearman-correlation-mt5-2.webp)
![Spearman Correlation Indicator MT5 Download - [TradingFinder] 2](https://cdn.tradingfinder.com/image/263952/2-25-en-spearman-correlation-mt5-3.webp)
![Spearman Correlation Indicator MT5 Download - [TradingFinder] 3](https://cdn.tradingfinder.com/image/263950/2-25-en-spearman-correlation-mt5-4.webp)
The Spearman Correlation Indicator is a technical analysis tool for the MetaTrader 5 (MT5) platform based on the Spearman correlation coefficient.
This MT5 oscillator includes an oscillating line that displays overbought and oversold zones on the chart with green and red colored levels.
Spearman Correlation Indicator Specifications Table
Table below presents the features of the Spearman Correlation Indicator.
Indicator Categories: | Oscillators MT5 Indicators Signal & Forecast MT5 Indicators Volatility MT5 Indicators |
Platforms: | MetaTrader 5 Indicators |
Trading Skills: | Intermediate |
Indicator Types: | Reversal MT5 Indicators |
Timeframe: | Multi-Timeframe MT5 Indicators |
Trading Style: | Day Trading MT5 Indicators |
Trading Instruments: | Forex MT5 Indicators Crypto MT5 Indicators Stock MT5 Indicators |
Indicator Overview
The Spearman Correlation Oscillator fluctuates between -1 and +1, marking overbought zones with green and oversold zones with pink.
The MT5 Volatility indicator is a powerful technical analysis tool that provides traders with suitable Buy and Sell signals.
Uptrend Conditions
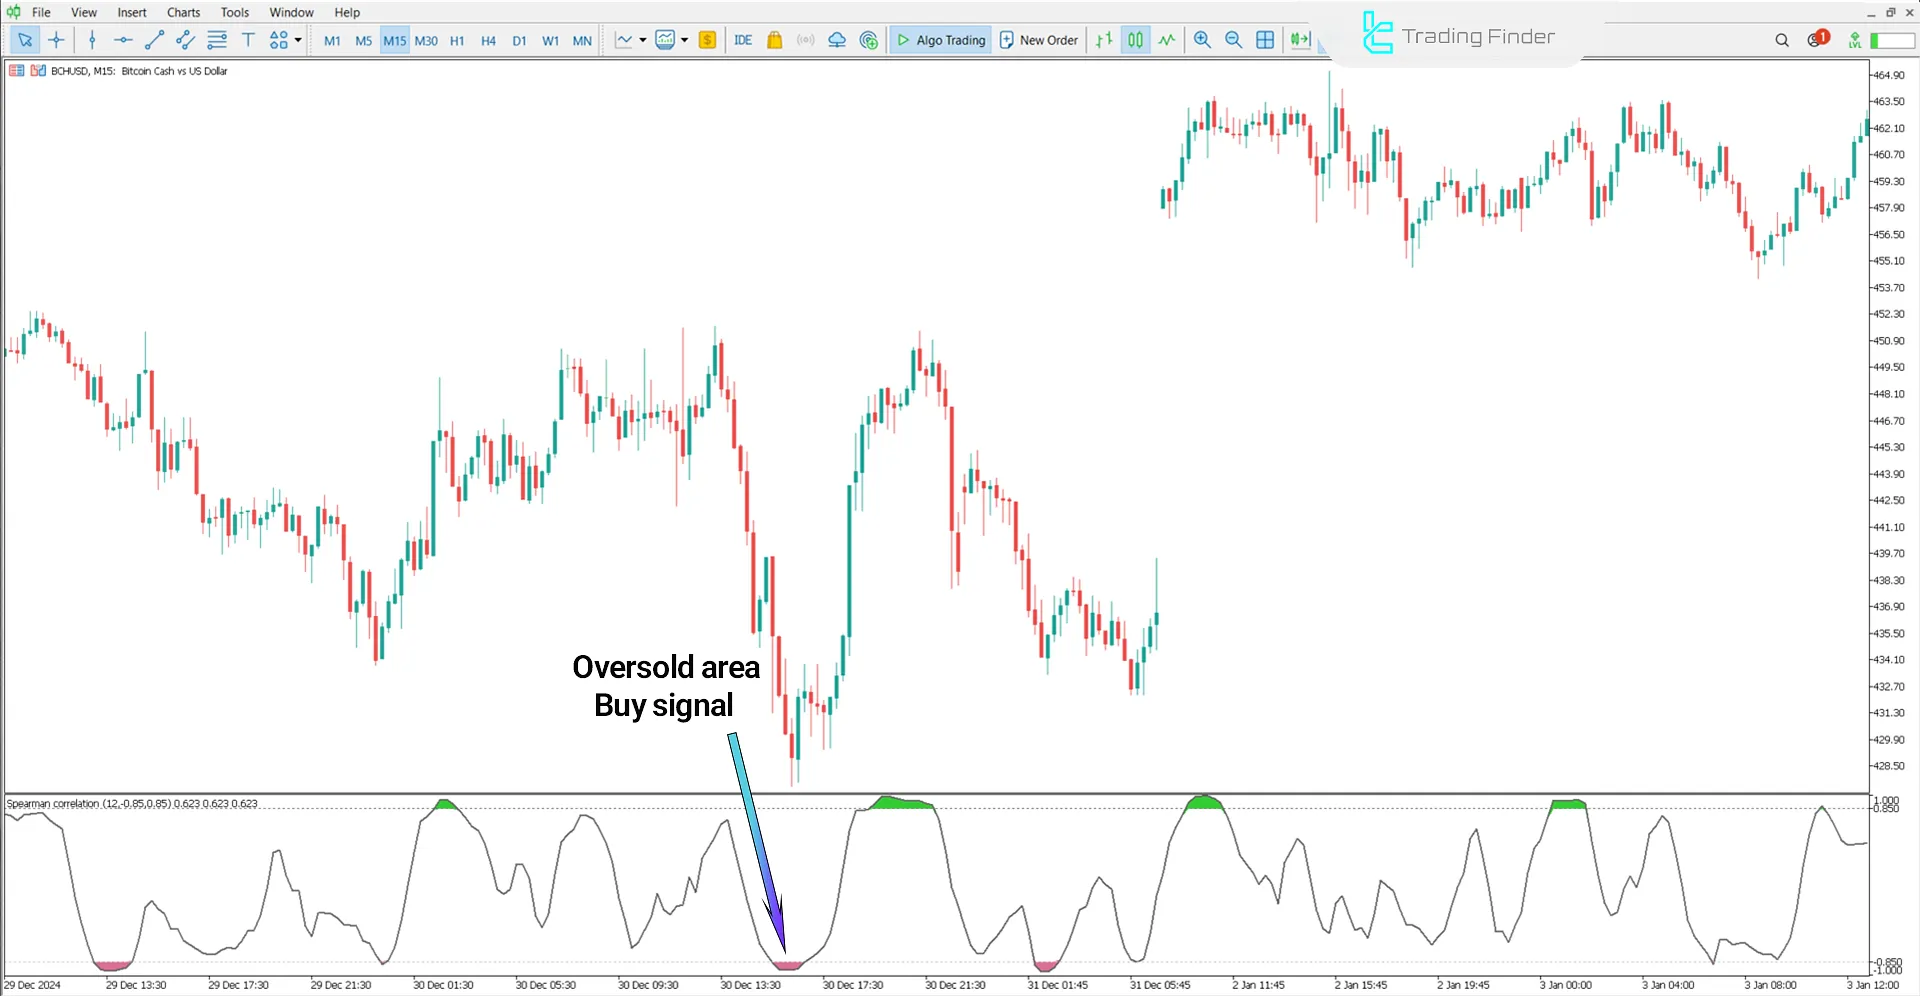
The price chart of Bitcoin Cash against the US Dollar (BCHUSD) is visible in the 15-minute timeframe.
As the price moves, the oscillator enters the oversold zone and is displayed in pink at the -1 level; in this condition, a Buy signal is generated.

Downtrend Conditions
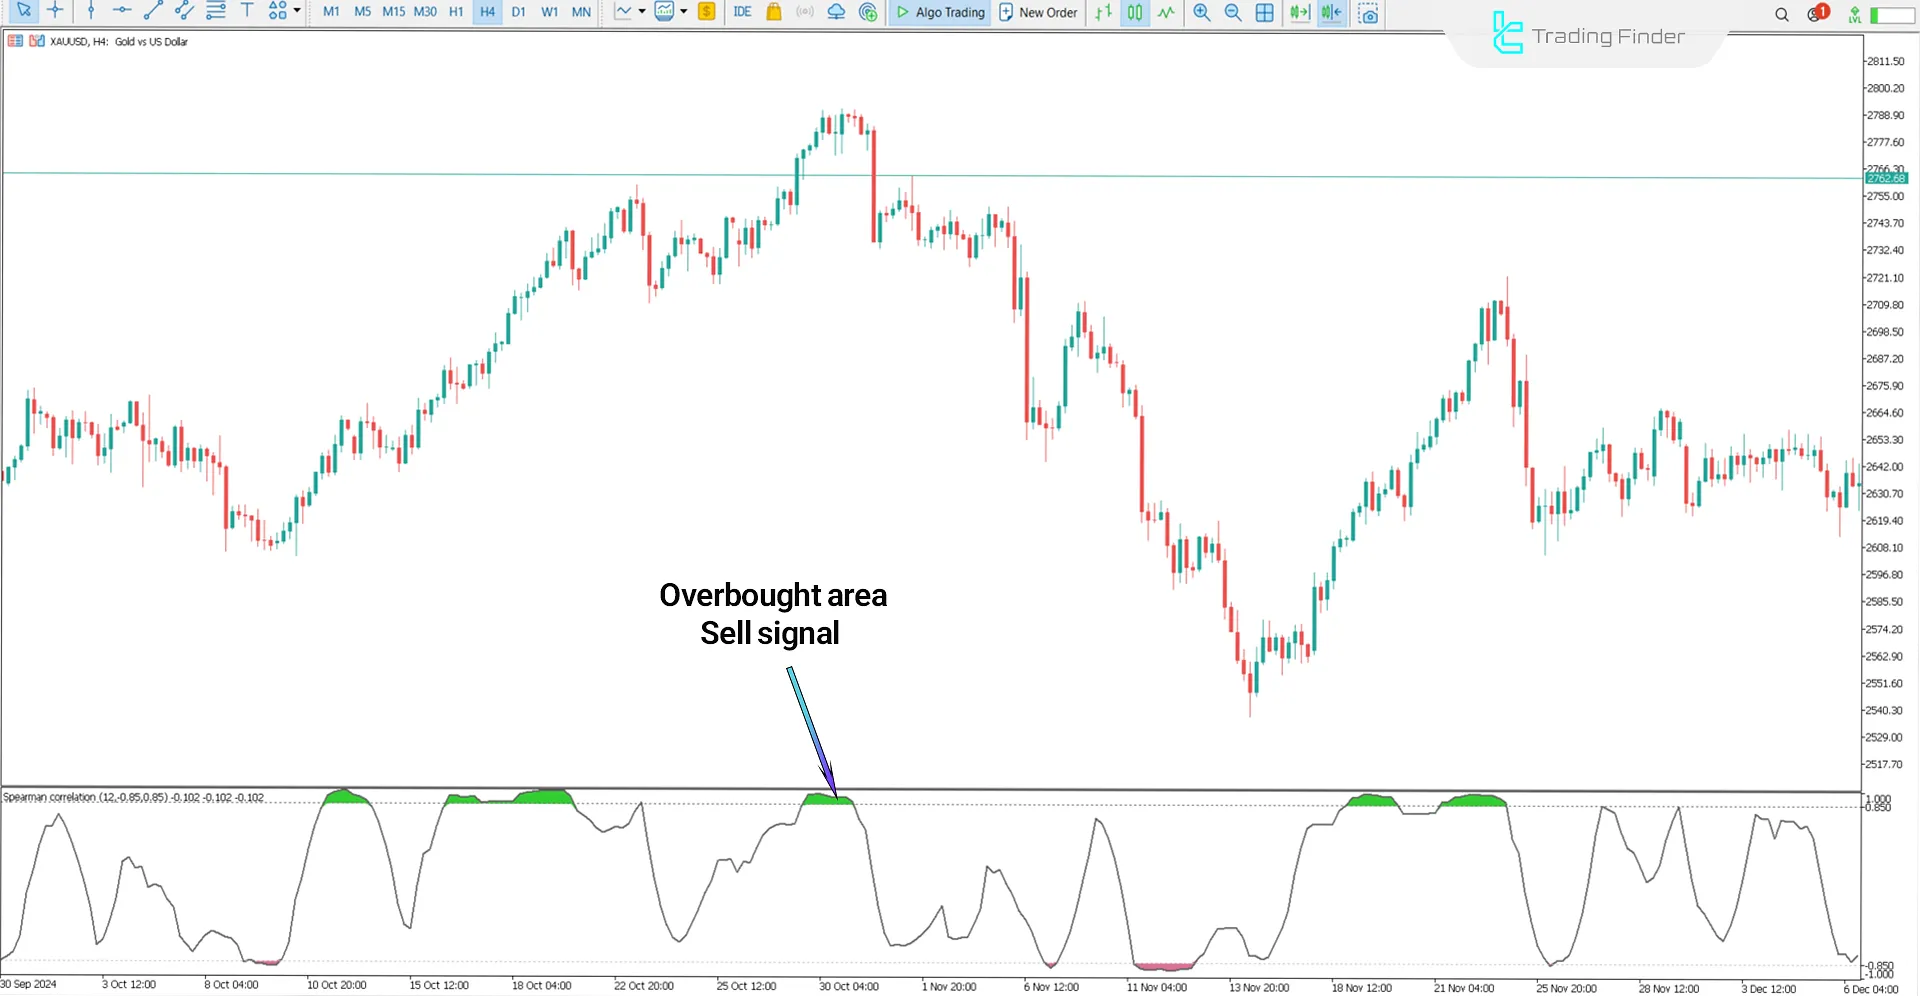
The following image displays the price chart of Gold Spot (XAUUSD). The overbought condition is revealed when green levels appear in the +1 range.
In this scenario, the sellers' strength increases, generating a Sell signal.

Indicator Settings
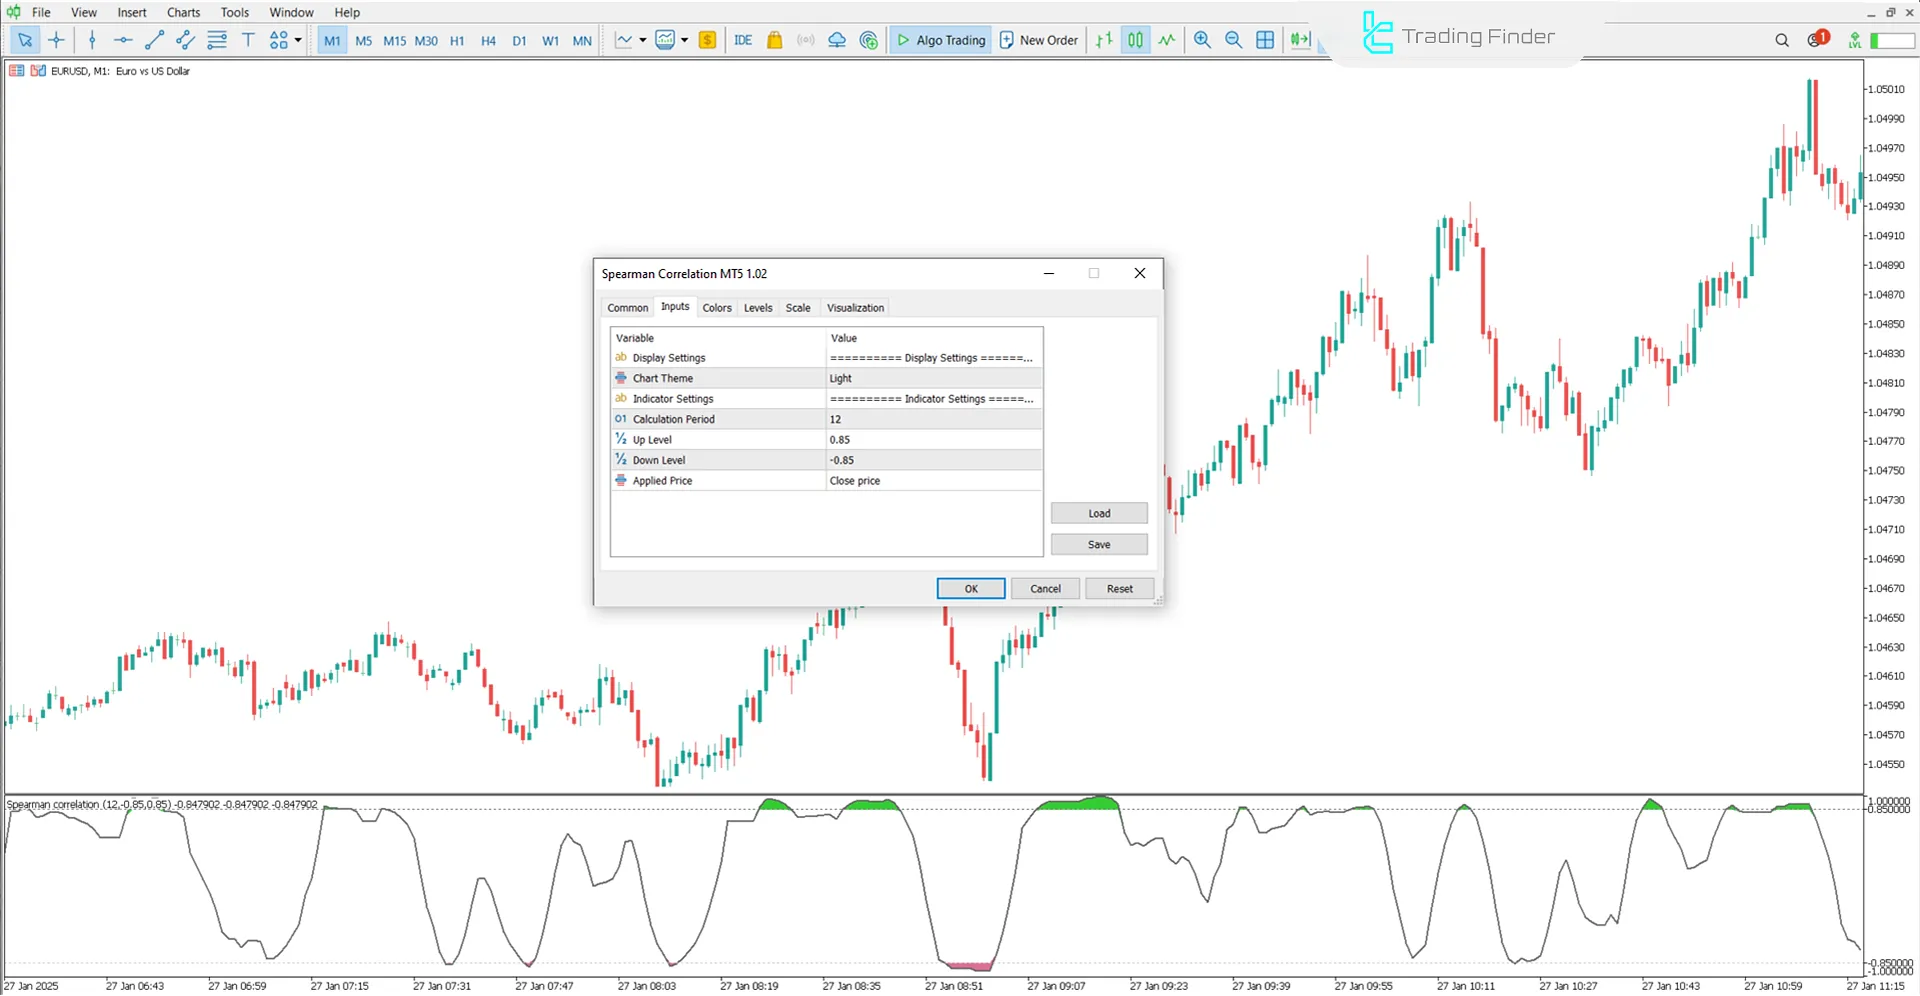
Image below shows the settings of the Spearman Correlation Indicator in the MetaTrader 5 platform:

- Calculator Settings: Calculation parameters
- Up Level: Upper threshold
- Down Level: Lower threshold
- Applied Price: Input value
Conclusion
The Spearman Correlation Trading Tool examines the linear correlation within the range of -1 to +1.
This MT5 Volatility indicator identifies overbought and oversold zones, displaying colored levels within the oscillation range and providing appropriate signals.
Spearman Correlation MT5 PDF
Spearman Correlation MT5 PDF
Click to download Spearman Correlation MT5 PDFIs the Spearman Correlation Oscillator only applicable in the Forex market?
No, this tool can be used in all financial markets.
Which timeframes are suitable for the Spearman Correlation Oscillator?
The Spearman Correlation Indicator can be used in both short-term and long-term timeframes.


