![Pennant Pattern Indicator for MT5 Download – Free – [TradingFinder]](https://cdn.tradingfinder.com/image/349965/13-107-en-pennant-pattern-mt5-01.webp)
![Pennant Pattern Indicator for MT5 Download – Free – [TradingFinder] 0](https://cdn.tradingfinder.com/image/349965/13-107-en-pennant-pattern-mt5-01.webp)
![Pennant Pattern Indicator for MT5 Download – Free – [TradingFinder] 1](https://cdn.tradingfinder.com/image/349962/13-107-en-pennant-pattern-mt5-02.webp)
![Pennant Pattern Indicator for MT5 Download – Free – [TradingFinder] 2](https://cdn.tradingfinder.com/image/349964/13-107-en-pennant-pattern-mt5-03.webp)
![Pennant Pattern Indicator for MT5 Download – Free – [TradingFinder] 3](https://cdn.tradingfinder.com/image/349963/13-107-en-pennant-pattern-mt5-04.webp)
The Pennant Pattern Indicator provides a visual display on the chart using colored lines to highlight two continuationstructures the Pennant and the Flag. This pattern typically emerges after a strong price movement, commonly called the flagpole.
In technical analysis, the pennant is considered a reliable continuation pattern that often confirms the prevailing market trend.
Pennant Pattern Indicator Specifications Table
The following table describes the features of the Pennant Pattern indicator.
Indicator Categories: | Price Action MT5 Indicators Trading Assist MT5 Indicators Chart & Classic MT5 Indicators |
Platforms: | MetaTrader 5 Indicators |
Trading Skills: | Elementary |
Timeframe: | Multi-Timeframe MT5 Indicators |
Trading Style: | Scalper MT5 Indicators Day Trading MT5 Indicators Fast Scalper MT5 Indicators |
Trading Instruments: | Forex MT5 Indicators Crypto MT5 Indicators Stock MT5 Indicators Forward MT5 Indicators |
Pennant Pattern Indicator at a Glance
The Pennant Pattern represents a temporary price compression in a small triangular shape, usually appearing as a short pause in a strong market trend.
This structure often forms within a strong trend and typically continues in the same direction with increased momentum.
To enhance pattern recognition, the indicator uses blue lines to represent the "Flag" pattern and orange lines to depict the Pennant structure on the chart.
Bullish Trend Scenario
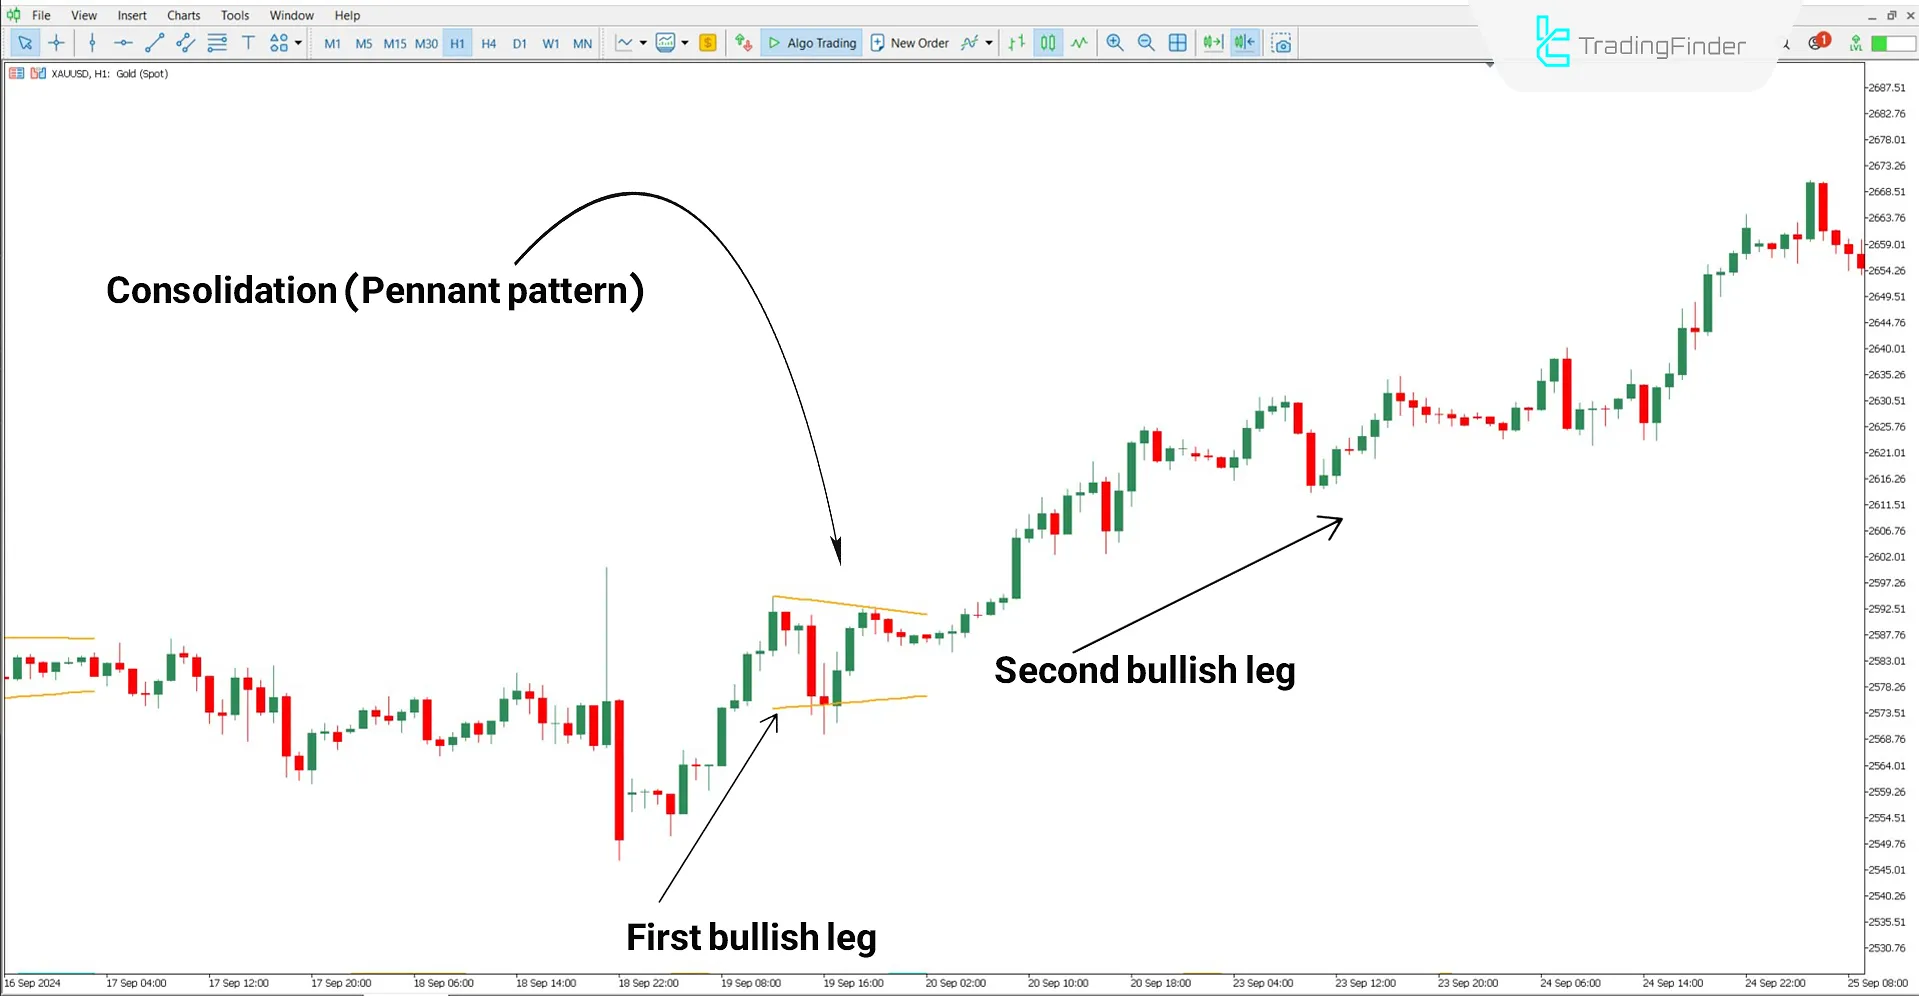
On the 1-hour chart of Gold vs. US Dollar (XAU/USD), the price enters a consolidation phase after a strong bullish movement as the first leg. In this area, the indicator identifies and highlights the Pennant Pattern. Upon a bullish breakout, the trend continues, and the second leg forms with increased acceleration.

Bearish Trend Scenario
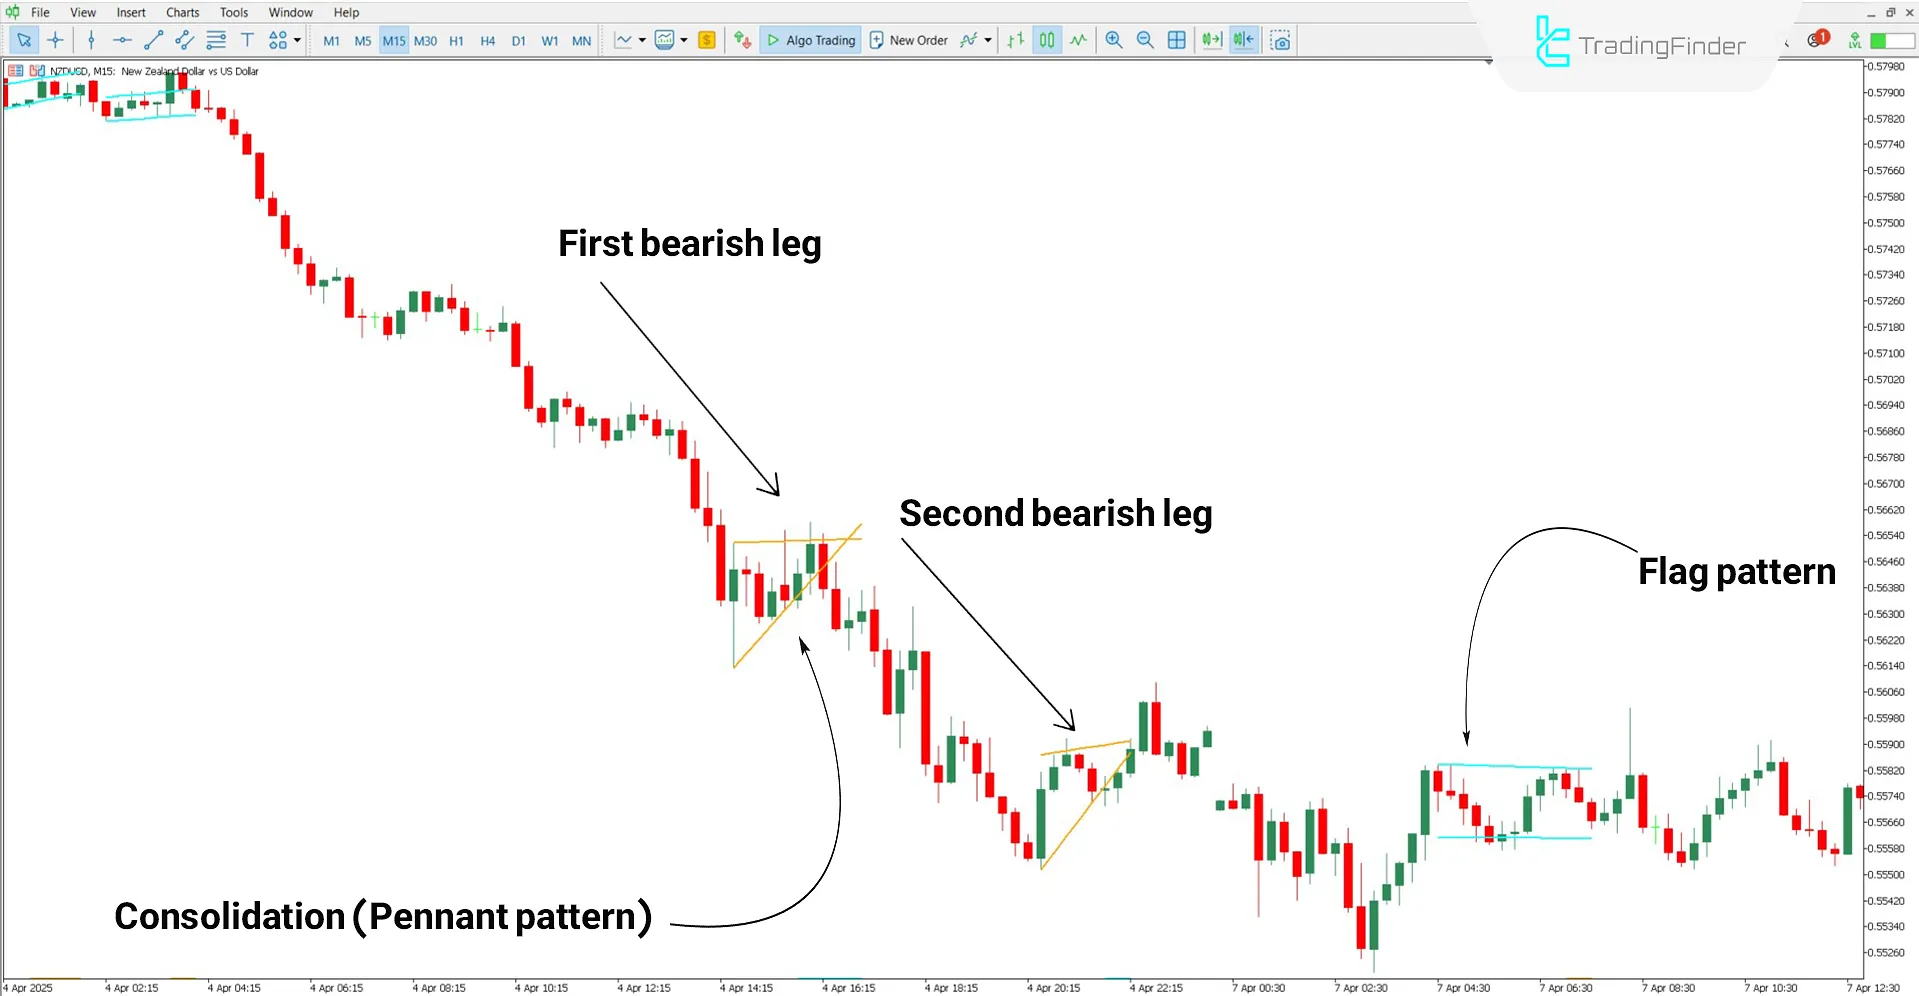
On the 15-minute chart of NZD/USD, following an initial price drop and formation of the first bearishleg, the market consolidates within a tight range where the Pennant pattern forms. A breakout to the downside continues the bearish move and provides a suitable entry for short positions.

Pennant Pattern Indicator Settings
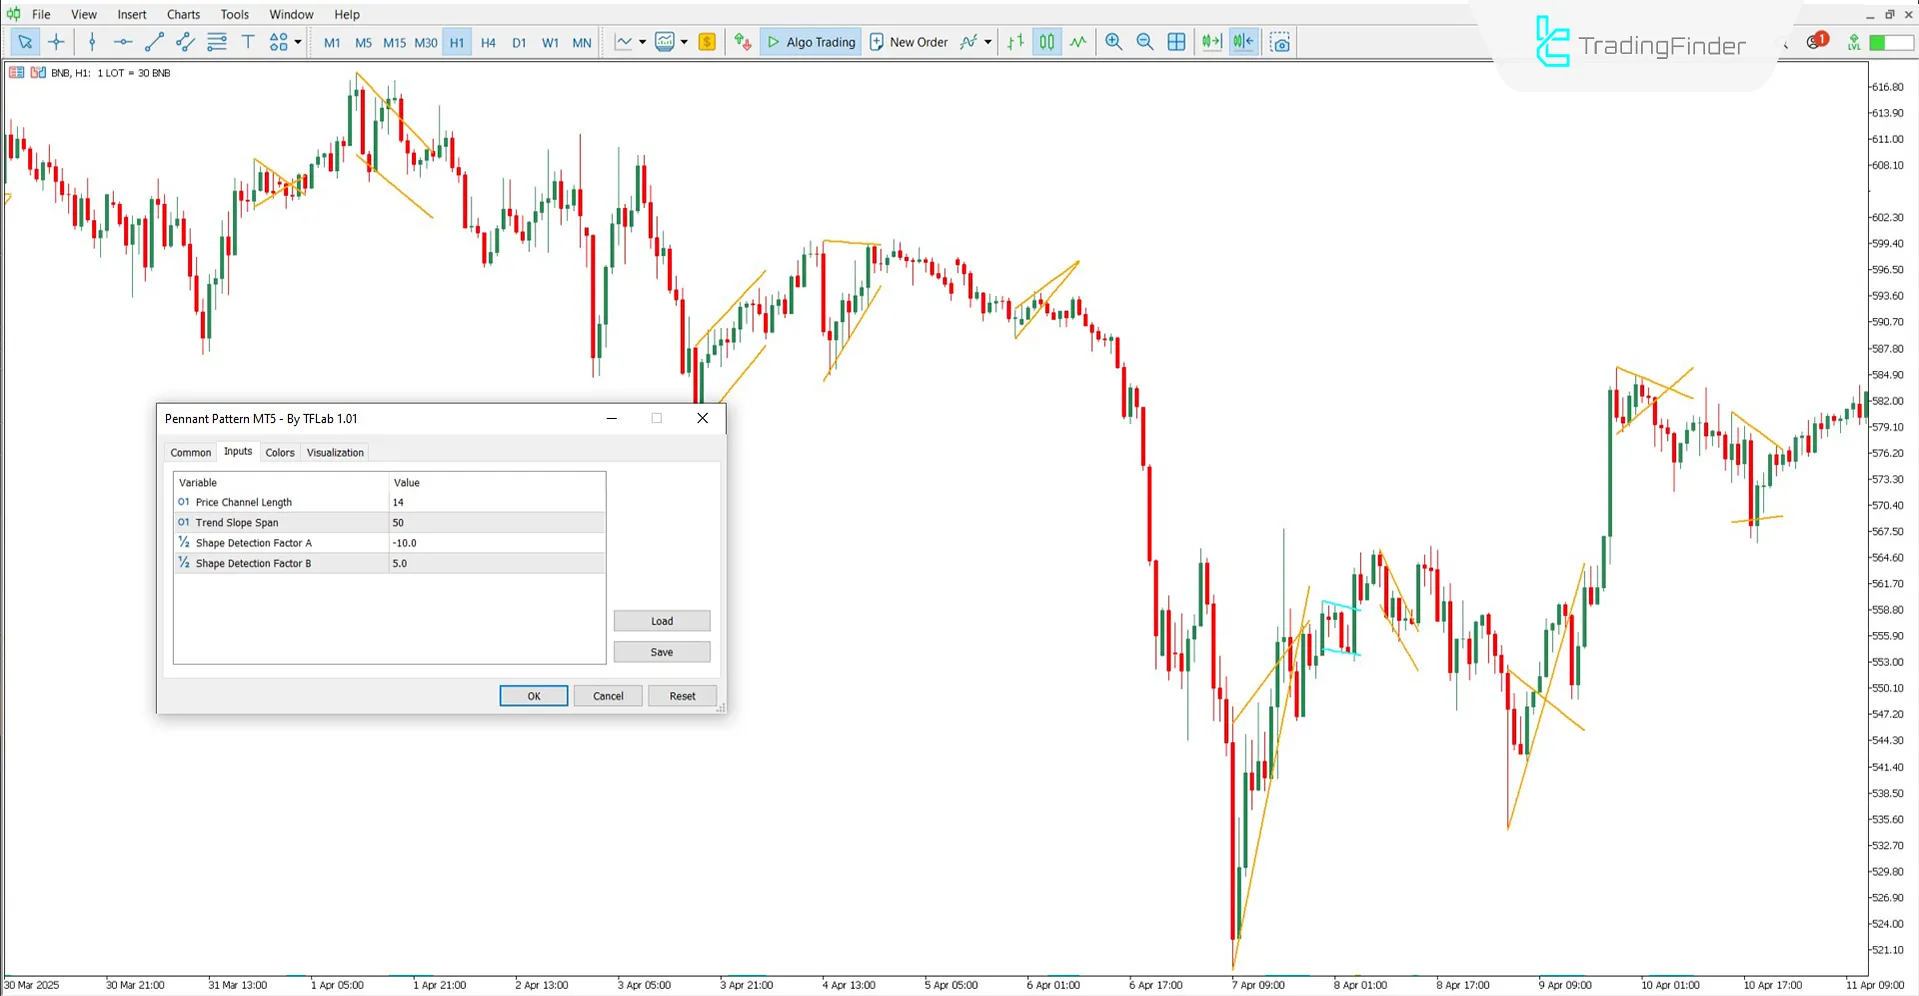
The following image displays the settings section of the Pennant Pattern Indicator, allowing users to customize the tool's behavior:

- Price Channel Length: Number of candles used for drawing the channel
- Trend Slope Span: Parameter for calculating the pattern's slope
- Shape Detection Factor A: Calculations for forming the Pennant pattern
- Shape Detection Factor B: Calculations for forming the Flag pattern
Conclusion
The Pennant Pattern Indicator, developed based on Price Action concepts, can display both Pennant and Flag patterns. These structures typically appear after sharp price movements and signal the continuation of the previous trend.
This tool is suitable for all markets, including Forex, Cryptocurrencies, Stocks, and Commodities, and offers great flexibility across various trading strategies overall.
Pennant Pattern MT5 PDF
Pennant Pattern MT5 PDF
Click to download Pennant Pattern MT5 PDFWhat's the difference between a Pennant and a Flag pattern?
The Pennant pattern resembles a small symmetrical triangle with converging lines, whereas the Flag pattern appears as a parallel channel structure.
Can the Pennant Pattern Indicator be used in the crypto market?
Yes, this indicator applies to all financial markets, including cryptocurrencies, forex, stocks, and commodities.


