![Precision Swing Point Indicator for MT5 Download - [TradingFinder]](https://cdn.tradingfinder.com/image/234538/2-7-en-precision_swing_point-mt5-1.webp)
![Precision Swing Point Indicator for MT5 Download - [TradingFinder] 0](https://cdn.tradingfinder.com/image/234538/2-7-en-precision_swing_point-mt5-1.webp)
![Precision Swing Point Indicator for MT5 Download - [TradingFinder] 1](https://cdn.tradingfinder.com/image/234539/2-7-en-precision_swing_point-mt5-2.webp)
![Precision Swing Point Indicator for MT5 Download - [TradingFinder] 2](https://cdn.tradingfinder.com/image/234541/2-7-en-precision_swing_point-mt5-3.webp)
![Precision Swing Point Indicator for MT5 Download - [TradingFinder] 3](https://cdn.tradingfinder.com/image/234540/2-7-en-precision_swing_point-mt5-4.webp)
The Precision Swing Point Indicator operates based on the analysis of swing points on the price chart and can accurately identify highs and lows in MetaTrader 5.
A key feature of this MetaTrader5 Pivot Point and Fractal indicator is its ability to filter market noise and relatively enhance the accuracy of signals.
Precision Swing Point Specifications Table
The following table outlines the general specifications of the Precision Swing Point Indicator on the MetaTrader 5 platform.
Indicator Categories: | Price Action MT5 Indicators Pivot Points & Fractals MT5 Indicators Candle Sticks MT5 Indicators |
Platforms: | MetaTrader 5 Indicators |
Trading Skills: | Intermediate |
Indicator Types: | Range MT5 Indicators |
Timeframe: | Multi-Timeframe MT5 Indicators |
Trading Style: | Day Trading MT5 Indicators |
Trading Instruments: | Forex MT5 Indicators Stock MT5 Indicators |
Indicator Overview
The Precision Swing Point Indicator can detect significant market reversal points by leveraging precise swing point calculations. These points are typically chosen from three classic candlestick pattern models and applied across three correlated symbols. Additionally, the tool utilizes Pivot Points to enhance the analysis of reversal points.
Buy and Sell Signals appear when the price crosses a significant reversal point, such as patterns like (Doji, 50% Body Candle, and Shooting Star), and begins moving in a new direction.
Uptrend Conditions
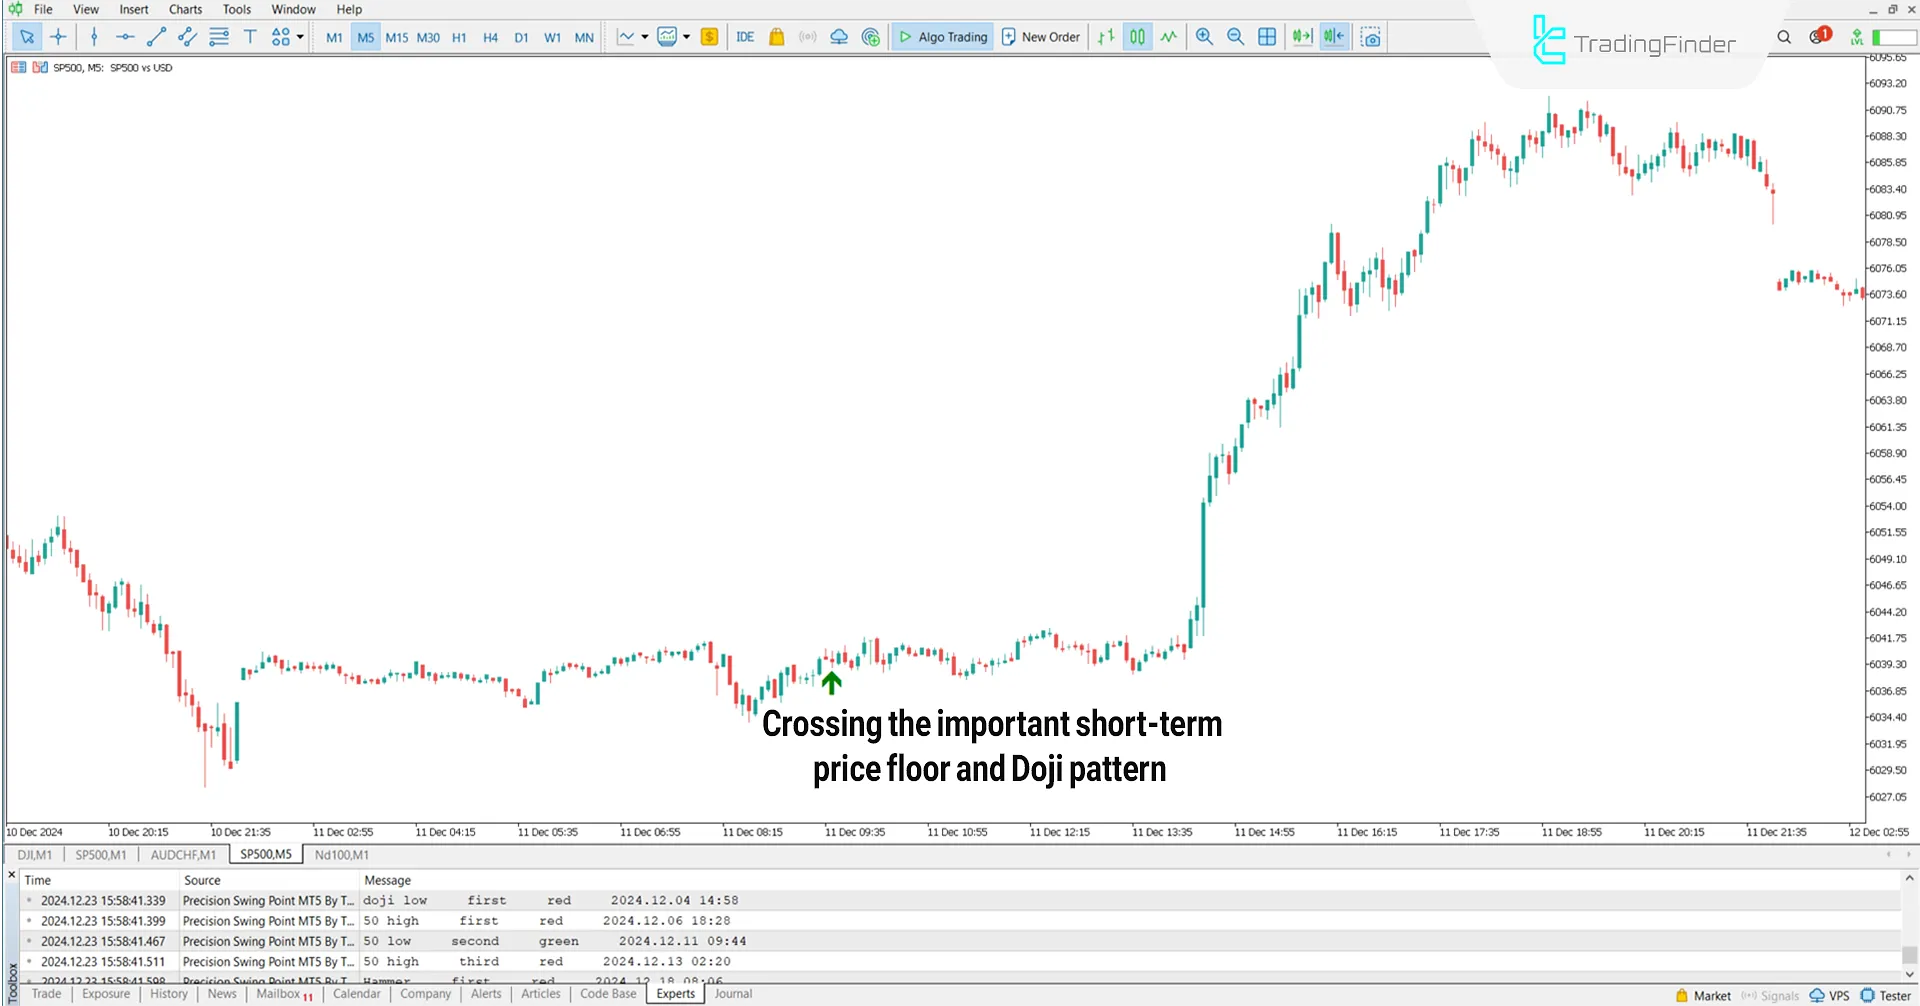
In the 5-minute price chart of the S&P 500 index, a Buy Signal in the Precision Swing Point Indicator is triggered when the price surpasses a Swing Low. The Doji pattern confirms the initiation of an uptrend.

Downtrend Conditions
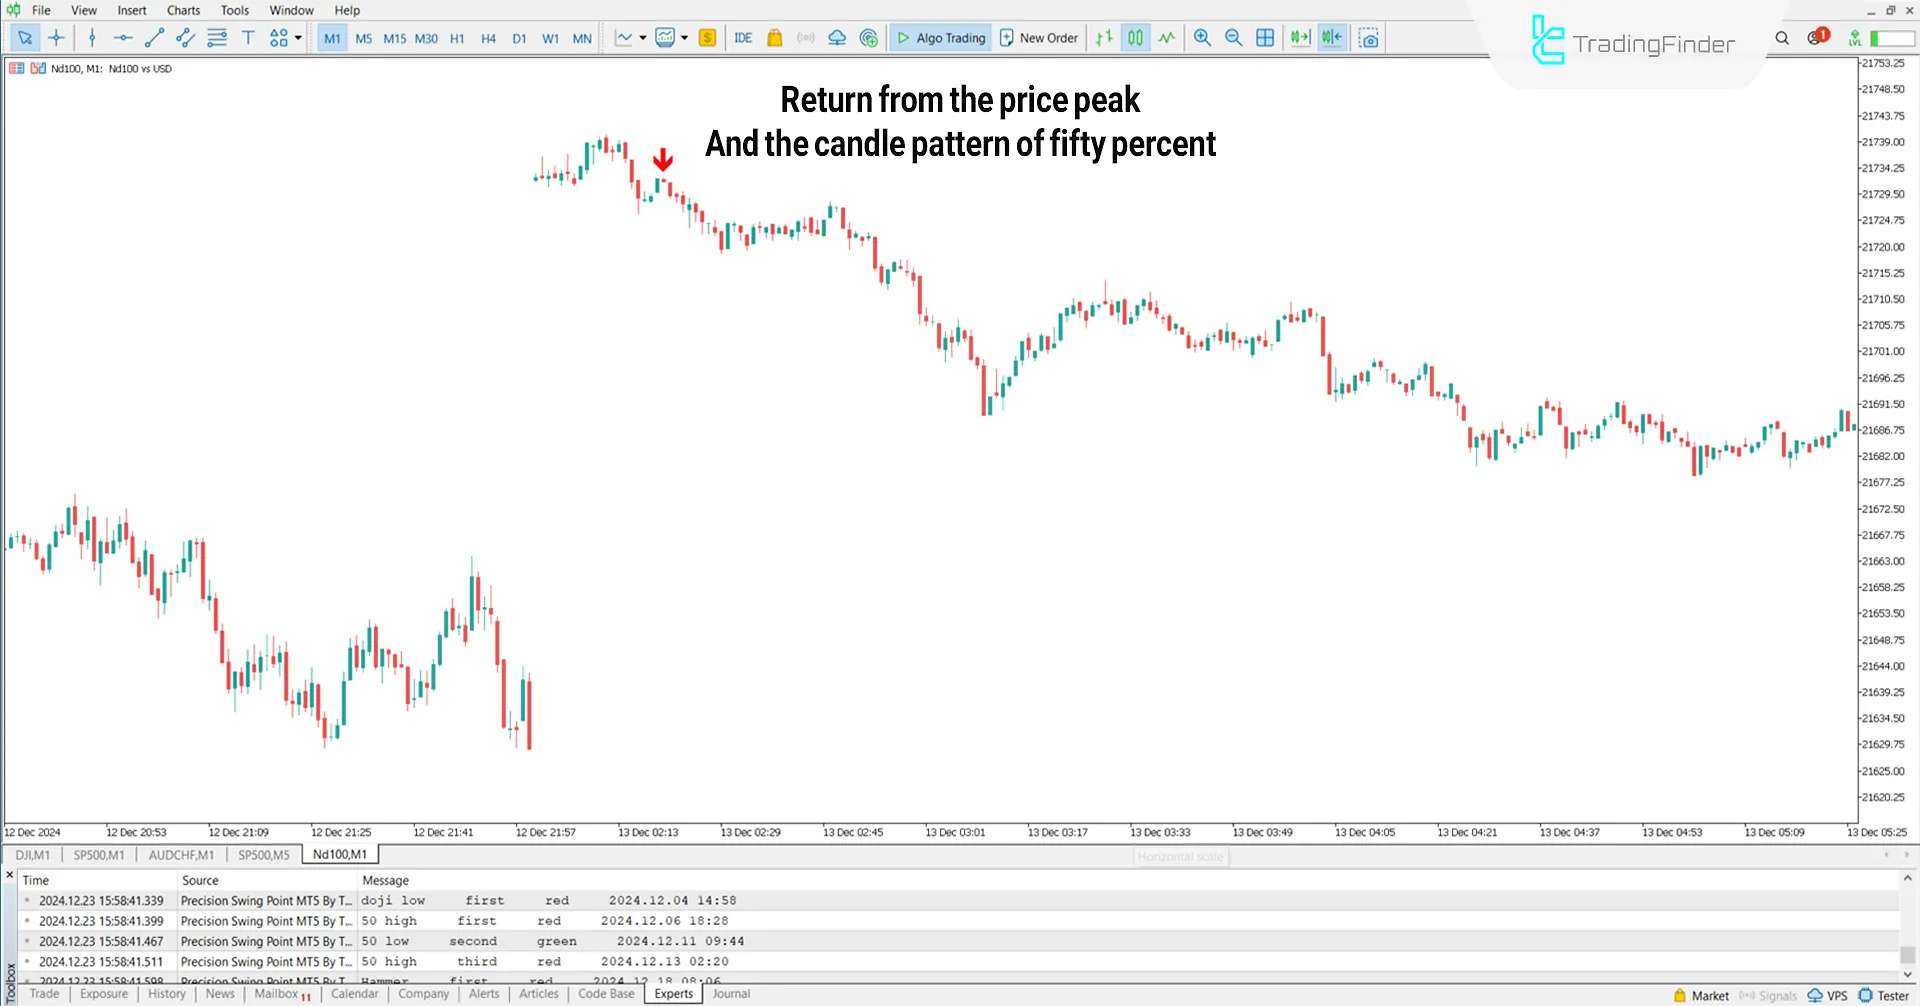
The following chart displays the NASDAQ 100 index (NASDAQ100) in a one-minute timeframe.
When the price surpasses a swing high, a sell signal in the Precision Swing Point Indicator is triggered, and the 50% Candle Body pattern confirms the start of a downtrend in MetaTrader5 indicator.
Under these conditions, the price drops below the previous high, reflecting seller pressure and the likelihood of a continued downtrend.

Indicator Settings
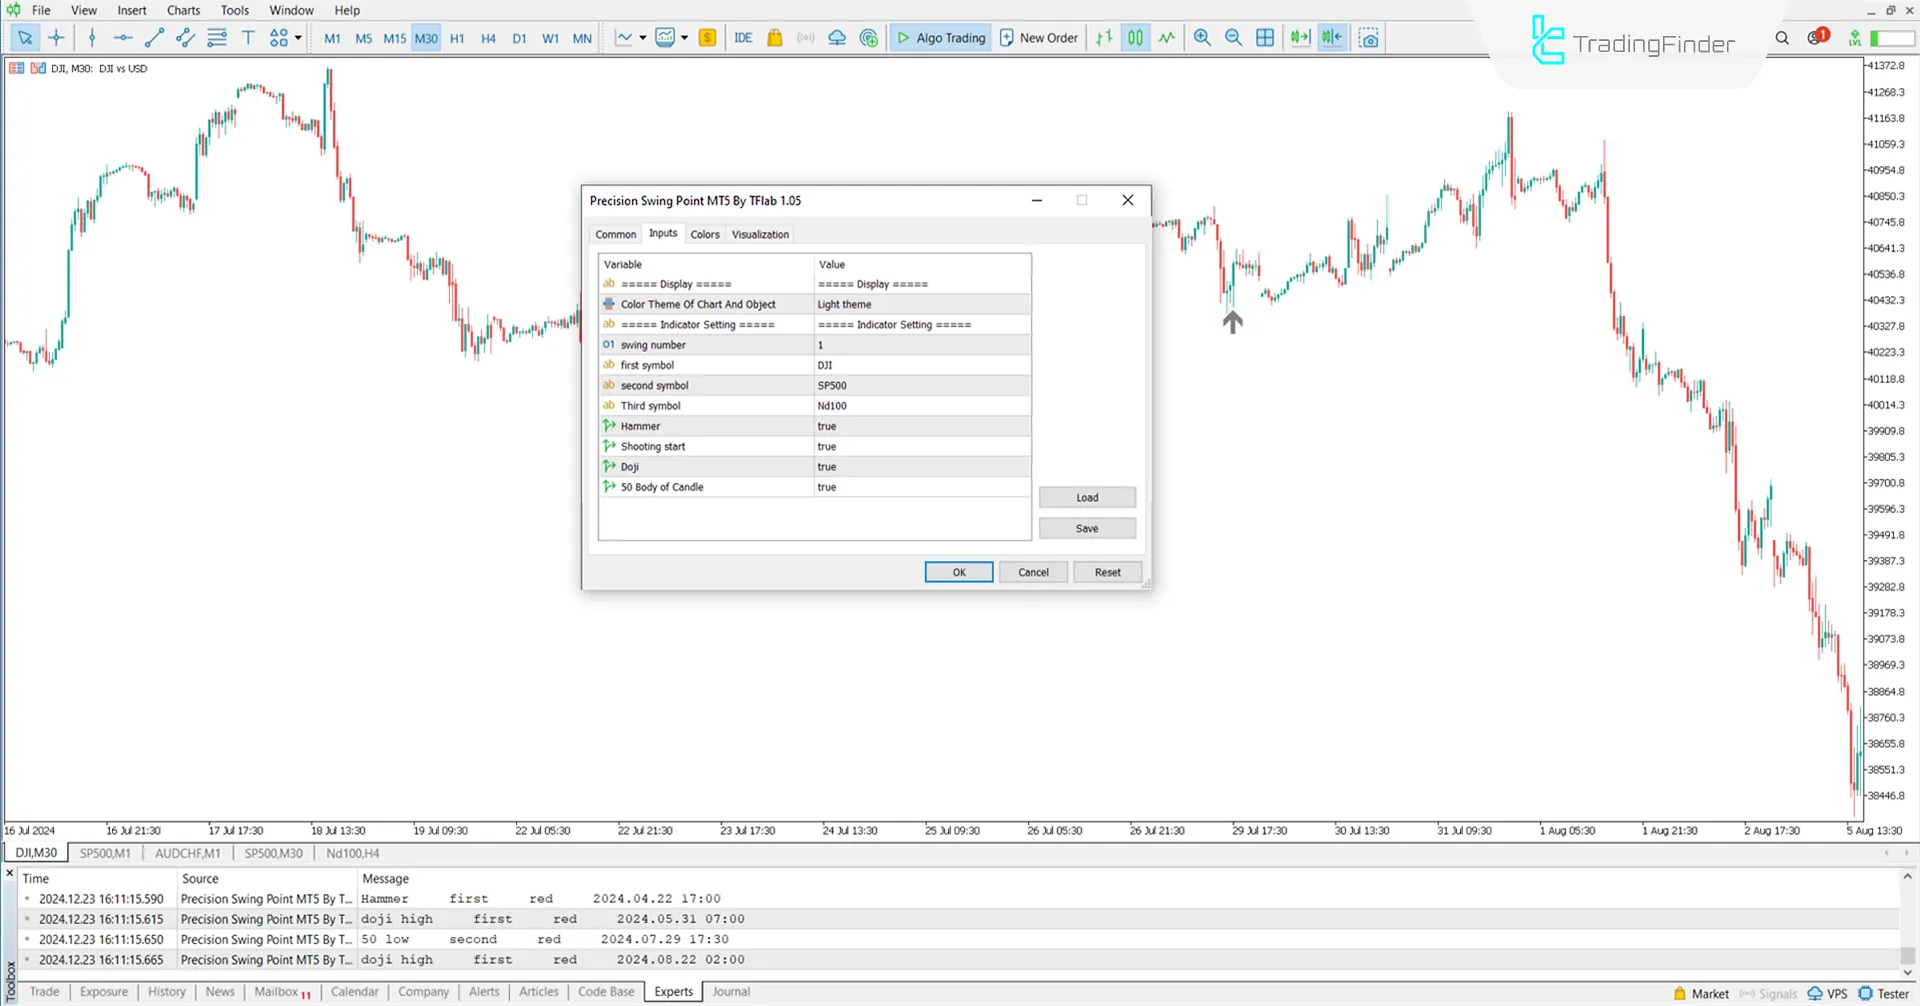
Details of the Precision Swing Point Indicator Settings are shown in the image below:

- Color Theme of Chart and Object: Visual style of chart and objects
- Swing number: Specific swing count for analysis
- First symbol: Main trading symbol
- Second symbol: Supporting symbol for comparison
- Third symbol: Additional symbol for context
- Hammer: Hammer candlestick
- Shooting Star: Shooting Star candlestick
- Doji: Doji candlestick
- 50 Body of Candle: 50% of the candlestick body
Conclusion
The Precision Swing Point Indicator provides signals based on identifying precise swing points on the price chart. This tool automatically offers Buy and Sell signals with green and red arrows.
These signals are generated based on the price crossing highs and lows and identifying three candlestick patterns.
Precision Swing Point MT5 PDF
Precision Swing Point MT5 PDF
Click to download Precision Swing Point MT5 PDFDoes this indicator automatically display Buy and Sell signals?
It uses green and red arrows to offer Buy and Sell signals.
When do Buy and Sell signals appear in this tool?
When the price crosses a reversal point and starts moving in a new direction.


