![Quarterly Theory ICT 01 Indicator for MT5 Download – Free – [TradingFinder]](https://cdn.tradingfinder.com/image/502726/13-188-en-quarterly-theory-ict-01-mt5-01.webp)
![Quarterly Theory ICT 01 Indicator for MT5 Download – Free – [TradingFinder] 0](https://cdn.tradingfinder.com/image/502726/13-188-en-quarterly-theory-ict-01-mt5-01.webp)
![Quarterly Theory ICT 01 Indicator for MT5 Download – Free – [TradingFinder] 1](https://cdn.tradingfinder.com/image/502720/13-188-en-quarterly-theory-ict-01-mt5-02.webp)
![Quarterly Theory ICT 01 Indicator for MT5 Download – Free – [TradingFinder] 2](https://cdn.tradingfinder.com/image/502719/13-188-en-quarterly-theory-ict-01-mt5-03.webp)
![Quarterly Theory ICT 01 Indicator for MT5 Download – Free – [TradingFinder] 3](https://cdn.tradingfinder.com/image/502724/13-188-en-quarterly-theory-ict-01-mt5-04.webp)
The Quarterly Theory ICT 01 Indicator is an advanced technical analysis tool based on ICT style principles and fractal time structure.
By precisely dividing periods into four consecutive phases (Q1, Q2, Q3, and Q4), it facilitates the identification of optimal market entry and exit points.
Additionally, by providing a graphical table, it offers the user a clear view of various time cycles.
Specifications Table – Quarterly Theory ICT 01 Indicator
The features of the Quarterly Theory ICT 01 Indicator are presented in the table below.
Indicator Categories: | Smart Money MT5 Indicators Trading Assist MT5 Indicators ICT MT5 Indicators |
Platforms: | MetaTrader 5 Indicators |
Trading Skills: | Advanced |
Indicator Types: | Reversal MT5 Indicators |
Timeframe: | Multi-Timeframe MT5 Indicators |
Trading Style: | Swing Trading MT5 Indicators Scalper MT5 Indicators Day Trading MT5 Indicators |
Trading Instruments: | Forex MT5 Indicators Crypto MT5 Indicators Stock MT5 Indicators |
Quarterly Theory ICT 01 Indicator at a Glance
In the Quarterly Theory ICT 01 Indicator, each timeframe (based on the user’s selection in settings) is divided into four equal parts called “Quarters.”
Each of these parts represents a stage of market behavior:
- Accumulation Phase (Q1): Market consolidation and preparation for the next move;
- Manipulation Phase (Q2): Start of the real trend with sudden volatility;
- Distribution Phase (Q3): Wide distribution of price;
- Continuation or Reversal Phase (Q4): Return or continuation of the previous trend.
Bullish Trend
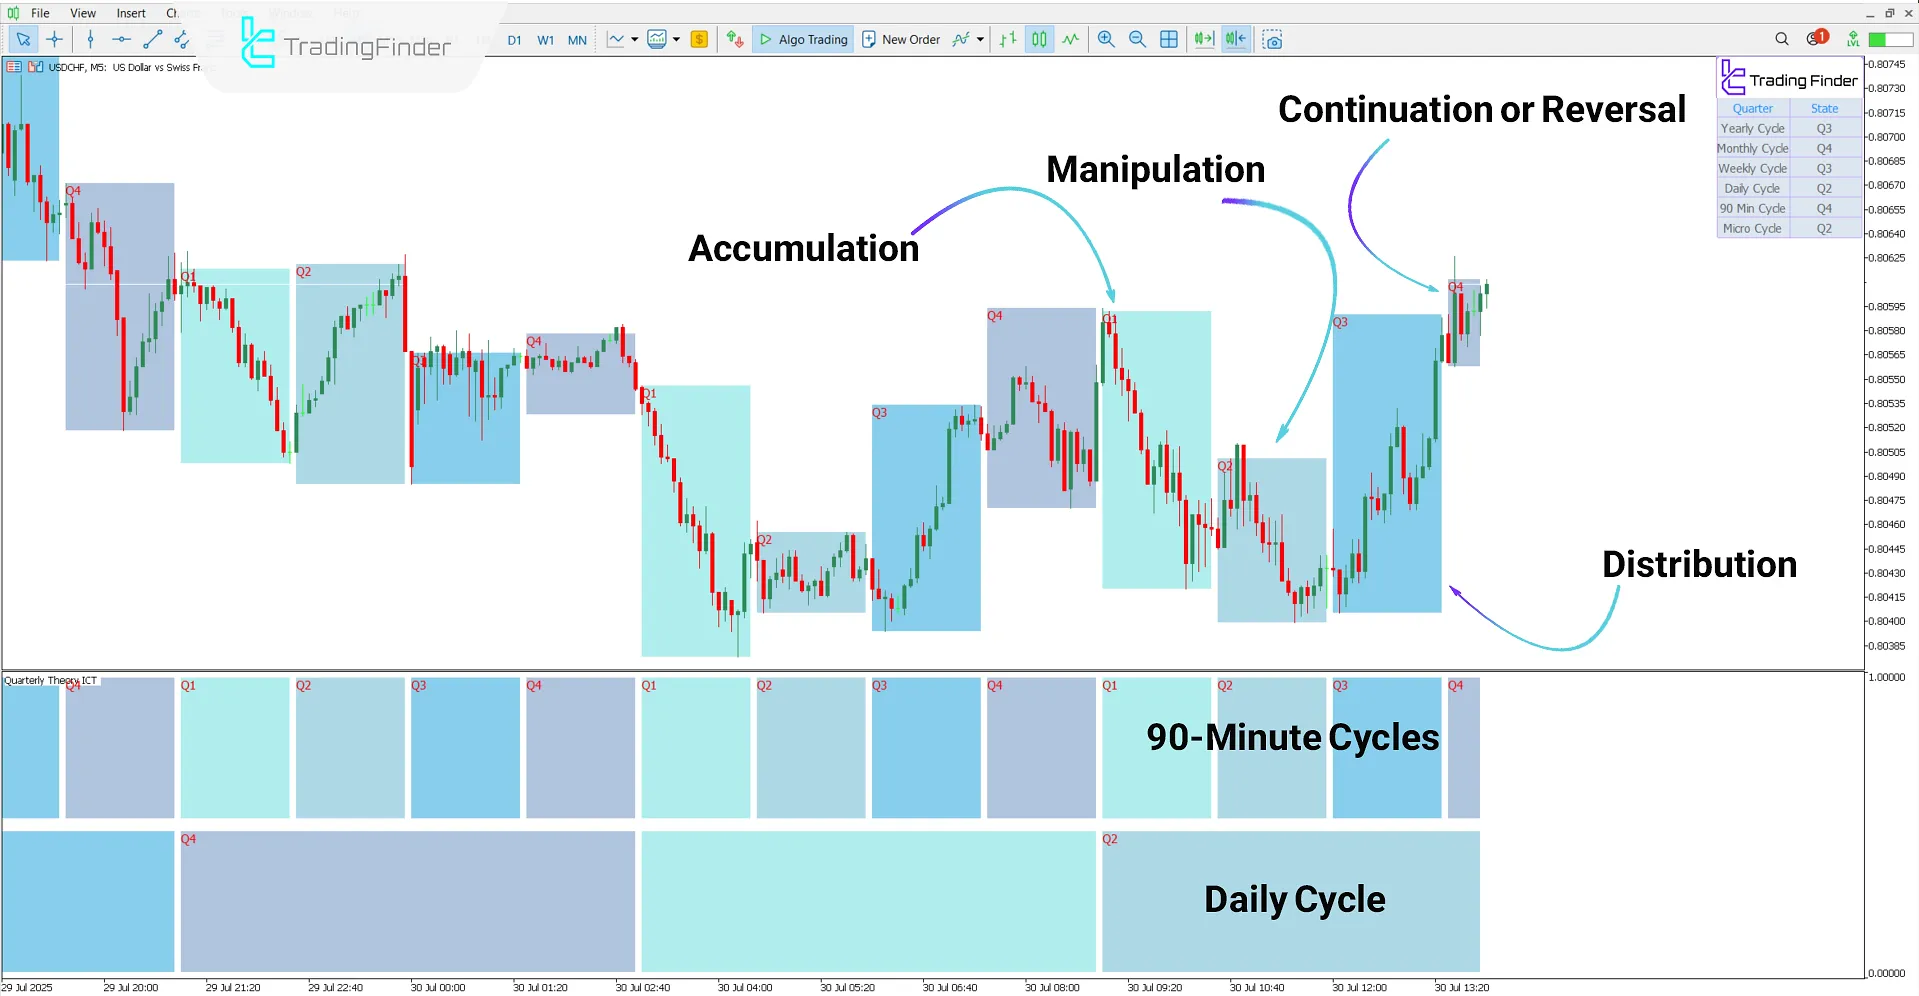
Based on the USD/CHF chart in the 5-minute timeframe, the Quarterly Theory ICT 01 Indicator, according to the chosen settings, has segmented the time cycles on the chart.
As shown, the price movement began from the accumulation phase, then absorbed liquidity through a deceptive move in the manipulation phase.
After that, the price entered the distribution phase and experienced significant growth.

Bearish Trend
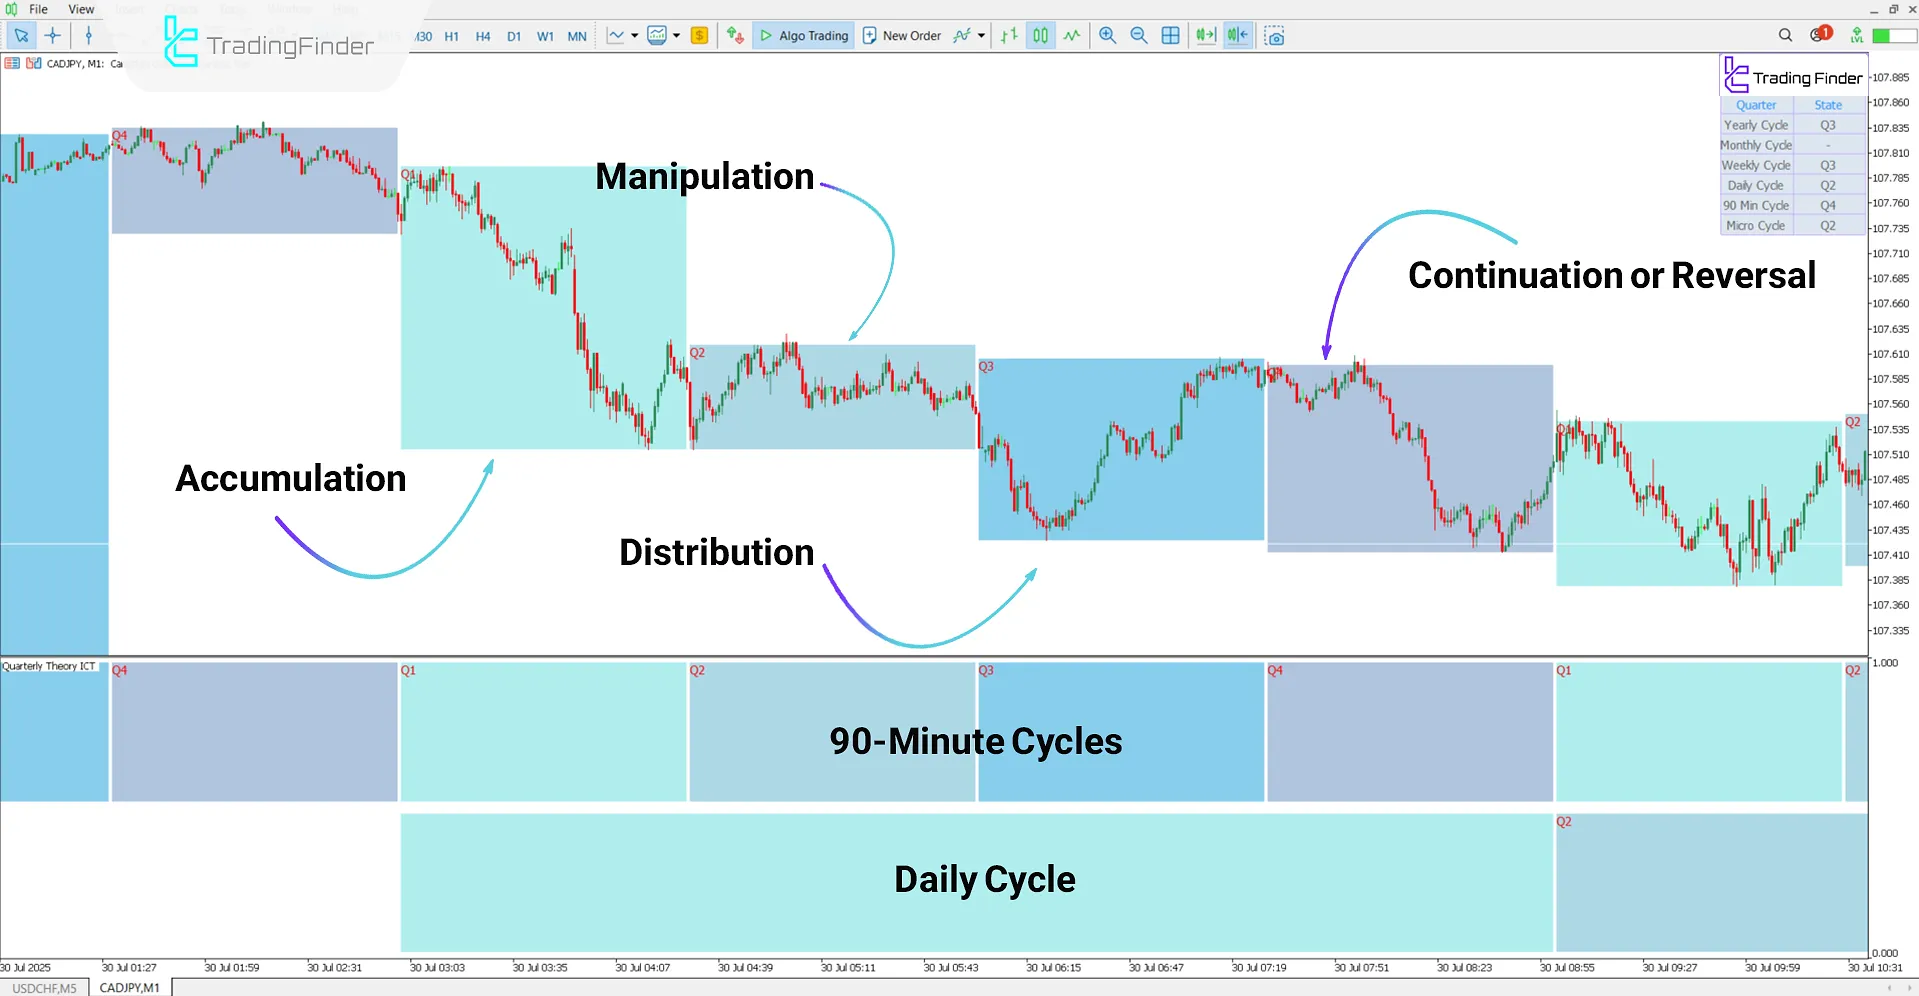
The CAD/JPY chart in the 1-minute timeframe demonstrates the indicator’s performance in a bearish market trend.
As seen in the chart, the four consecutive cycles have appeared sequentially, and the price reacted in line with each phase’s characteristics.

Quarterly Theory ICT 01 Indicator Settings
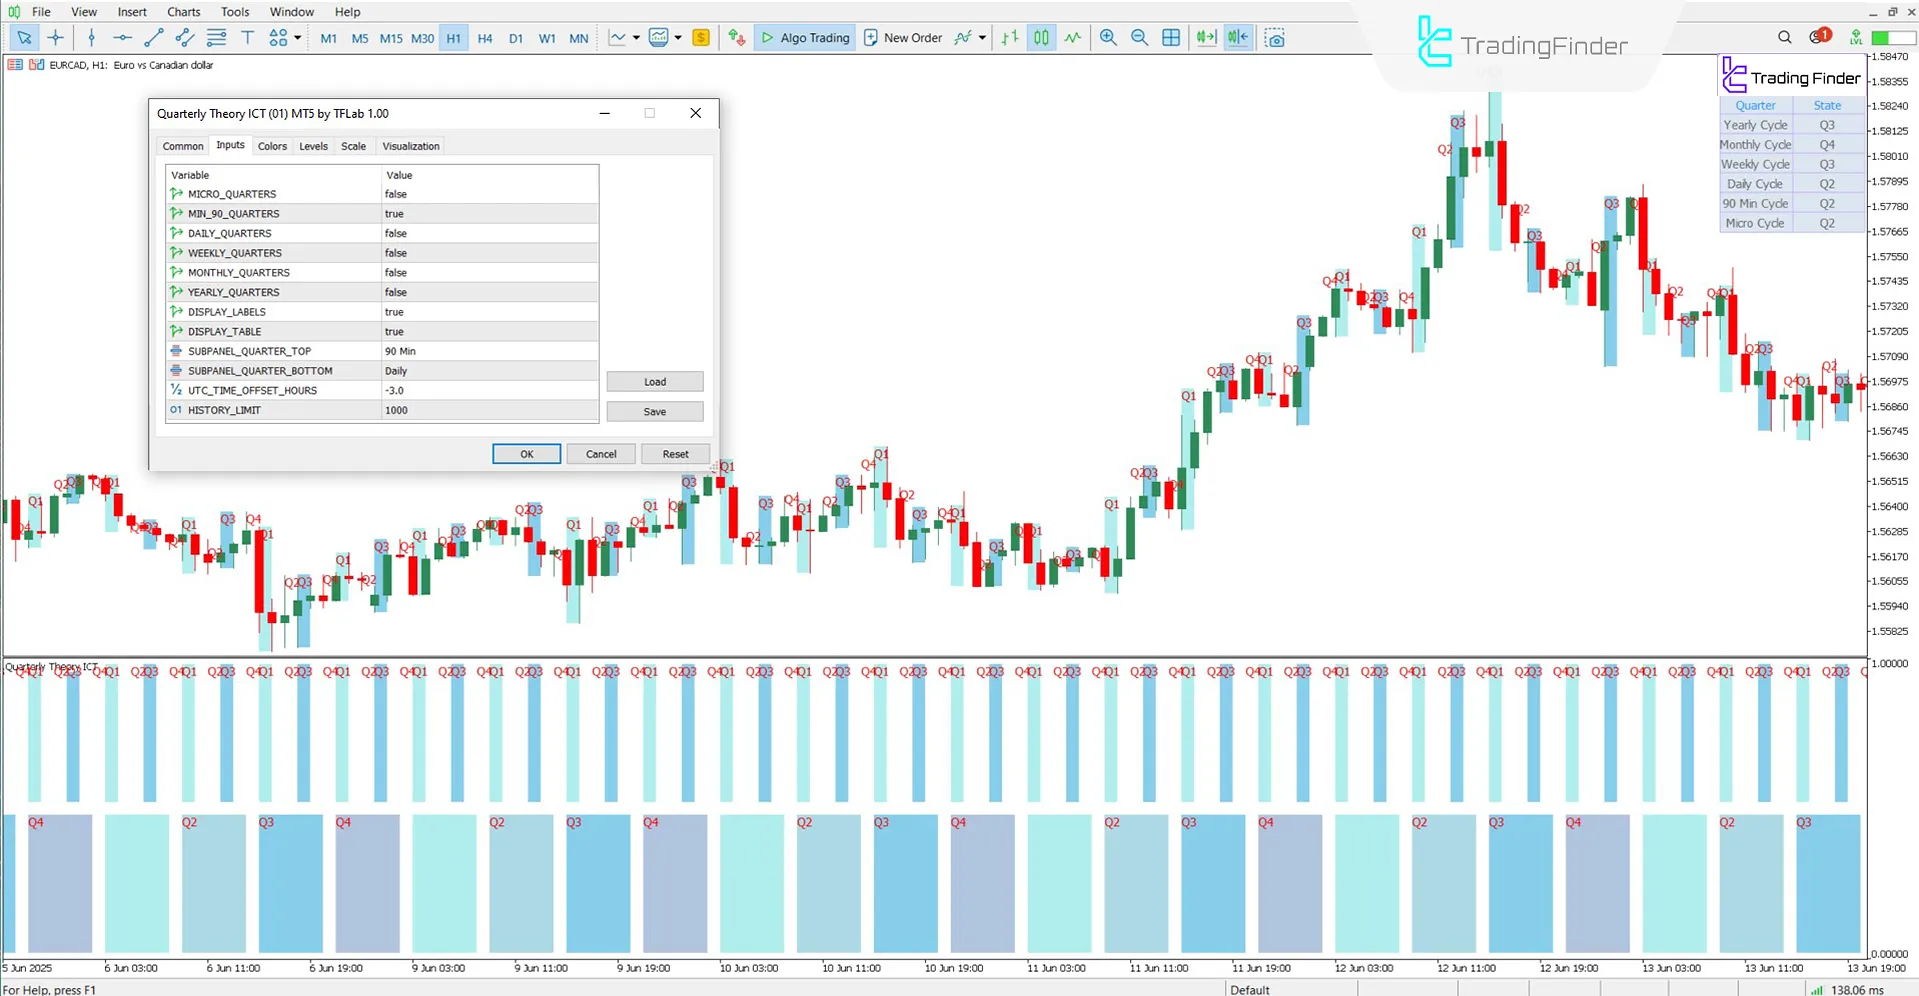
The settings of the Quarterly Theory ICT 01 Indicator are as follows:

- MICRO_QUARTERS: Micro cycles visibility
- MIN_90_QUARTERS: 90-minute cycles activation
- DAILY_QUARTERS: Daily cycles activation
- WEEKLY_QUARTERS: Weekly cycles visibility
- MONTHLY_QUARTERS: Monthly cycles visibility
- YEARLY_QUARTERS: Yearly cycles display
- DISPLAY_LABELS: Q1–Q4 phase labels on chart
- DISPLAY_TABLE: Time phase table in right panel
- SUBPANEL_QUARTER_TOP: Upper cycle timeframe in subpanel below the chart
- SUBPANEL_QUARTER_BOTTOM: Lower cycle timeframe in subpanel below chart
- UTC_TIME_OFFSET_HOURS: Time difference from UTC
- HISTORY_LIMIT: Limit of past candles for calculations
Conclusion
The Quarterly Theory ICT 01 Indicator enables structured price behavior analysis by dividing time into four consecutive phases (Accumulation, Manipulation, Distribution, Continuation, or Reversal).
This trading tool is applicable across various timeframes [from 90 minutes to long-term, such as monthly and yearly] and facilitates the identification of market entry and exit points.
Quarterly Theory ICT 01 Indicator MT5 PDF
Quarterly Theory ICT 01 Indicator MT5 PDF
Click to download Quarterly Theory ICT 01 Indicator MT5 PDFWhat is the purpose of time segmentation in the Quarterly Theory ICT 01 Indicator?
The main goal of this indicator is to identify repetitive price structures.
Is this indicator suitable for short-term trading?
Yes, the Quarterly Theory ICT 01 Indicator performs accurately in scalping and short-term analysis within 15- and 90-minute timeframes.


