


![Quarterly Theory ICT 03 Indicator for MT5 Download – Free – [TradingFinder]](https://cdn.tradingfinder.com/image/490334/13-186-en-quarterly-theory-ict-03-precision-swing-points-mt5-01.webp)
![Quarterly Theory ICT 03 Indicator for MT5 Download – Free – [TradingFinder] 1](https://cdn.tradingfinder.com/image/579909/13-186-en-quarterly-theory-ict-03-precision-swing-points-mt5-02.webp)
![Quarterly Theory ICT 03 Indicator for MT5 Download – Free – [TradingFinder] 2](https://cdn.tradingfinder.com/image/579910/13-186-en-quarterly-theory-ict-03-precision-swing-points-mt5-03.webp)
![Quarterly Theory ICT 03 Indicator for MT5 Download – Free – [TradingFinder] 3](https://cdn.tradingfinder.com/image/490335/13-186-en-quarterly-theory-ict-03-precision-swing-points-mt5-04.webp)
The Quarterly Theory ICT 03 Indicator is designed based on the ICT trading style and issues trading signals using the Precision Swing Points pattern.
This indicator analyzes the closing of candles between two or three correlated symbols, detects directional differences between them, and highlights strengths or weaknesses in the current market trend.
It also includes a real-time table that displays the divergence or convergence status between selected symbols.
Specifications Table of Quarterly Theory ICT 03 Indicator
The specifications of the Quarterly Theory ICT 03 Precision Swing Points Indicator are as follows.
Indicator Categories: | Pivot Points & Fractals MT5 Indicators Signal & Forecast MT5 Indicators ICT MT5 Indicators |
Platforms: | MetaTrader 5 Indicators |
Trading Skills: | Advanced |
Indicator Types: | Reversal MT5 Indicators |
Timeframe: | Multi-Timeframe MT5 Indicators |
Trading Style: | Swing Trading MT5 Indicators Scalper MT5 Indicators Day Trading MT5 Indicators |
Trading Instruments: | Forex MT5 Indicators Crypto MT5 Indicators Stock MT5 Indicators |
Quarterly Theory ICT 03 Indicator at a Glance
The Precision Swing Point pattern consists of three consecutive candles, with the main focus on the middle candle.
When the middle candle in the main symbol closes bearishly, but simultaneously the candle in the correlated symbol is bullish, this mismatch indicates a positive divergence, and a buy signal is issued.
Conversely, if the middle candle is bullish in the base symbol and bearish in the correlated one, a negative divergence is identified, prompting the indicator to issue a sell signal.
Buy Signal
In the chart below, the currency pair "EUR/USD" is considered as the main symbol, while "AUD/USD" is taken as the correlated symbol.
According to the chart, "EUR/USD" has formed a bullish structure, whereas "AUD/USD" has developed a bearish pattern.
This behavioral contrast between the two assets indicates a positive divergence, and the indicator, by identifying it, has generated a buy signal on the "EUR/USD" chart.
Sell Signal
In the following example, the currency pair "EUR/USD" is selected as the base symbol, and "US500" as the correlated symbol.
In the upper chart, a precise bearish pivot pattern has formed, while in the lower chart, a bullish pattern has appeared.
This contrast in candlestick behavior between the two symbols indicates a negative divergence; consequently, the indicator detects this divergence and issues a sell signal based on the weakening bullish trend.
Settings of the Quarterly Theory ICT 03 Precision Swing Points Indicator
The settings of the Quarterly Theory ICT 03 Indicator are based on the image below:
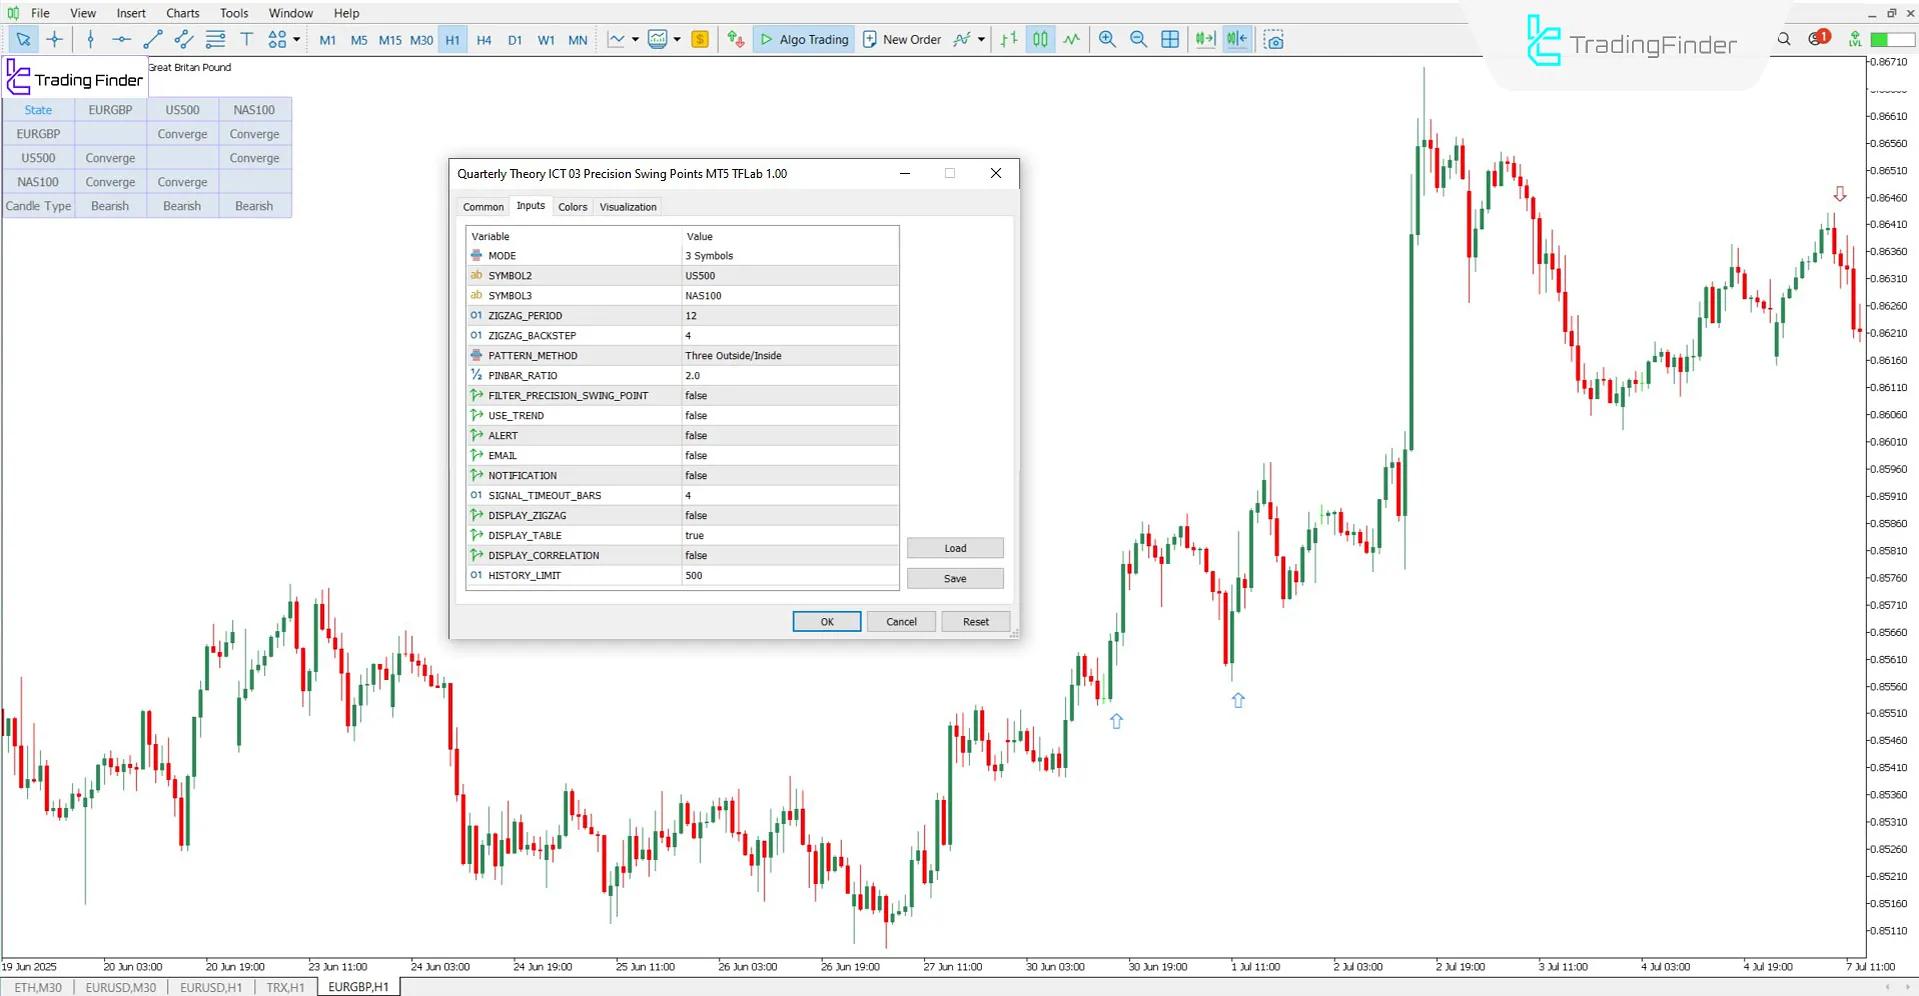
- MODE: Asset comparison mode (two symbols or three symbols);
- SYMBOL2: Select the second symbol;
- SYMBOL3: Select the third symbol;
- ZIGZAG_PERIOD: Calculation period for ZigZag line;
- ZIGZAG_BACKSTEP: Minimum number of candles between ZigZag turning points;
- PATTERN_METHOD: Defines the candlestick pattern structure type;
- PINBAR_RATIO: Threshold ratio for detecting a valid pin bar;
- FILTER_PRECISION_SWING_POINT: Enable filter to show only precise patterns;
- USE_TREND: Trend direction filter to show signals only in the main trend direction;
- ALERT: Enable alert;
- EMAIL: Send signals via email;
- NOTIFICATION: Enable notification sending;
- SIGNAL_TIMEOUT_BARS: Duration the signal remains on the chart;
- DISPLAY_ZIGZAG: Show or hide ZigZag structure on the chart;
- DISPLAY_TABLE: Show or hide divergence and candle status table;
- DISPLAY_CORRELATION: Display correlation info between symbols in the table;
- HISTORY_LIMIT: Number of past candles to load and analyze.
Conclusion
The Quarterly Theory ICT 03 Indicator is a powerful tool for detecting market turning points based on divergence between two or three correlated symbols.
This indicator uses the three-candle Precision Swing Points pattern and issues a buy or sell signal on the fourth candle after the third one closes.
Additionally, a visual table on the chart provides real-time status of divergence and candlestick types.
Quarterly Theory ICT 03 Indicator MT5 PDF
Quarterly Theory ICT 03 Indicator MT5 PDF
Click to download Quarterly Theory ICT 03 Indicator MT5 PDFIs this indicator limited to Forex markets only?
No, the Quarterly Theory ICT 03 Indicator can be used across all markets.
Is this tool suitable for lower timeframes?
Yes, the Quarterly Theory ICT 03 Indicator can be applied to all timeframes.


