![Quasi Volume Bars Indicator for MetaTrader 5 Download – Free – [TradingFinder]](https://cdn.tradingfinder.com/image/349136/13-106-en-quasi-volume-bars-mt5-01.webp)
![Quasi Volume Bars Indicator for MetaTrader 5 Download – Free – [TradingFinder] 0](https://cdn.tradingfinder.com/image/349136/13-106-en-quasi-volume-bars-mt5-01.webp)
![Quasi Volume Bars Indicator for MetaTrader 5 Download – Free – [TradingFinder] 1](https://cdn.tradingfinder.com/image/349143/13-106-en-quasi-volume-bars-mt5-02.webp)
![Quasi Volume Bars Indicator for MetaTrader 5 Download – Free – [TradingFinder] 2](https://cdn.tradingfinder.com/image/349149/13-106-en-quasi-volume-bars-mt5-03.webp)
![Quasi Volume Bars Indicator for MetaTrader 5 Download – Free – [TradingFinder] 3](https://cdn.tradingfinder.com/image/349148/13-106-en-quasi-volume-bars-mt5-04.webp)
The Quasi Volume Bars Indicator, based on the selected time frame and period, visually plots market volume data. This trading tool uses colored and distinct bars to display approximately fixed volume across different time intervals.
As a modern indicator in technical analysis, it enables better insight and interpretation of volume behavior in Forex, cryptocurrency, stock, and commodity markets.
Specifications of the Quasi Volume Bars Indicator
The table below outlines the features of the "Quasi Volume Bars" Indicator:
Indicator Categories: | Volume MT5 Indicators Currency Strength MT5 Indicators Trading Assist MT5 Indicators |
Platforms: | MetaTrader 5 Indicators |
Trading Skills: | Intermediate |
Indicator Types: | Reversal MT5 Indicators |
Timeframe: | Multi-Timeframe MT5 Indicators |
Trading Style: | Swing Trading MT5 Indicators Intraday MT5 Indicators Scalper MT5 Indicators Day Trading MT5 Indicators |
Trading Instruments: | Forex MT5 Indicators Crypto MT5 Indicators Stock MT5 Indicators Commodity MT5 Indicators Indices MT5 Indicators Forward MT5 Indicators Share Stock MT5 Indicators |
Quasi Volume Bars Indicator at a Glance
The Quasi Volume Bars Indicator allows users to customize the calculation range as desired (weekly, monthly, or yearly).
This MetaTrader 5 volume analysis tool uses blue bars to clearly and precisely depict market behavior.
Uptrend Conditions
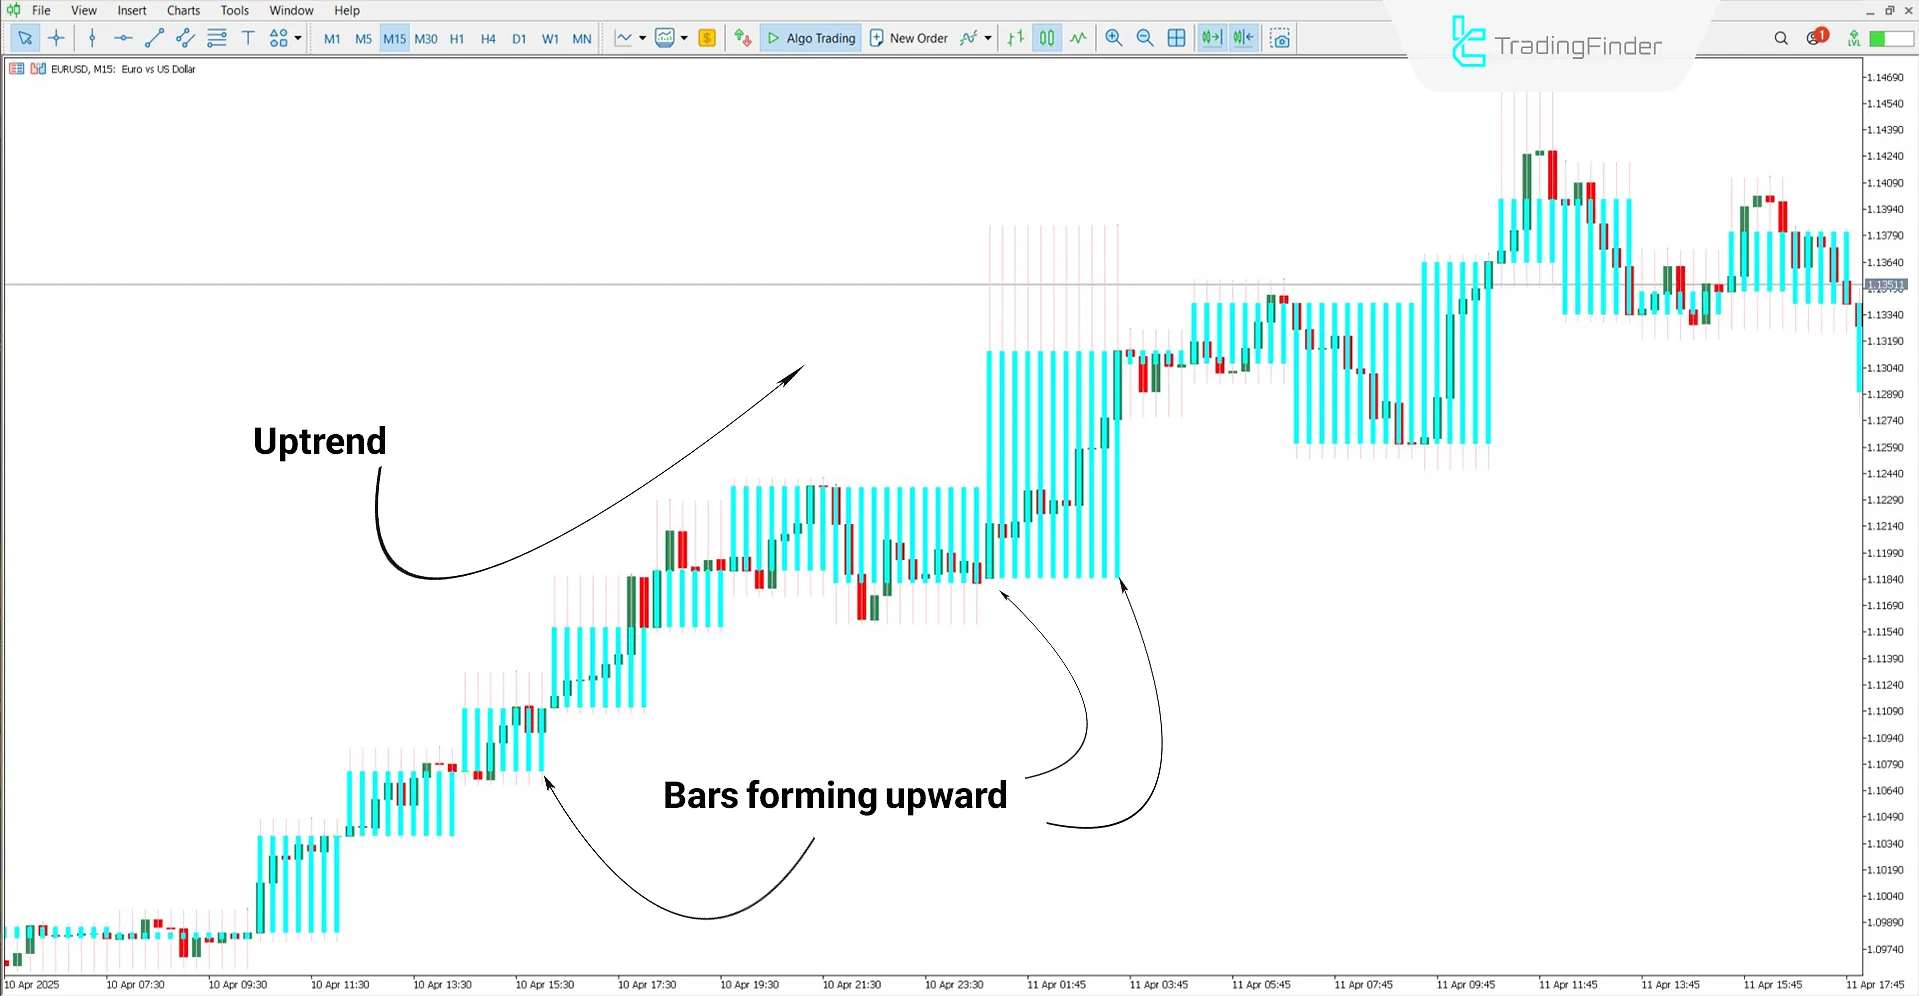
An analysis of the EUR/USD currency pair on a 15-minute timeframe clearly demonstrates the Quasi Volume Bars Indicator in an uptrend. According to the chart, the indicator calculates trading volume from input data and draws upward blue bars.
The repeated appearance of these bars with significant height indicates the strength of the uptrend.

Downtrend Conditions
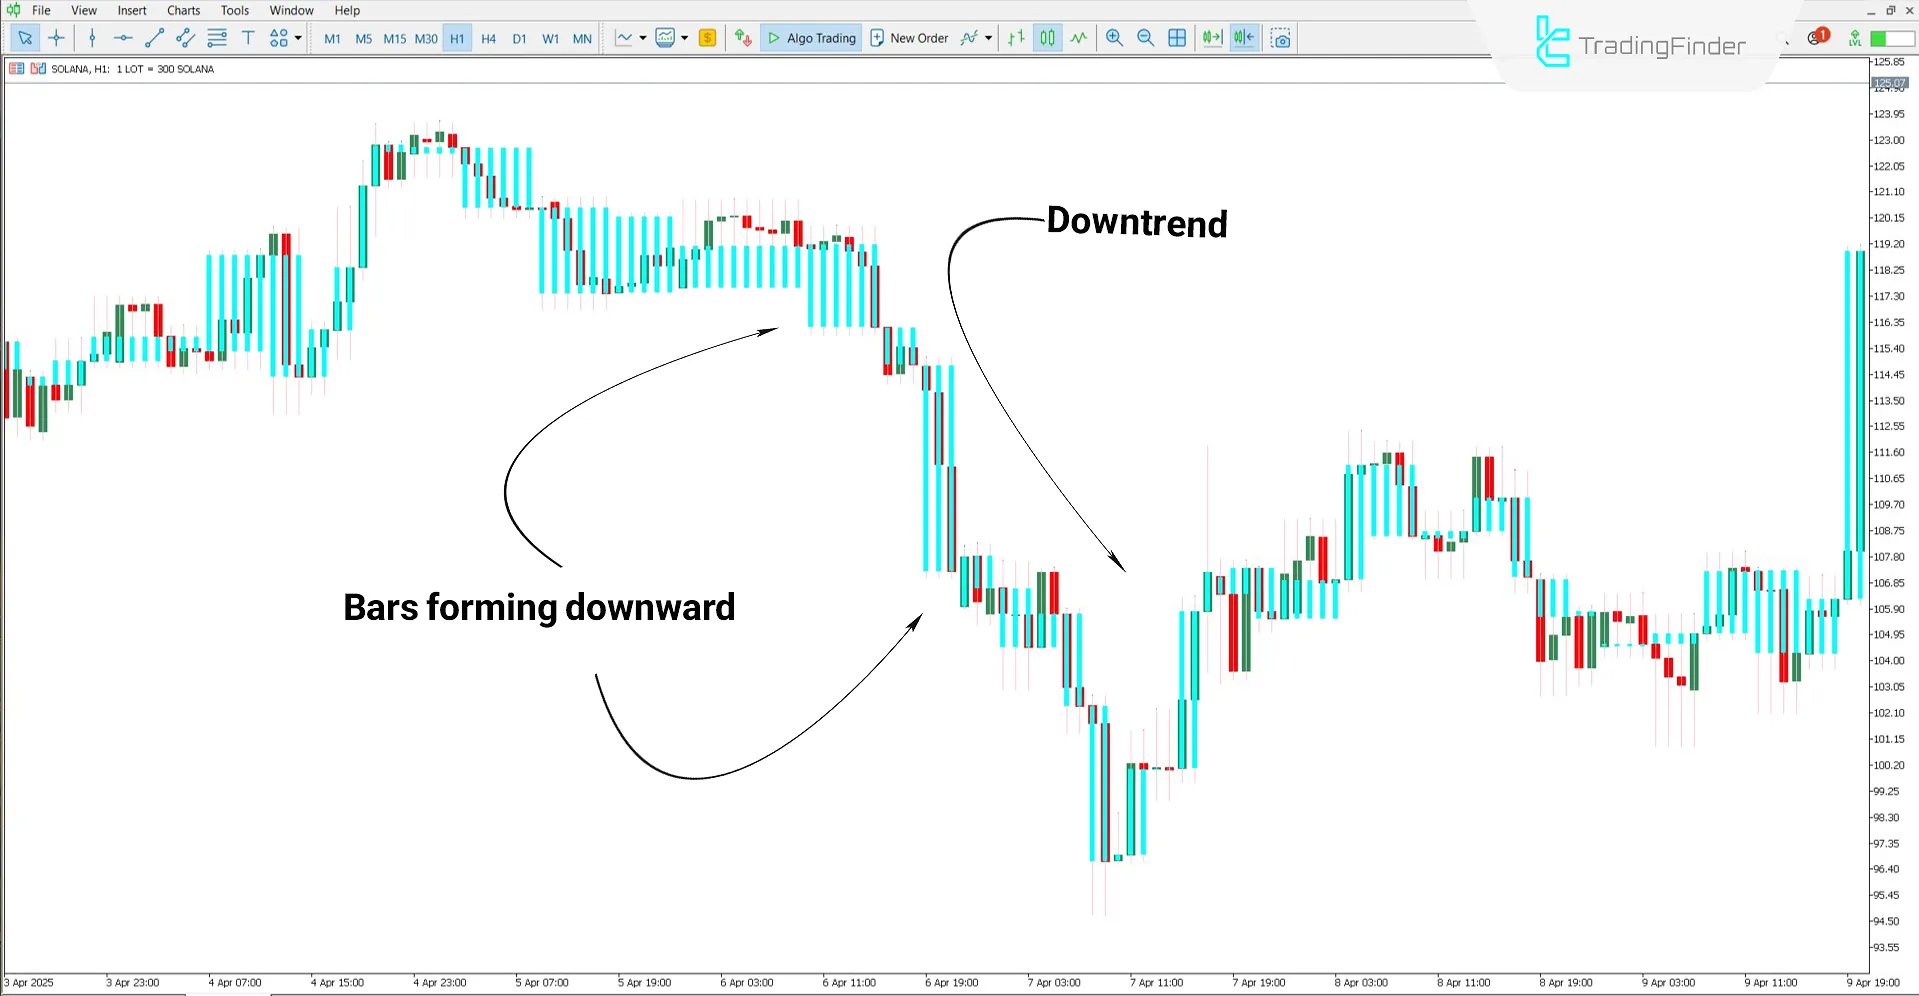
According to the analysis of Solana's (SOL) one-hour chart, consecutive downward blue bars with significant volume signal a strengthening downtrend.
Considering the increased selling volume, traders can evaluate Sell positions with greater confidence within their trading strategies in such conditions.

Settings of the Quasi Volume Bars Indicator
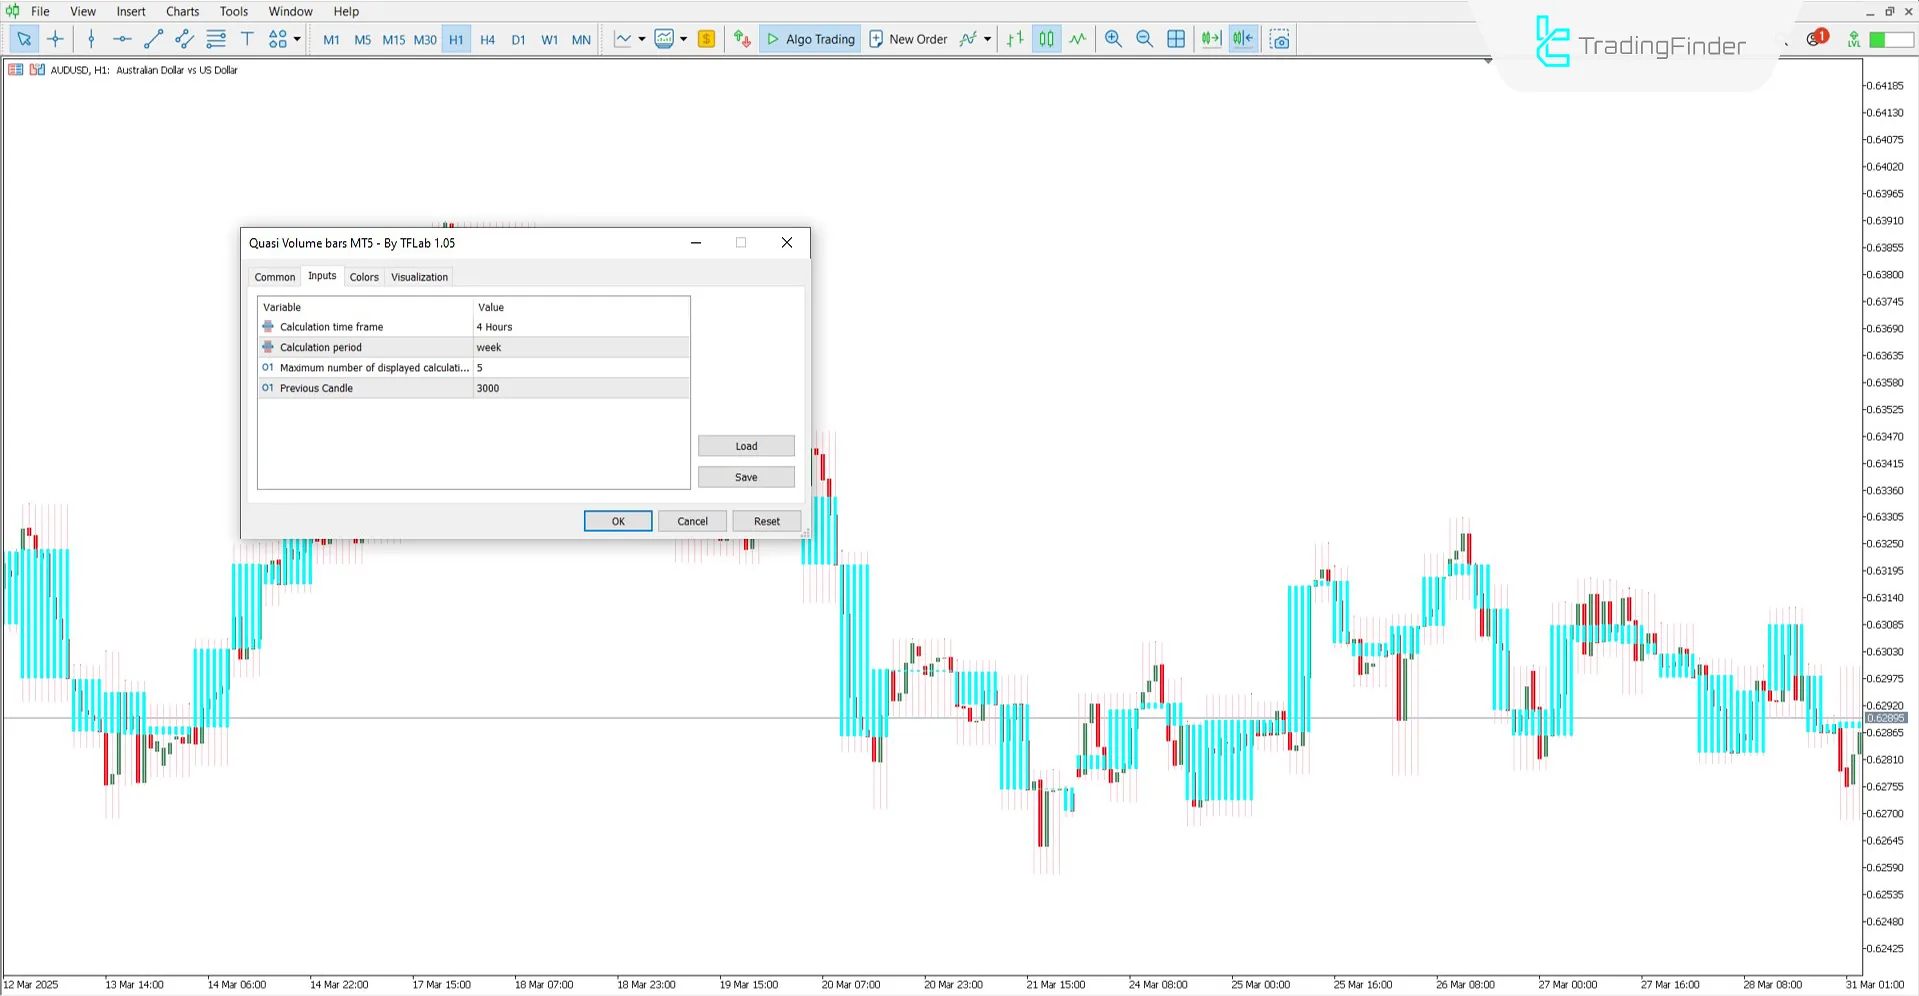
The image below displays the customizable settings of the Quasi Volume Bars Indicator:

- Calculation Time Frame: Defines the time frame for volume calculations
- Calculation Period: Sets the period for indicator computations
- Maximum Number of Displayed Calculation Periods: Determines the number of candles used for volume bars calculation
- Previous Candle: Uses the previous candle as a basis for volume calculation
Conclusion
The Quasi Volume Bars Indicator focuses on clear and effective volume display and provides a transparent view of market trend direction. This MetaTrader 5 volume determination indicator can be a strong confirmation signal for entering Buy or Sell positions.
Its customizable time frame and calculationperiod make it a flexible and compatible tool for various trading strategies.
Quasi Volume Bars MT5 PDF
Quasi Volume Bars MT5 PDF
Click to download Quasi Volume Bars MT5 PDFWhat is the "Quasi Volume Bars" Indicator?
This indicator displays trading volume using colored bars with approximately equal volume over specified intervals.
Is the Quasi Volume Bars Indicator suitable for the stock market?
Yes, this indicator suits all markets, including cryptocurrency, Forex, stocks, and more.


