![Rainbow Multi Moving Average Indicator MT5 Download – Free – [TradingFinder]](https://cdn.tradingfinder.com/image/458855/13-164-en-rainbow-mma-mt5-01.webp)
![Rainbow Multi Moving Average Indicator MT5 Download – Free – [TradingFinder] 0](https://cdn.tradingfinder.com/image/458855/13-164-en-rainbow-mma-mt5-01.webp)
![Rainbow Multi Moving Average Indicator MT5 Download – Free – [TradingFinder] 1](https://cdn.tradingfinder.com/image/454855/13-163-en-rainbow-mma-mt5-02.webp)
![Rainbow Multi Moving Average Indicator MT5 Download – Free – [TradingFinder] 2](https://cdn.tradingfinder.com/image/454874/13-163-en-rainbow-mma-mt5-03.webp)
![Rainbow Multi Moving Average Indicator MT5 Download – Free – [TradingFinder] 3](https://cdn.tradingfinder.com/image/458866/13-164-en-rainbow-mma-mt5-04.webp)
The Rainbow Multi Moving Average Indicator, using 66moving averages with various time periods, provides a clear image of trend behavior.
The indicator lines are drawn in different colors, forming a rainbow like spectrum on the chart. The main function of this tool is to simplify the identification of the main market direction and assist in visually analyzing price movement trends.
Rainbow MMA Indicator Specifications Table
The specifications of the Rainbow Multi Moving Average Indicator are shown in the table below.
Indicator Categories: | Currency Strength MT5 Indicators Trading Assist MT5 Indicators Momentum Indicators in MT5 |
Platforms: | MetaTrader 5 Indicators |
Trading Skills: | Elementary |
Indicator Types: | Reversal MT5 Indicators |
Timeframe: | Multi-Timeframe MT5 Indicators |
Trading Style: | Swing Trading MT5 Indicators Scalper MT5 Indicators Day Trading MT5 Indicators |
Trading Instruments: | Forex MT5 Indicators Crypto MT5 Indicators Stock MT5 Indicators |
Overview of the Rainbow Multi Moving Average Indicator
In the Rainbow Multi Moving Average Indicator, the overall market direction can be identified by the angle of the moving average lines. When these lines move upward, they indicate an uptrend; conversely, if the slope turns negative, it signals a downward price movement.
Uptrend Conditions
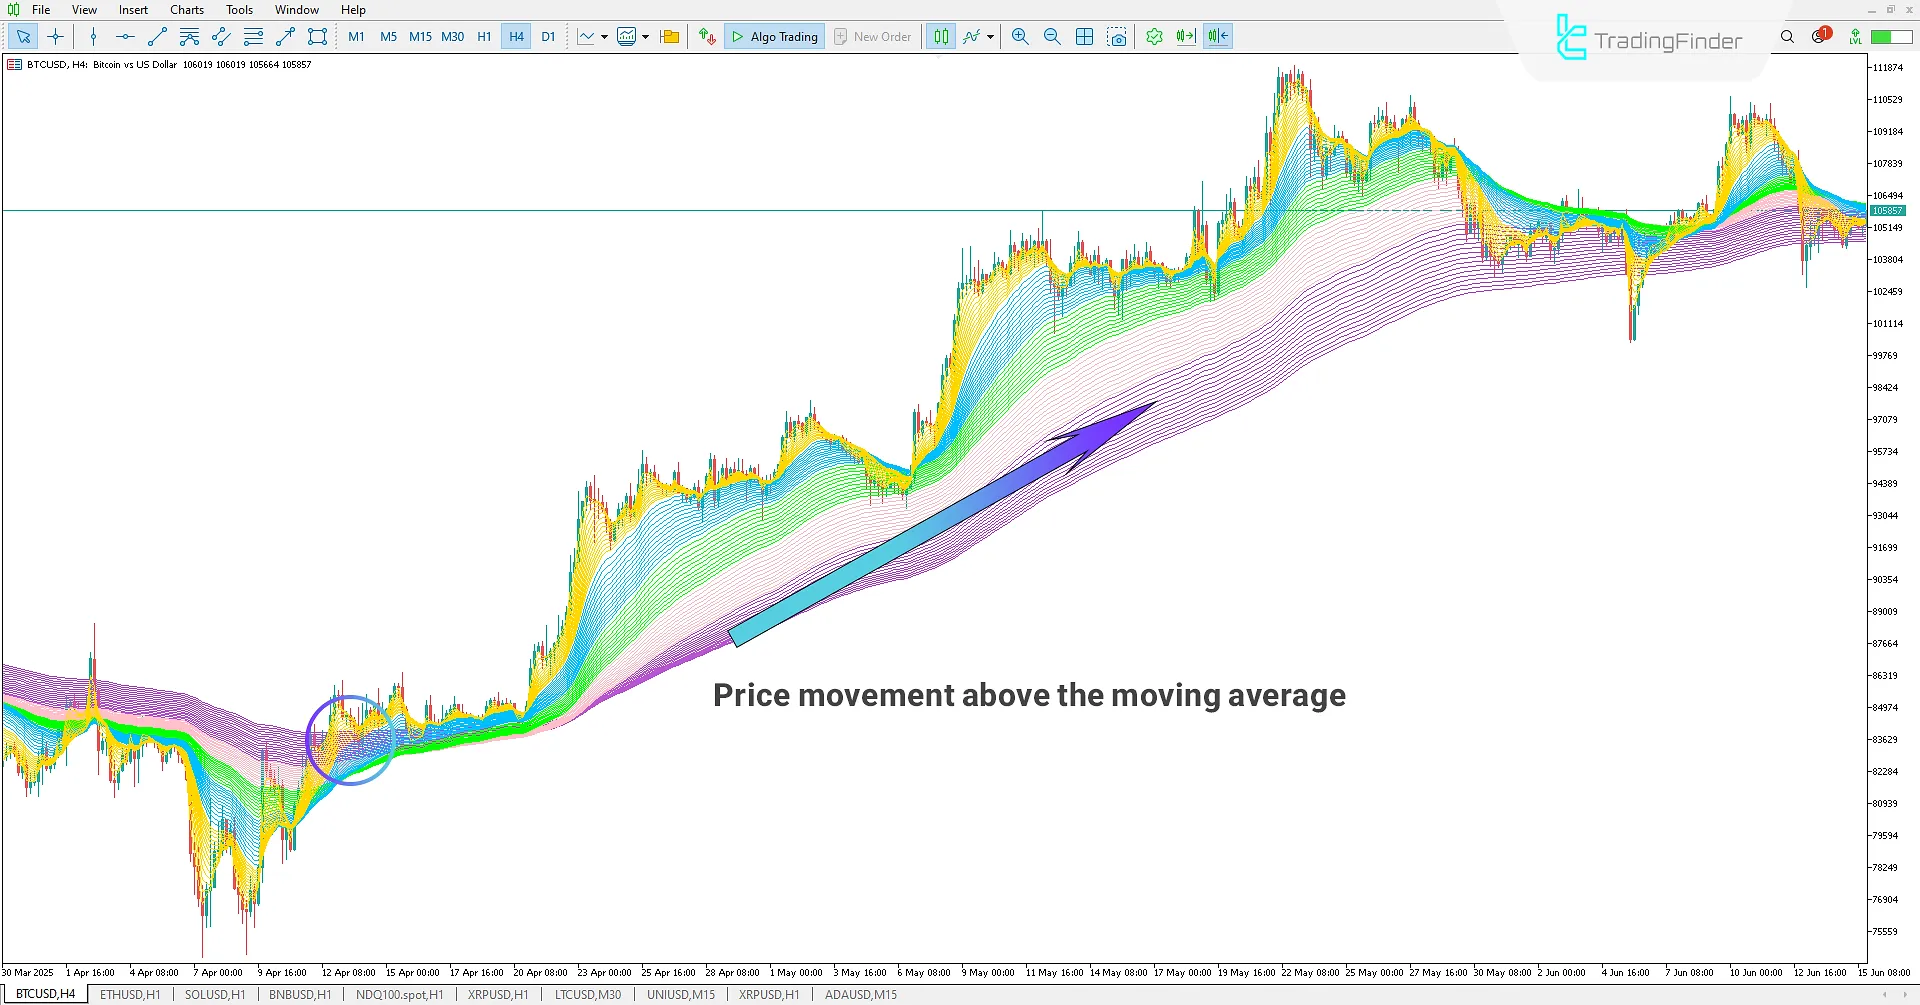
Based on the Bitcoin (BTC) 4-hour chart, the price starts an upward trend after breaking through the compressed zone of moving averages. As the lines gradually open up and consistently move upward, signs of a strong bullish trend appear.

Downtrend Conditions
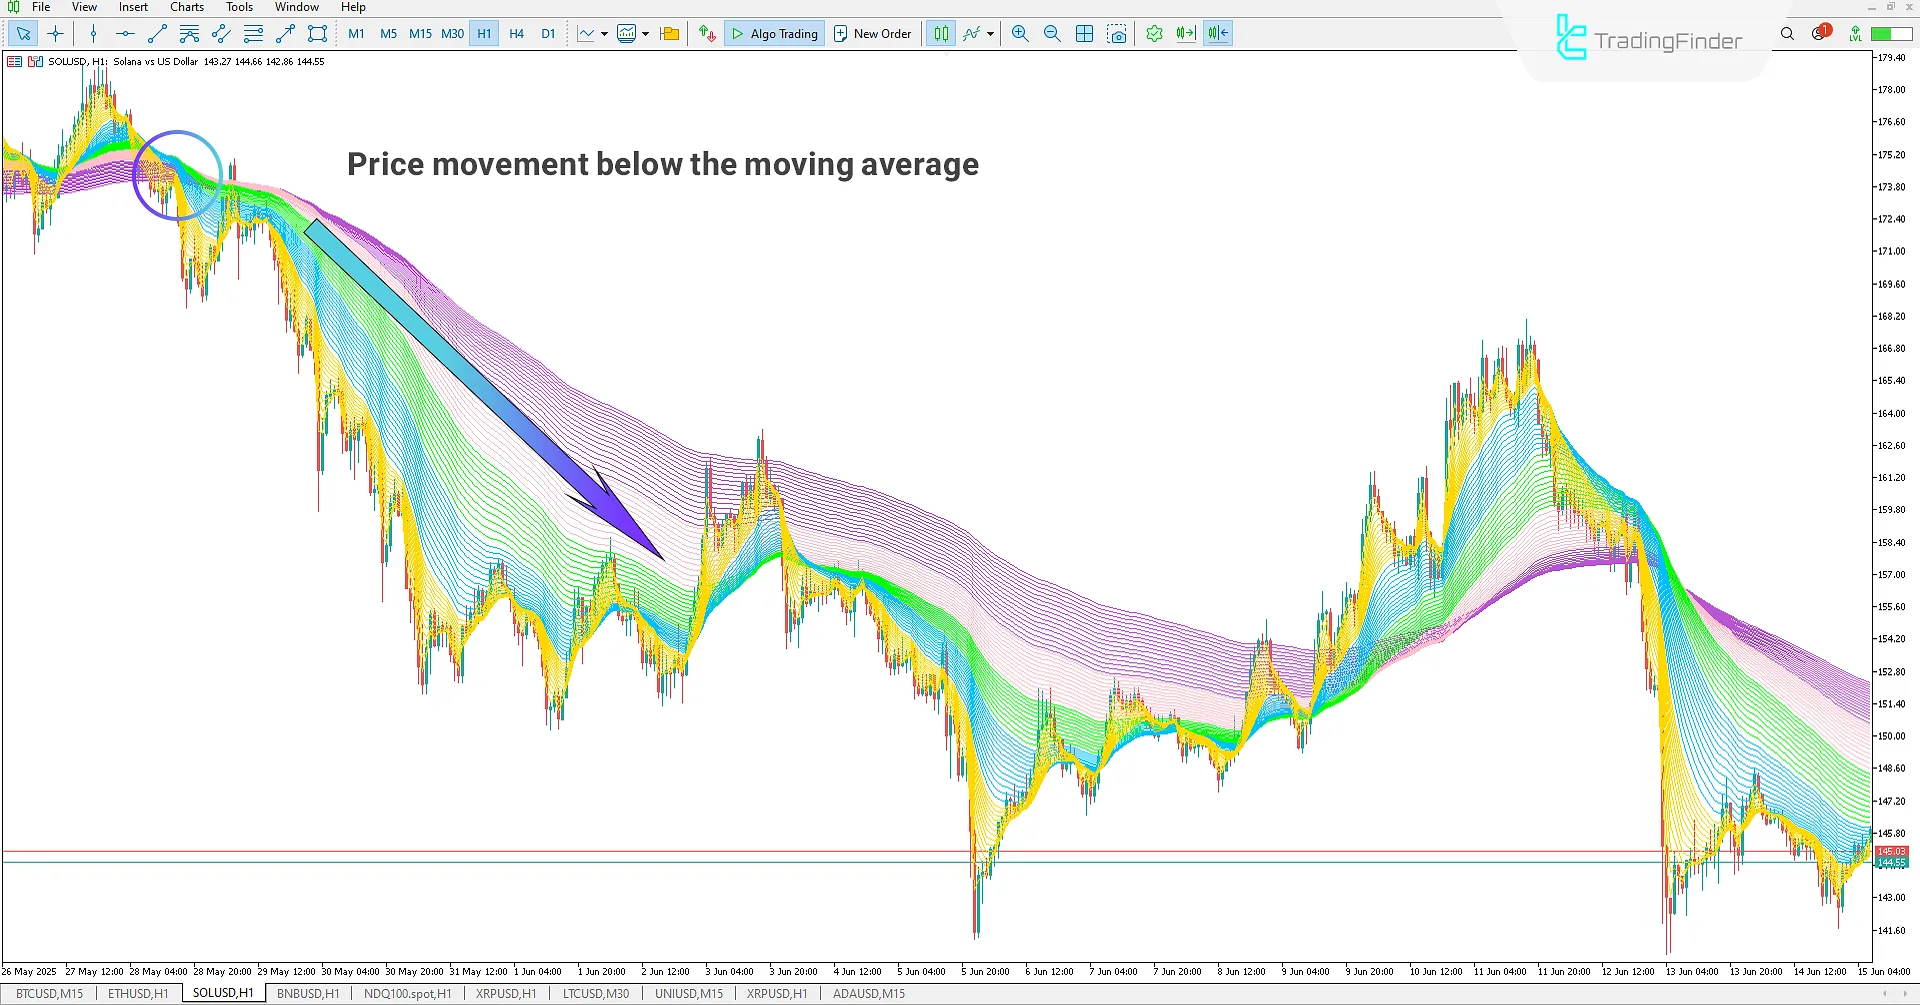
According to the Solana (SOL) 1-hour chart, the price first penetrates below the dense area of moving averages and then gradually passes through them. Following this, the lines start to slope downward, clearly indicating the start of a bearish trend.

Rainbow Multi Moving Average Indicator Settings
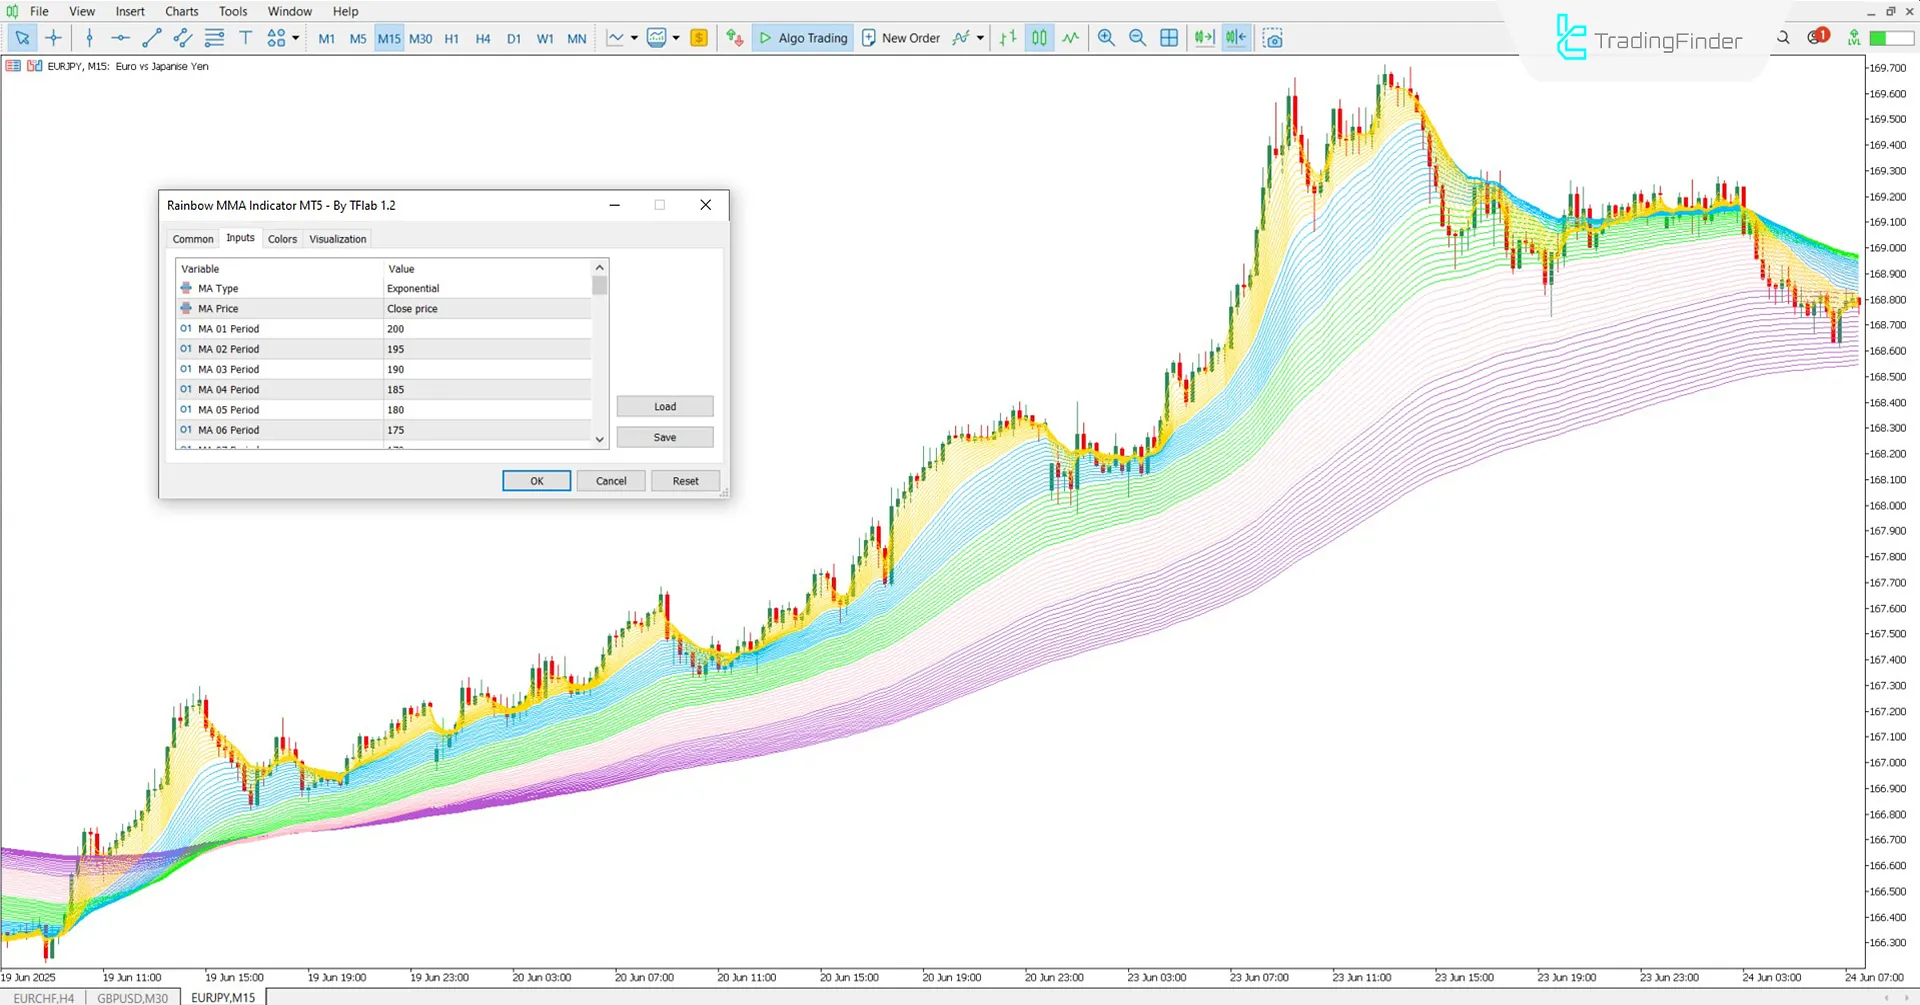
The image below shows the settings panel of the Rainbow MMA Indicator:

- MA Type: Selects the type of moving averages
- MA Price: Sets the base for line calculations
- MA Periods (MA 01 to MA 33): Defines the calculation period for each moving average
Conclusion
The Rainbow Multi Moving Average Indicator, by combining a set of exponential moving averages across various timeframes, creates a layered analytical display on the chart.
The range of these timeframes from long-term to short term improves accuracy in identifying trends and their changes. The organized, angled structure of these lines provides a clear view of momentum,trend direction, and potential turning points.
Additionally, thanks to its flexible design, this indicator delivers reliable performance across various markets, including Forex, Crypto, and Stocks.
Rainbow Multi Moving Average MT5 PDF
Rainbow Multi Moving Average MT5 PDF
Click to download Rainbow Multi Moving Average MT5 PDFIs the Rainbow MMA Indicator limited to cryptocurrency markets?
No; this indicator can be used and applied across all markets.
Can the calculation period of the Rainbow MMA Indicator be customized?
Yes; within the indicator settings, you can modify the calculation periods from MA 1 to MA 66.


