![Range Average Retest Model Indicator MT5 Download – Free – [TradingFinder]](https://cdn.tradingfinder.com/image/628822/13-246-en-range-average-retest-model-mt5-01.webp)
![Range Average Retest Model Indicator MT5 Download – Free – [TradingFinder] 0](https://cdn.tradingfinder.com/image/628822/13-246-en-range-average-retest-model-mt5-01.webp)
![Range Average Retest Model Indicator MT5 Download – Free – [TradingFinder] 1](https://cdn.tradingfinder.com/image/628819/13-246-en-range-average-retest-model-mt5-02.webp)
![Range Average Retest Model Indicator MT5 Download – Free – [TradingFinder] 2](https://cdn.tradingfinder.com/image/628820/13-246-en-range-average-retest-model-mt5-03.webp)
![Range Average Retest Model Indicator MT5 Download – Free – [TradingFinder] 3](https://cdn.tradingfinder.com/image/628823/13-246-en-range-average-retest-model-mt5-04.webp)
The Range Average Retest Model Indicator is designed to analyze price movements within range phases and examine overall market structure.
This trading tool utilizes historical data and swing level detection to identify areas with the highest probability of price reactions either reversals or breakouts.
In addition, the Range Average Retest Model Indicator systematically determines suitable entry and exit points and outlines risk management methods, providing traders with a structured trading framework.
Range Average Retest Model Indicator Specification Table
The specifications of the Range Average Retest Model Indicator are presented in the table below:
Indicator Categories: | Signal & Forecast MT5 Indicators Trading Assist MT5 Indicators |
Platforms: | MetaTrader 5 Indicators |
Trading Skills: | Elementary |
Indicator Types: | Reversal MT5 Indicators |
Timeframe: | Multi-Timeframe MT5 Indicators |
Trading Style: | Swing Trading MT5 Indicators Intraday MT5 Indicators Scalper MT5 Indicators |
Trading Instruments: | Forex MT5 Indicators Crypto MT5 Indicators Stock MT5 Indicators Commodity MT5 Indicators Indices MT5 Indicators Share Stock MT5 Indicators |
Range Average Retest Model Indicator at a Glance
The Range Average Retest Model Indicator first determines the range areas of the market and draws a midline at the center.
Price behavior relative to this line serves as the primary criterion for identifying the current condition and trend of the market.
Based on this structure, the levels related to trade entry, take-profit, and stop-loss are automatically plotted on the chart.
Buy Trade Setup
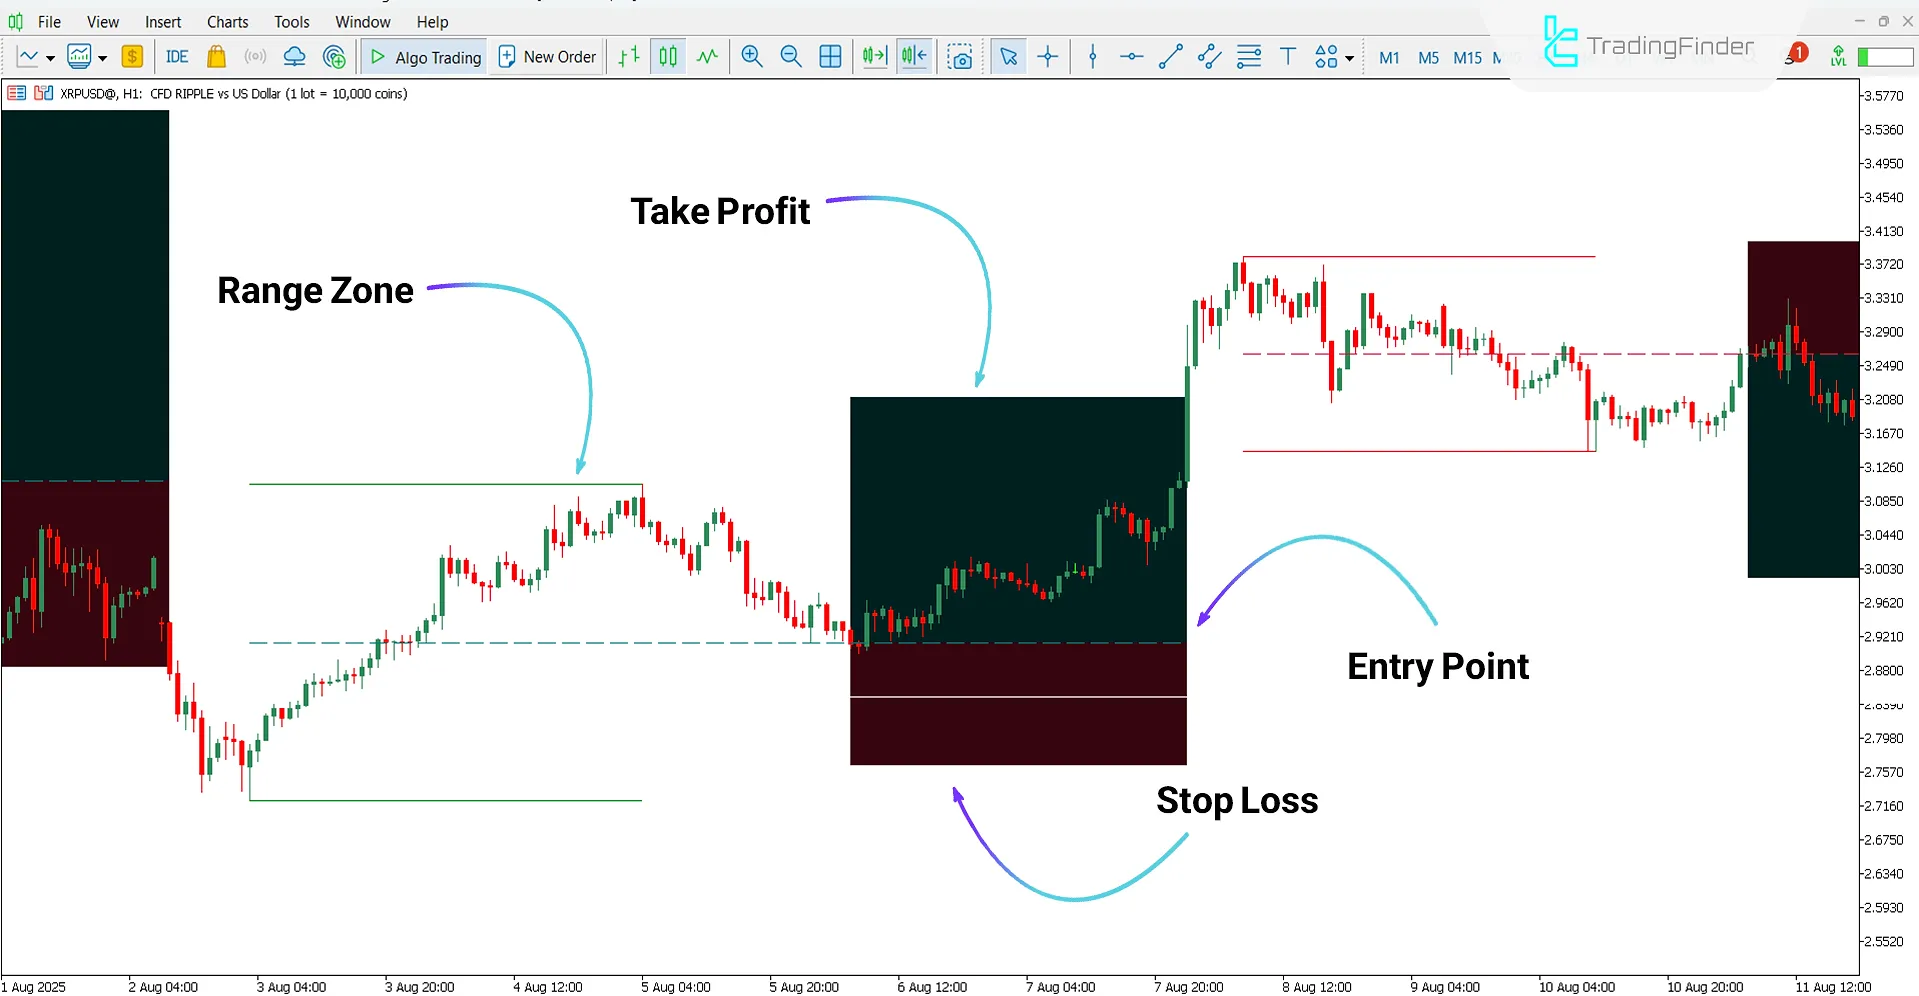
According to the 1-hour chart of Ripple (XRP) cryptocurrency, the indicator first identifies the market range and, by drawing a midline, clearly illustrates the price structure.
In addition, the buytrade setup, along with the defined take-profit and stop-loss levels, is precisely marked on the chart.

Sell Trade Setup
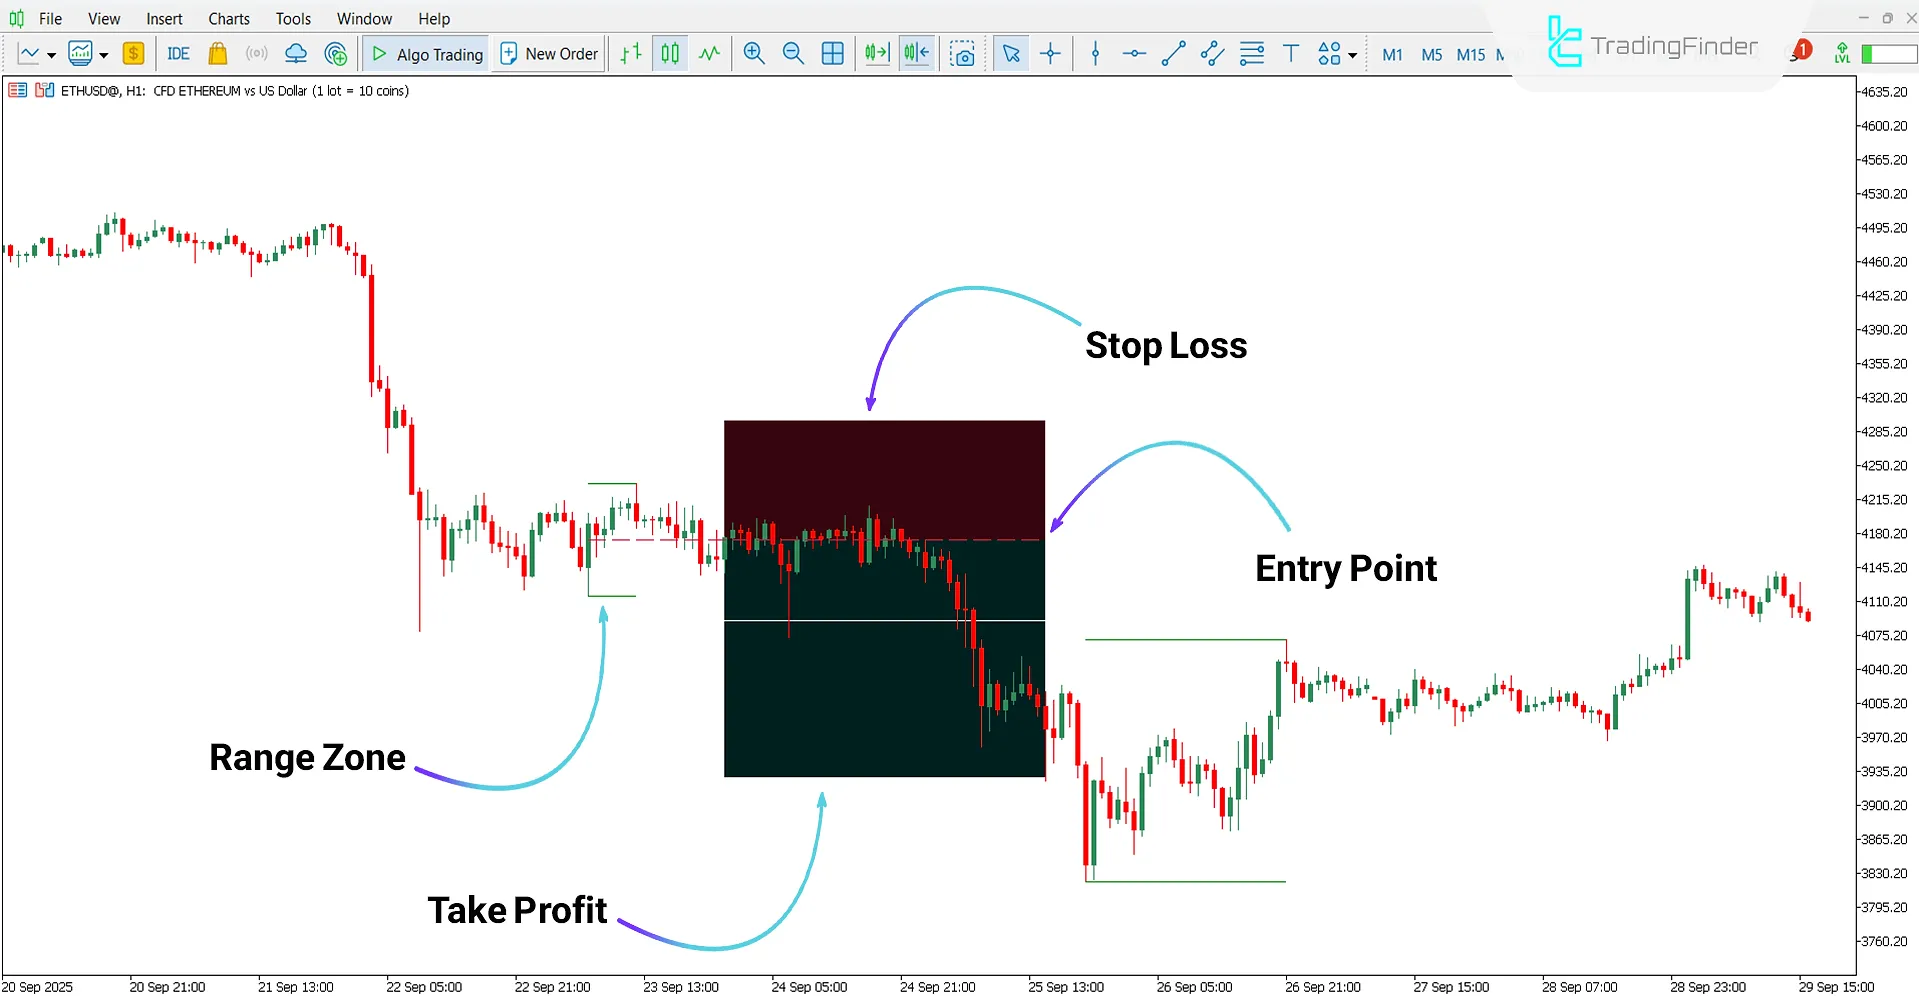
According to the 1-hour Ethereum (ETH) chart, the indicator identifies the range area and draws its midline.
Furthermore, the sell entry point, along with take-profit and stop-loss levels, is displayed as green and red boxes on the chart.

Range Average Retest Model Indicator Settings
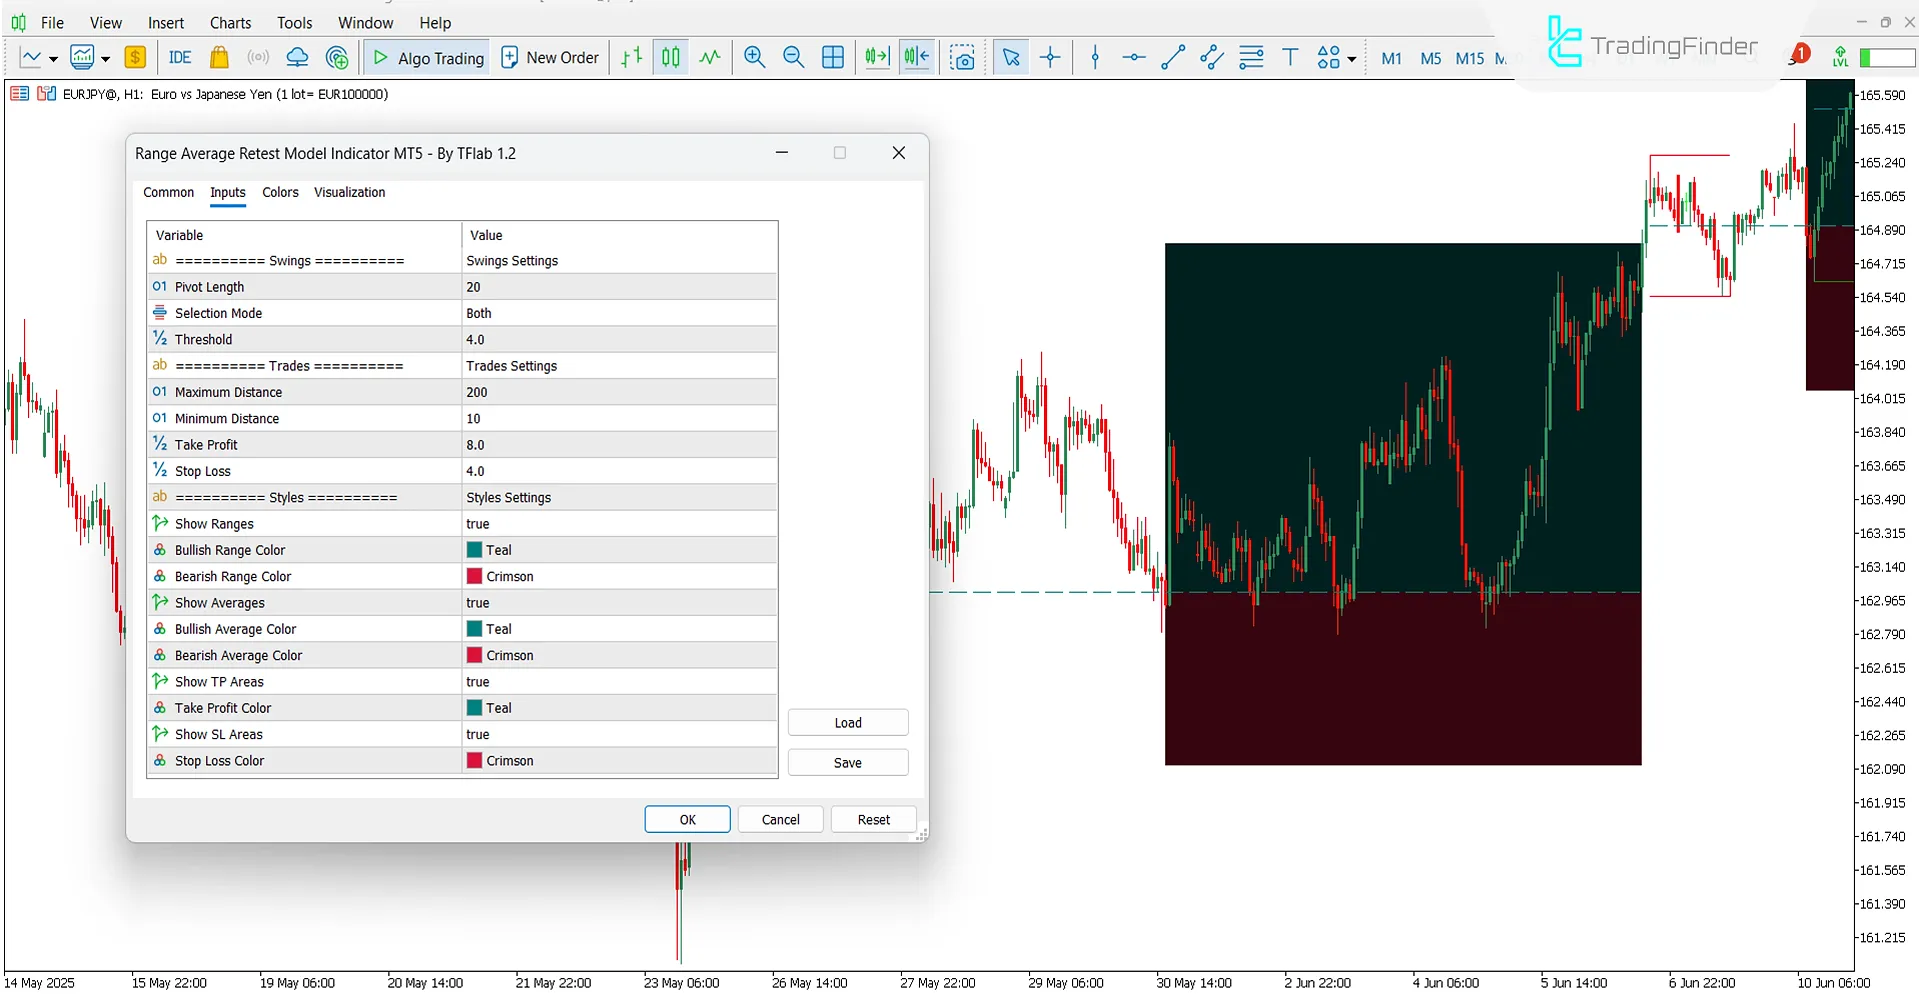
The following image shows the settings section of the Range Average Retest Model Indicator:

Swings Settings
- Pivot Length: Length of pivot
- Selection Mode: Mode for analyzing both market sides
- Threshold: Sensitivity level for detecting key zones
Trades Settings
- Maximum Distance: Maximum distance between entry point and target level
- Minimum Distance: Minimum distance between entry and calculated range
- Take Profit: Level for trade profit exit
- Stop Loss: Level for trade loss exit
Styles Settings
- Show Ranges: Display of market range zones on chart
- Bullish Range Color: Color for bullish zones
- Bearish Range Color: Color for bearish zones
- Show Averages: Display of average lines for bullish and bearish ranges
- Bullish Average Color: Color for bullish averages
- Bearish Average Color: Color for bearish averages
- Show TP Areas: Display of take-profit zones
- Take Profit Color: Color for take-profit areas
- Show SL Areas: Display of stop-loss zones
- Stop Loss Color: Color for stop-loss areas
Conclusion
The Range Average Retest Model Indicator first identifies the market’s range zones and, using a midline, determines suitable entry and exit positions.
Based on price reactions to this midline, the entry, take-profit, and stop-loss levels are automatically drawn on the chart.
In the settings section, traders can customize the trading boxes and modify calculation parameters to fit their personal strategies.
It should be noted that this tool does not automatically activatetrading positions; it only identifies potential buy and sell setups.
Range Average Retest Model Indicator MT5 PDF
Range Average Retest Model Indicator MT5 PDF
Click to download Range Average Retest Model Indicator MT5 PDFCan this indicator be used in the Forex market?
Yes, the Range Average Retest Model Indicator can be used across all markets.
Can the colors of the boxes be changed?
Yes, the boxes related to take-profit and stop-loss can be modified in the settings section.


