![Range of Candle Indicator for MT5 Download - Free - [TradingFinder]](https://cdn.tradingfinder.com/image/293047/13-91-en-range-of-candle-mt5-01.webp)
![Range of Candle Indicator for MT5 Download - Free - [TradingFinder] 0](https://cdn.tradingfinder.com/image/293047/13-91-en-range-of-candle-mt5-01.webp)
![Range of Candle Indicator for MT5 Download - Free - [TradingFinder] 1](https://cdn.tradingfinder.com/image/293048/13-91-en-range-of-candle-mt5-02.webp)
![Range of Candle Indicator for MT5 Download - Free - [TradingFinder] 2](https://cdn.tradingfinder.com/image/293046/13-91-en-range-of-candle-mt5-03.webp)
![Range of Candle Indicator for MT5 Download - Free - [TradingFinder] 3](https://cdn.tradingfinder.com/image/295222/13-91-en-range-of-candle-mt5-04.webp)
The Range of Candle Indicator visually represents price fluctuations simply.This trading tool evaluates the difference between the high and low of the current and previous candles using colored histograms, and determines the volatility range across all markets, including Forex.
The primary purpose of the Range of Candle Indicator is to display volume changes and price fluctuations based on candlestick data.
Range of Candle Indicator Specifications Table
The specifications of the Range of Candle Oscillator are presented in the table below.
Indicator Categories: | Oscillators MT5 Indicators Signal & Forecast MT5 Indicators Volatility MT5 Indicators |
Platforms: | MetaTrader 5 Indicators |
Trading Skills: | Elementary |
Indicator Types: | Reversal MT5 Indicators |
Timeframe: | Multi-Timeframe MT5 Indicators |
Trading Style: | Scalper MT5 Indicators Day Trading MT5 Indicators |
Trading Instruments: | Forex MT5 Indicators Crypto MT5 Indicators Stock MT5 Indicators Forward MT5 Indicators |
Overview of the Candle Range Indicator
Histograms in the Range of Candle Indicator display market fluctuations and volume. These bars are plotted on the chart in different colors, which include:
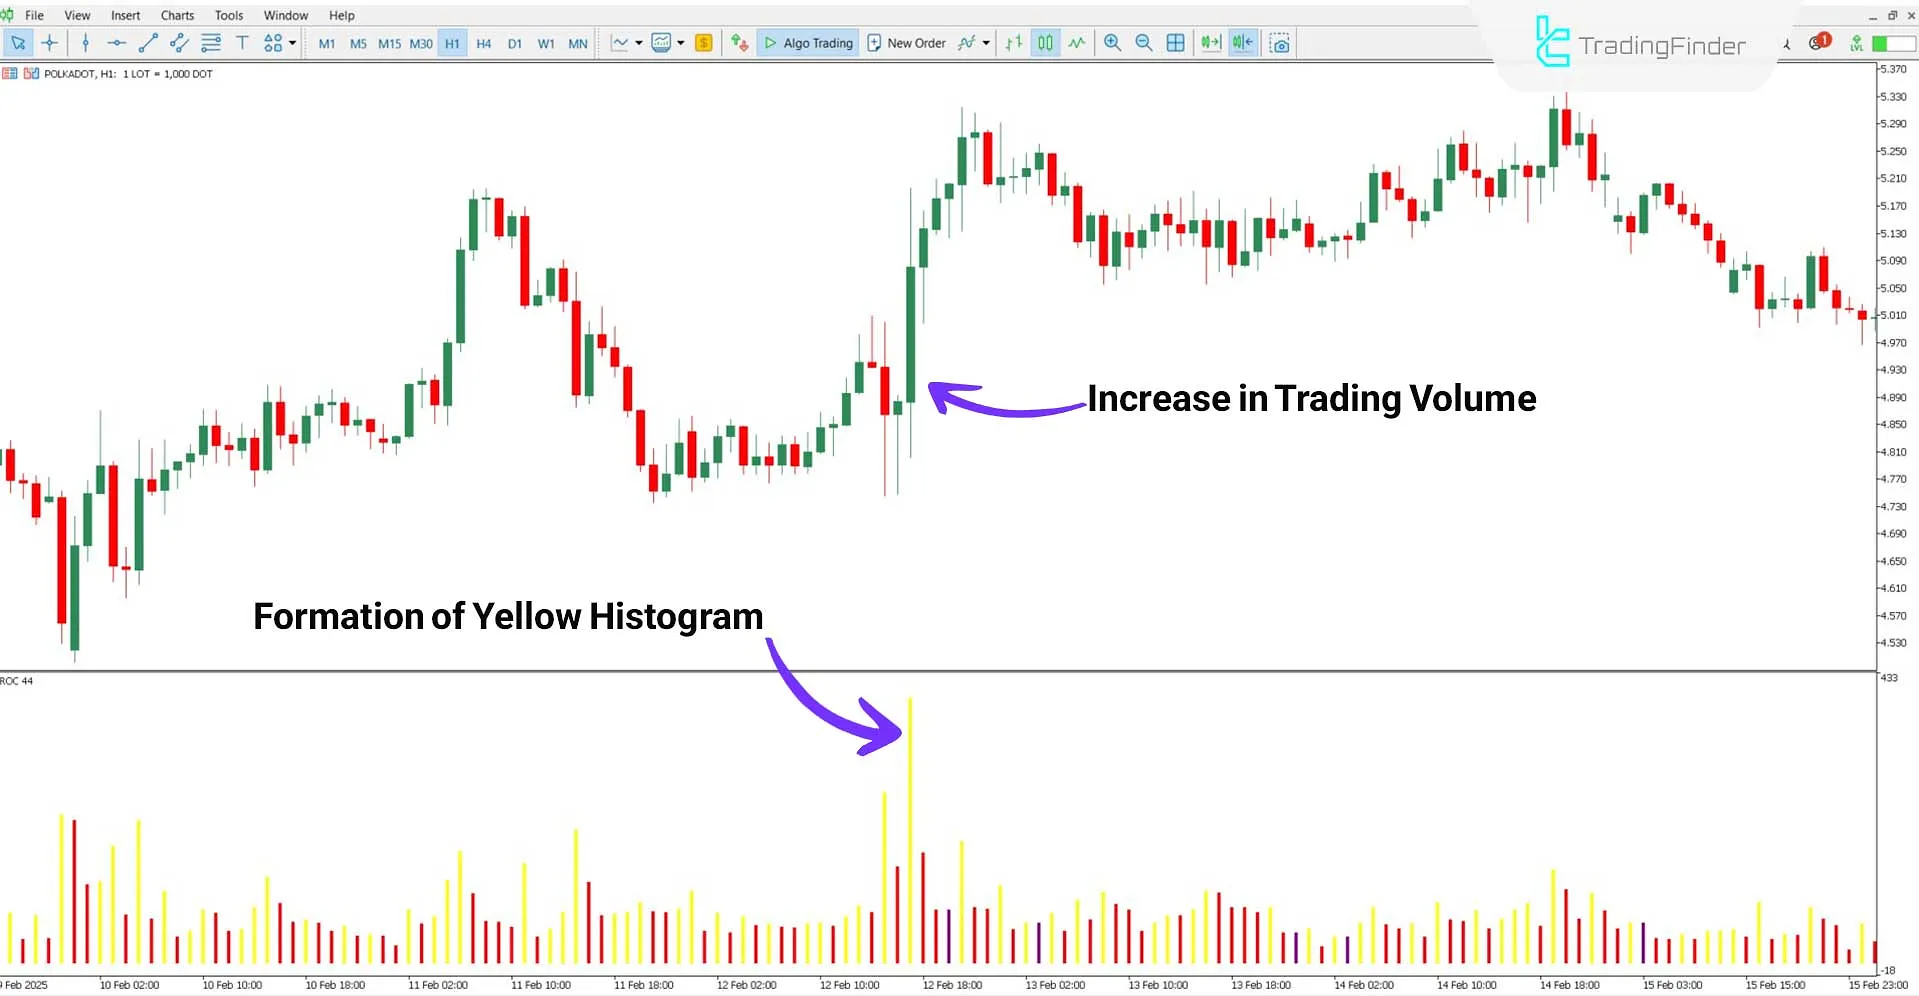
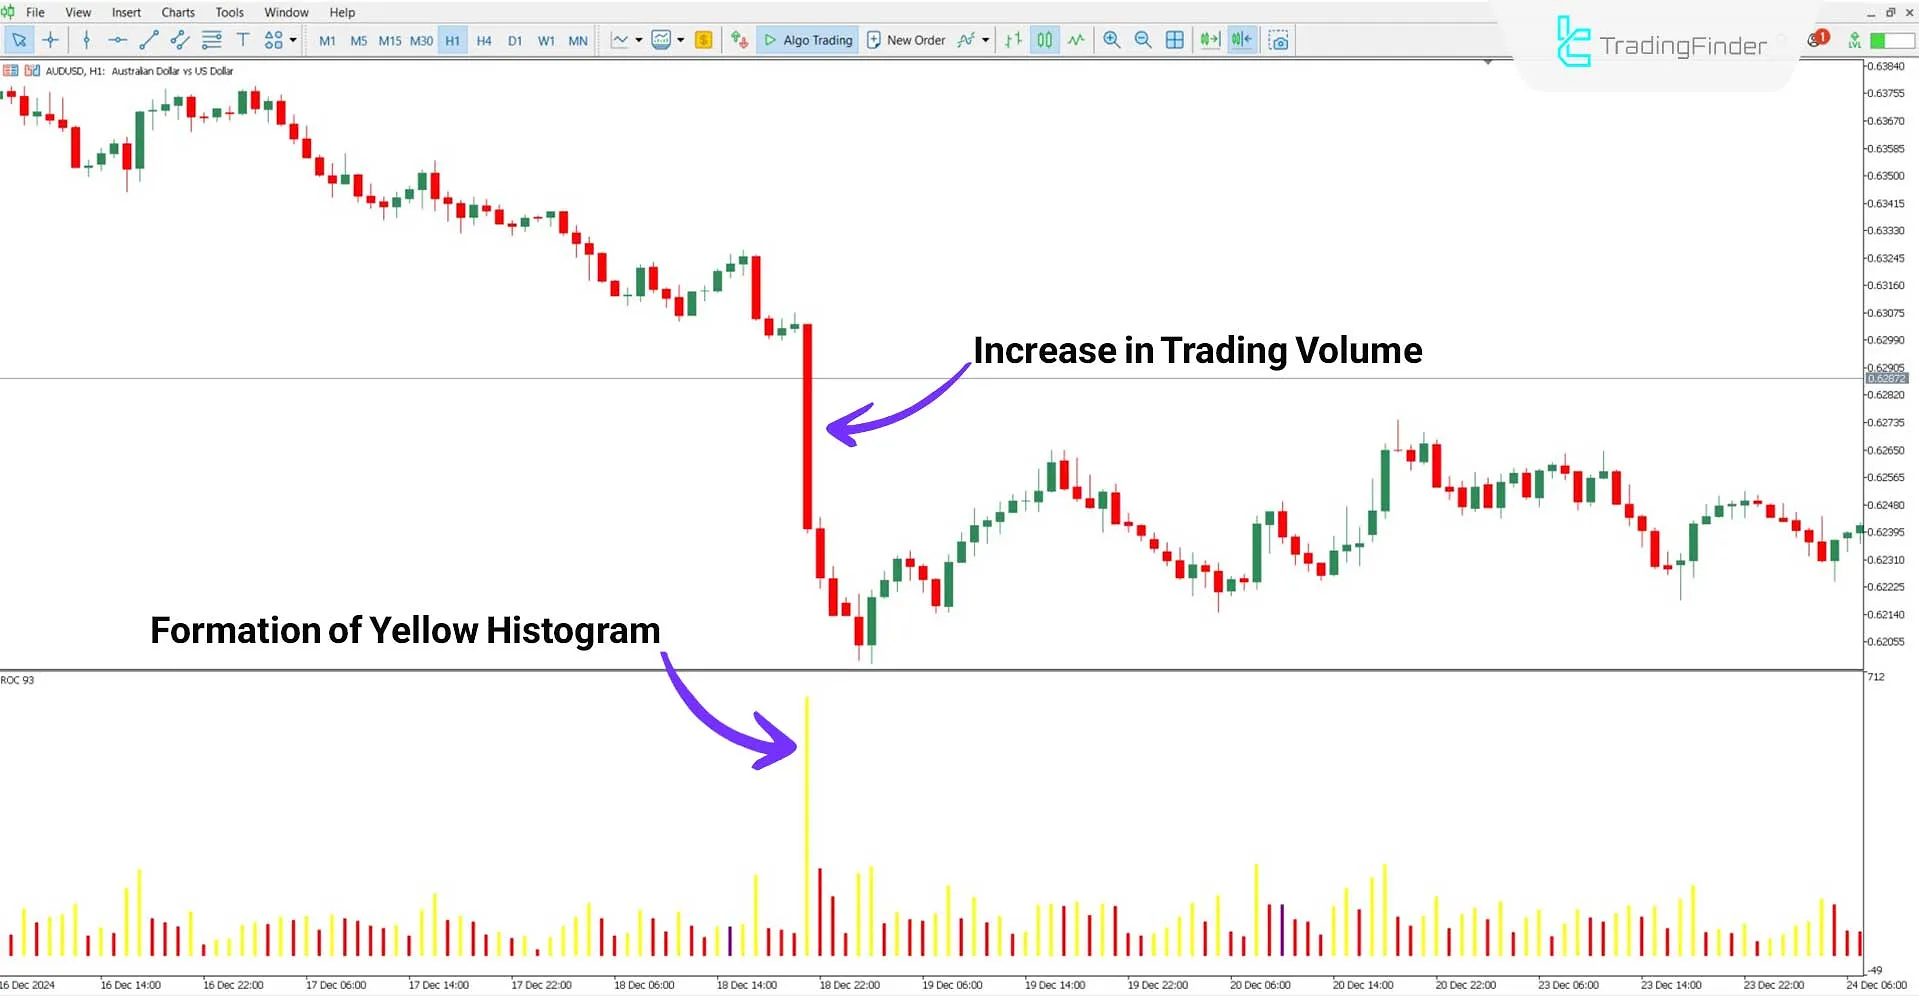
- Yellow Histogram: Indicates an increase in the range between the high and low of the current candle compared to the previous candle.
- Pink Histogram: This represents a decrease in the current candle's range compared to the previous candle.
- Purple Histogram: Identifies an equal fluctuation range between the current and previous candle.
Uptrend Conditions
Analyzing the Polkadot (DOT) cryptocurrency chart in the 1-hour timeframe demonstrates the performance of thisindicator during an uptrend.
The sequential appearance of yellow histograms and green candles indicates an increase in price fluctuations and the strengthening of the upward price movement.

Downtrend Conditions
The AUD/USD currency pair chart in the 1-hour timeframe shows an increase in volatility in the downward direction, as evidenced by the formation of yellow histograms.
Additionally, the appearance of pink histograms alongside green candles indicates a weakening bullish trend and a possible continuation of selling pressure in the market.

Conclusion
The Range of Candle Oscillator is designed to display the size of candle fluctuation ranges.
This volatile indicator analyzes the difference between a candle's highest and lowest price compared to the previous one to determine price fluctuations. If candle ranges consistently increase, a new trend may form.
Range Candle MT5 PDF
Range Candle MT5 PDF
Click to download Range Candle MT5 PDFIs the Candle Range Indicator only applicable to the Forex market?
No; this indicator can be used in all markets, including cryptocurrencies, stocks, forex, and commodities.
What information does the Range of Candle Indicator provide about market volatility?
The larger the candle range, the greater the market volatility. Smaller ranges indicate reduced volatility.


