![Real Woodie CCI Indicator for MetaTrader 5 Download - Free - [TFlab]](https://cdn.tradingfinder.com/image/152282/4-27-en-real-woodie-cci-mt5-1.webp)
![Real Woodie CCI Indicator for MetaTrader 5 Download - Free - [TFlab] 0](https://cdn.tradingfinder.com/image/152282/4-27-en-real-woodie-cci-mt5-1.webp)
![Real Woodie CCI Indicator for MetaTrader 5 Download - Free - [TFlab] 1](https://cdn.tradingfinder.com/image/152249/4-27-en-real-woodie-cci-mt5-2.webp)
![Real Woodie CCI Indicator for MetaTrader 5 Download - Free - [TFlab] 2](https://cdn.tradingfinder.com/image/152251/4-27-en-real-woodie-cci-mt5-3.webp)
![Real Woodie CCI Indicator for MetaTrader 5 Download - Free - [TFlab] 3](https://cdn.tradingfinder.com/image/152250/4-27-en-real-woodie-cci-mt5-4.webp)
The Real Woodie CCI Indicator is an advanced version of the Commodity Channel Index (CCI) among MetaTrader 5 indicators, designed and developed by Ken Wood.
This tool helps traders accurately identify price momentum changes by combining two CCI indicators with different periods and displaying them as a color-coded histogram.
Additionally, the indicator includes a color-coded histogram that reflects various market conditions by changing colors.
Green indicates an upward trend, while red signifies a downward trend. This unique combination simplifies market analysis and enables traders to make more precise decisions.
Indicator Table
Indicator Categories: | Oscillators MT5 Indicators Volatility MT5 Indicators Currency Strength MT5 Indicators |
Platforms: | MetaTrader 5 Indicators |
Trading Skills: | Advanced |
Indicator Types: | Leading MT5 Indicators |
Timeframe: | Multi-Timeframe MT5 Indicators |
Trading Style: | Intraday MT5 Indicators |
Trading Instruments: | Forex MT5 Indicators Crypto MT5 Indicators Stock MT5 Indicators Forward MT5 Indicators Share Stock MT5 Indicators |
Overview of the Indicator
The Real Woodie CCI Indicator is designed with two key components that work together to simplify market momentum analysis. The first component, Turbo CCI (Fast CCI), is calculated with a shorter period to detect rapid momentum changes. This line, displayed in brown, serves as the primary signal for entering or exiting trades.
The second component, Trend CCI (Slow CCI), is calculated with a longer period to determine the overall market trend. Displayed in blue, this line acts as a filter to confirm the signals provided by the Turbo CCI, ensuring more reliable trade decisions. Together, these components provide traders with a clear and effective view of market momentum.
Indicator in an Uptrend
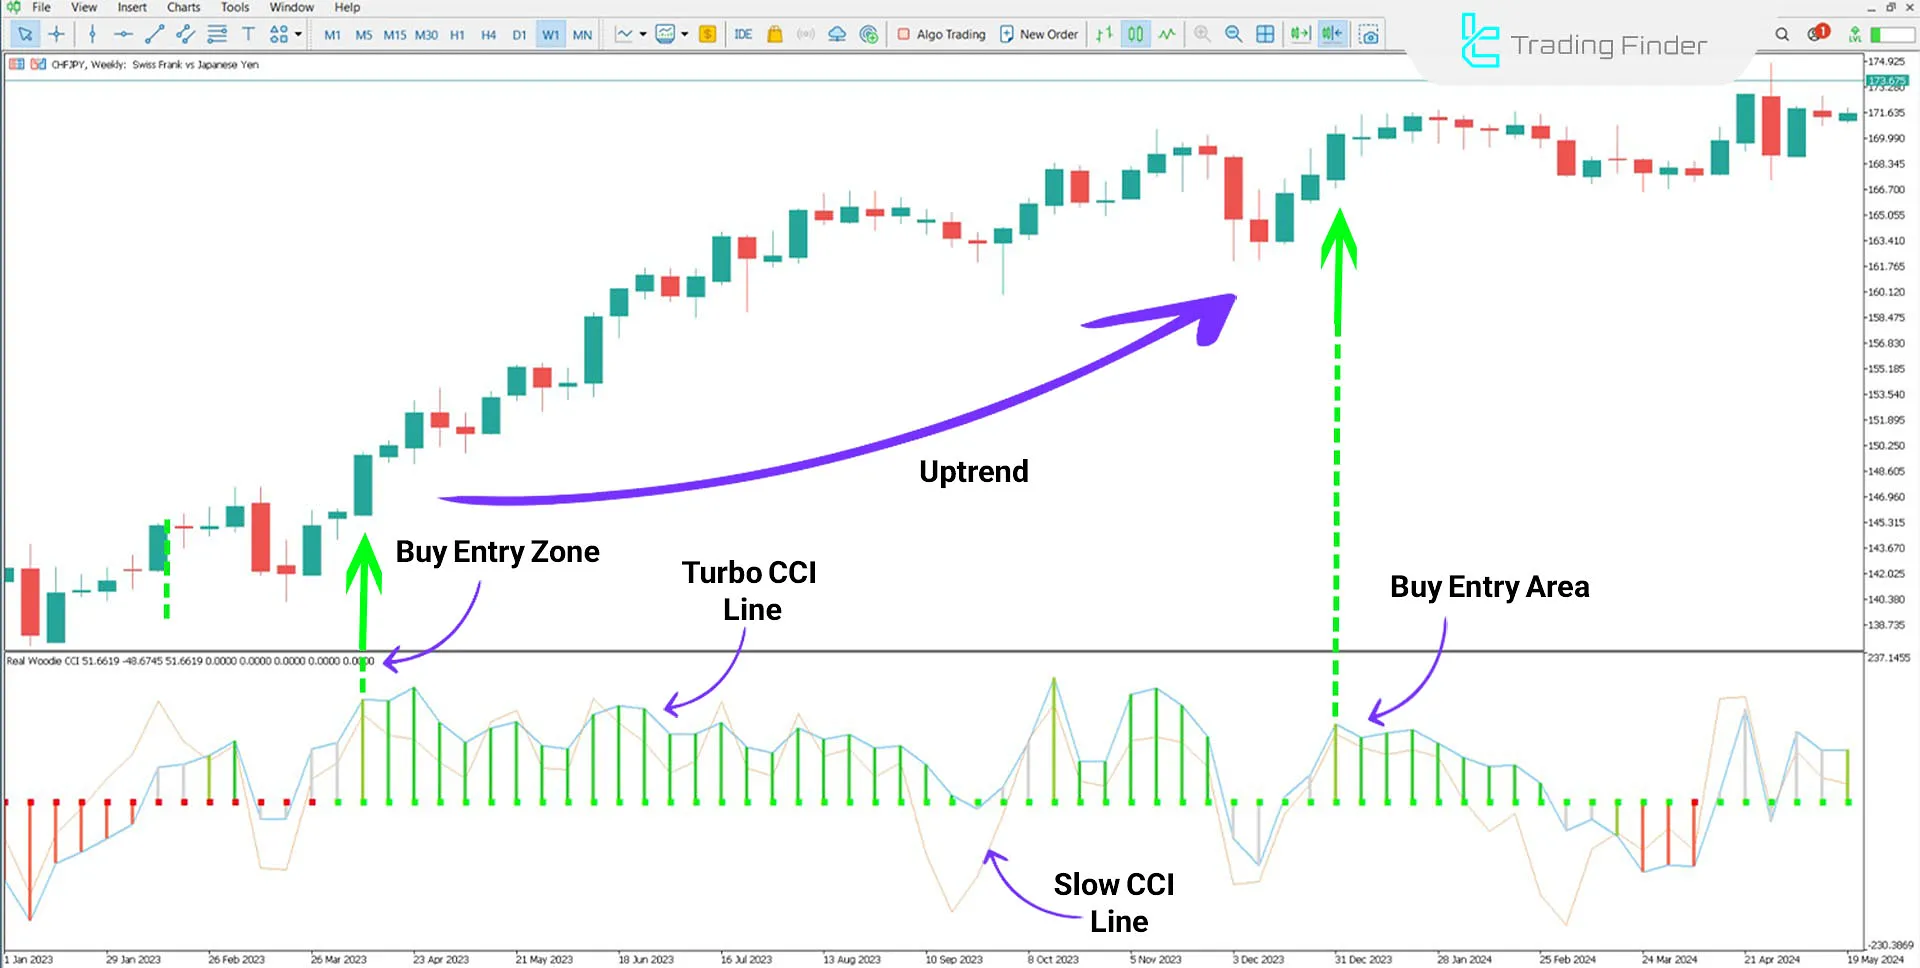
In an uptrend, such as the CHF/JPY currency pair, the histogram turns green when the Turbo CCI crosses above the zero line, and the Trend CCI also remains above zero.
This indicates strengthening bullish momentum and a good opportunity to enter buy trades. If the Turbo CCI approaches the zero line after a decline and moves upwards again, it can confirm the continuation of the bullish trend.

Indicator in a Downtrend
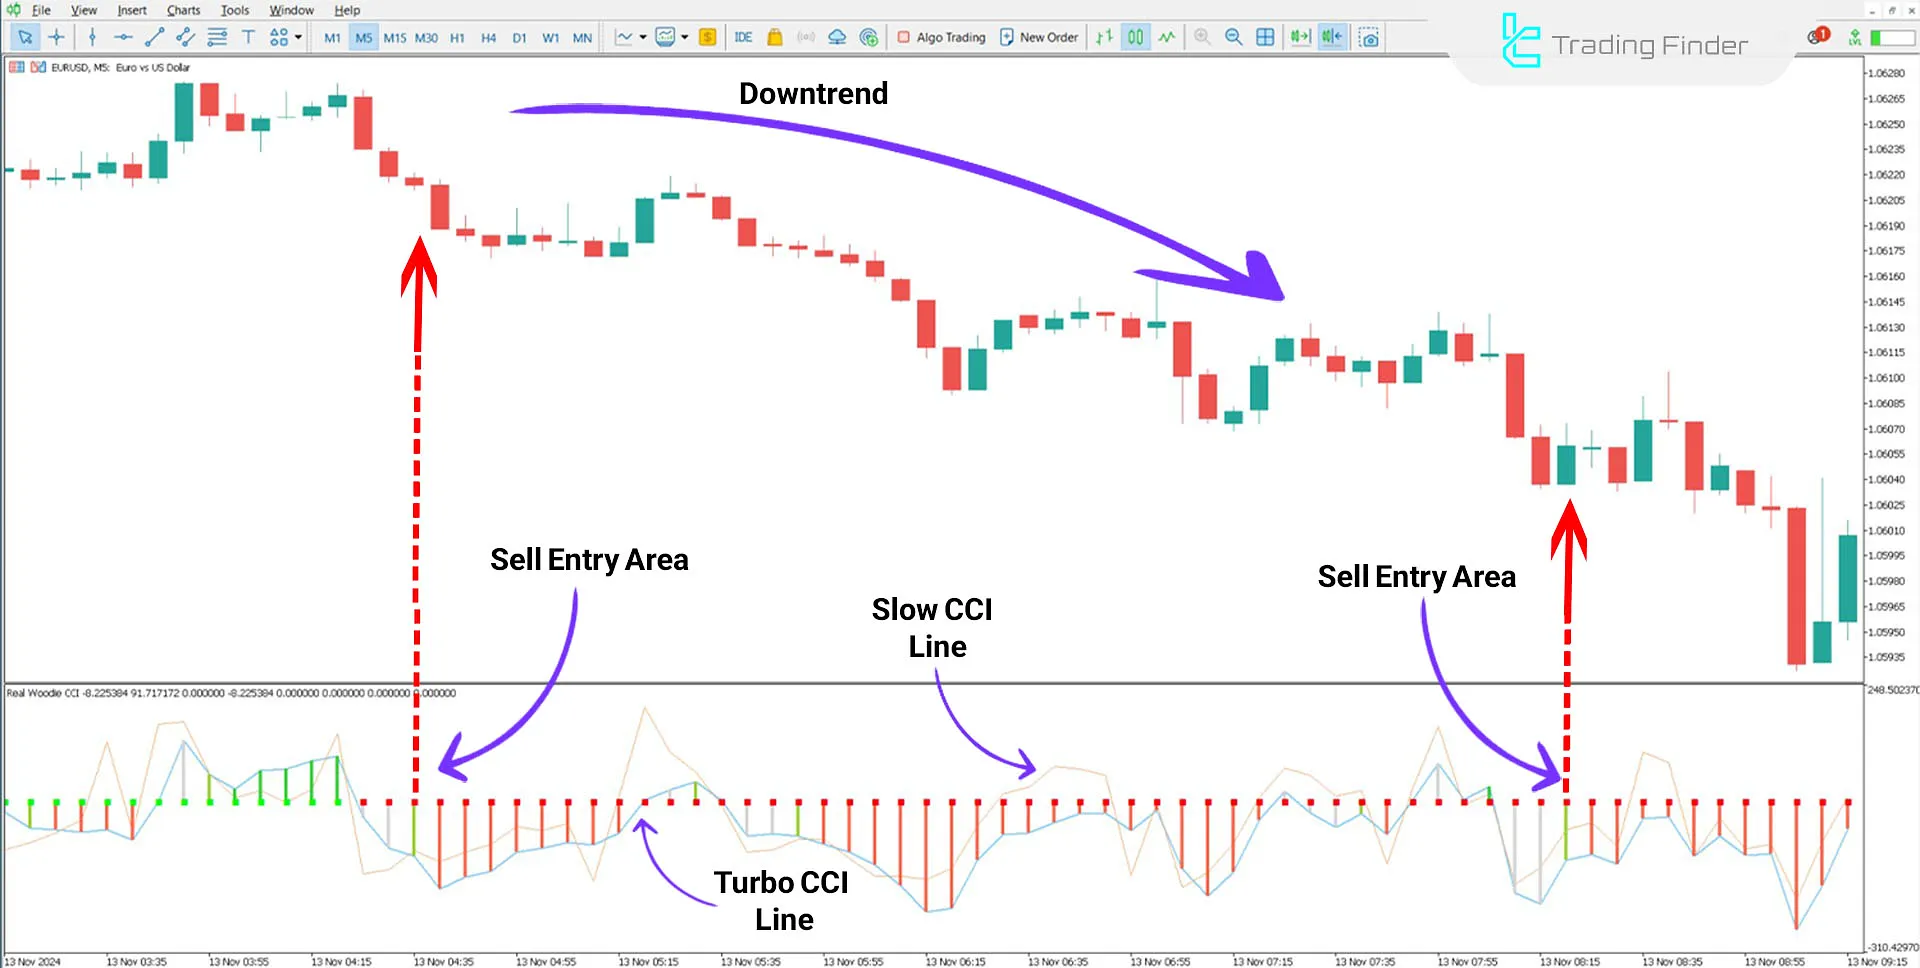
In a downtrend, such as the EUR/USD currency pair in the 5-minute timeframe, when the Turbo CCI crosses below the zero line, and the Trend CCI remains below zero, the histogram turns red.
This indicates strengthening bearish momentum and a good opportunity to enter sell trades. If the Turbo CCI approaches the zero line after an increase and moves downwards again, it can confirm the continuation of the bearish trend.

Indicator Settings

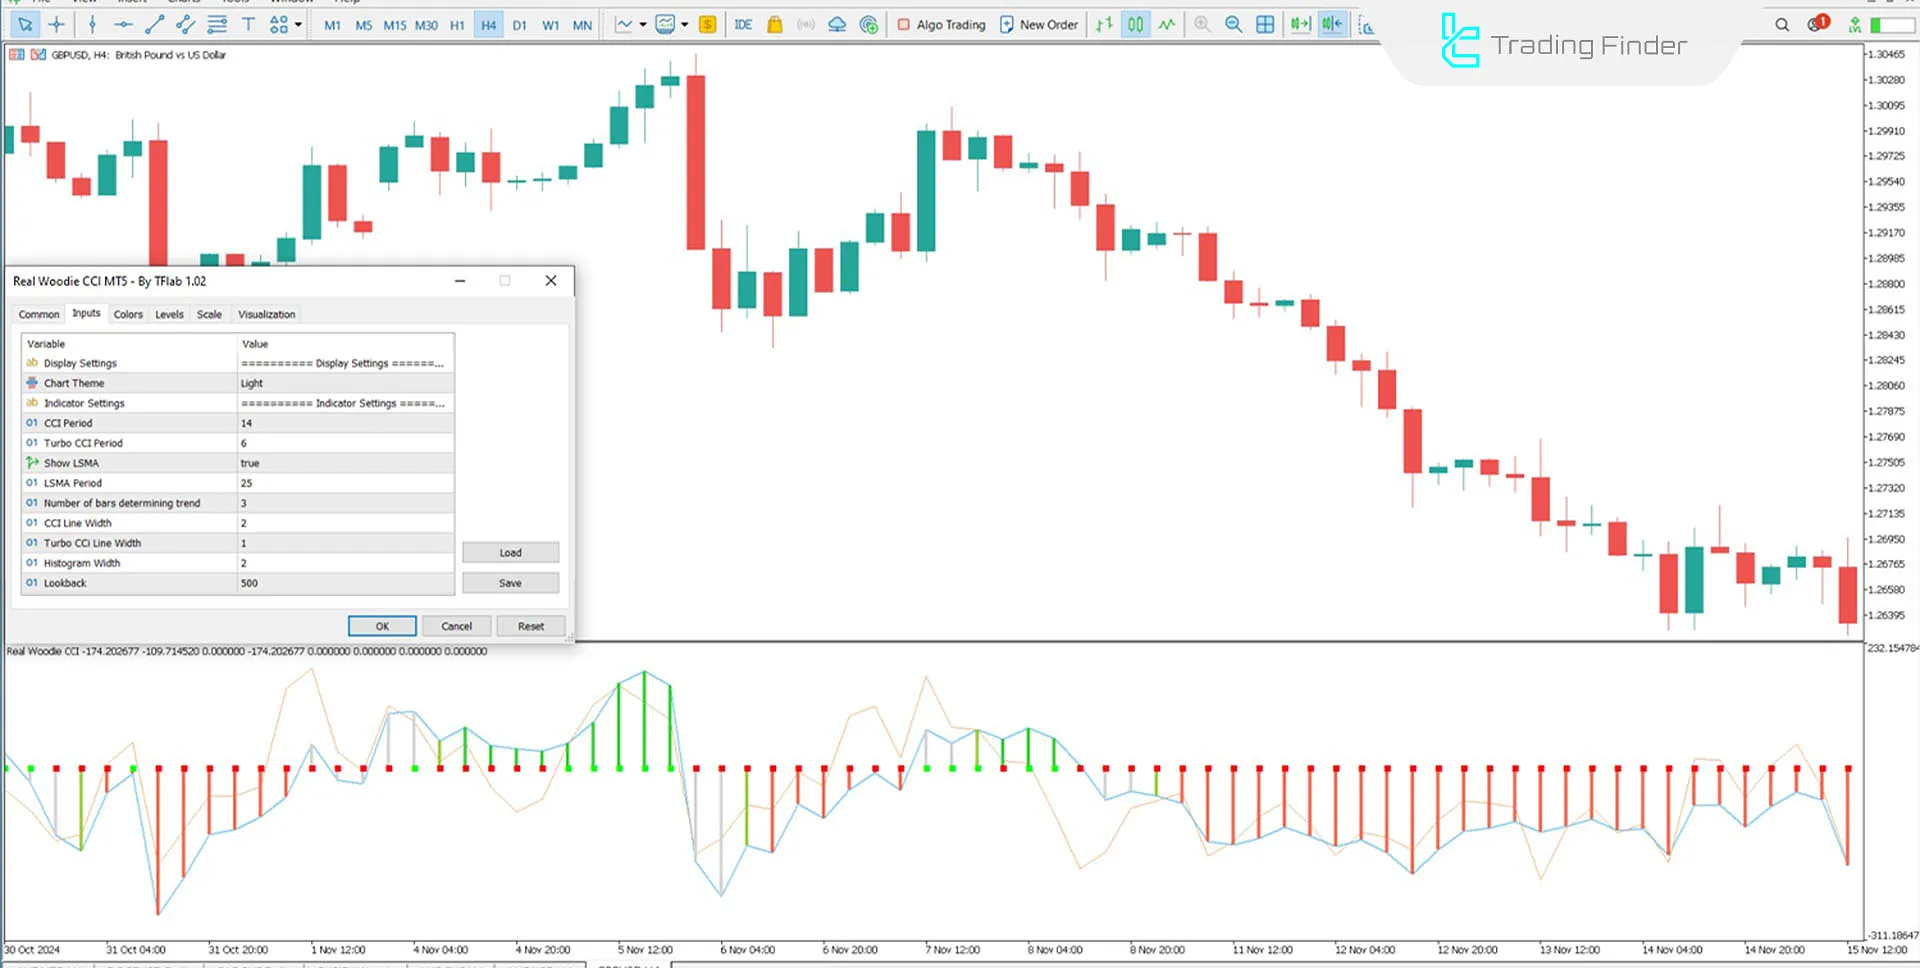
- Chart Theme: Background of the chart;
- CCI Period: CCI calculation period (default: 14);
- TCCI Period: Turbo CCI line calculation period;
- Show the LSMA: Zero zone of the oscillator (squares);
- LSMA Period: Period for oscillator zero zone squares;
- Trend Period: Candle stabilization period for trends (default: 3);
- CCI Width: Width of the CCI line (default: 2);
- TCCI Width :Width of the Turbo CCI line (default: 1);
- Histogram Width: Histogram thickness (default: 2);
- Look Back: at the Number of candles to calculate backward.
Conclusion
The Real Woodie CCI indicator is an advanced tool in technical analysis that combines both fast and slow CCI values to provide more precise insights. Its colored histogram clearly displays bullish and bearish conditions, assisting traders in making better decisions.
This oscillator for MetaTrader 5 is highly adaptable and easy to use, making it suitable for all markets and timeframes. Additionally, thanks to its ability to simplify momentum analysis, this indicator has become one of the most popular tools among traders on the MetaTrader 5 platform.
Real Woodie CCI MT5 PDF
Real Woodie CCI MT5 PDF
Click to download Real Woodie CCI MT5 PDFWhen does this indicator issue a bullish signal?
A bullish signal is issued when the Turbo CCI crosses the zero line and the Trend CCI remains above zero. In this case, the histogram turns green, indicating positive market momentum.
Is using this indicator alone sufficient?
The Real Woodie CCI Indicator is a powerful tool. However, for greater accuracy, it is recommended to use it alongside other technical analysis tools, such as support and resistance levels and complementary indicators.


