![RSI 3 Time Frame Alert Indicator for MT5 Download - Free - [TF Lab]](https://cdn.tradingfinder.com/image/107715/11-9-en-rsi-3-tfa-mt5.webp)
![RSI 3 Time Frame Alert Indicator for MT5 Download - Free - [TF Lab] 0](https://cdn.tradingfinder.com/image/107715/11-9-en-rsi-3-tfa-mt5.webp)
![RSI 3 Time Frame Alert Indicator for MT5 Download - Free - [TF Lab] 1](https://cdn.tradingfinder.com/image/95475/11-09-en-rsi-3tf-alert-mt5-03.webp)
![RSI 3 Time Frame Alert Indicator for MT5 Download - Free - [TF Lab] 2](https://cdn.tradingfinder.com/image/95481/11-09-en-rsi-3tf-alert-mt5-02.webp)
![RSI 3 Time Frame Alert Indicator for MT5 Download - Free - [TF Lab] 3](https://cdn.tradingfinder.com/image/95482/11-09-en-rsi-3tf-alert-mt5-04.webp)
The RSI 3 Time Frame Alert Indicator (RSI 3TFA) for the MetaTrader 5 (MT5) indicator combines three RSI indicators displayed as an oscillator on the chart. The trading tool features three RSI lines, each with a 2-period setting: the red line represents one timeframe higher than the current chart, the blue line represents two timeframes higher, and the purple line represents the highest timeframe relative to the chart's timeframe.
Buy and sell signals are issued when the necessary conditions are met within the RSI 3TFA indicator.
RSI 3TFA Table
Indicator Categories: | Oscillators MT5 Indicators Signal & Forecast MT5 Indicators Volatility MT5 Indicators |
Platforms: | MetaTrader 5 Indicators |
Trading Skills: | Intermediate |
Indicator Types: | Leading MT5 Indicators Reversal MT5 Indicators |
Timeframe: | M1-M5 Timeframe MT5 Indicators M15-M30 Timeframe MT5 Indicators H1-H4 Timeframe MT5 Indicators |
Trading Style: | Intraday MT5 Indicators Scalper MT5 Indicators Day Trading MT5 Indicators |
Trading Instruments: | Forex MT5 Indicators Crypto MT5 Indicators Indices MT5 Indicators Forward MT5 Indicators |
Buy Signal (RSI 3TFA)

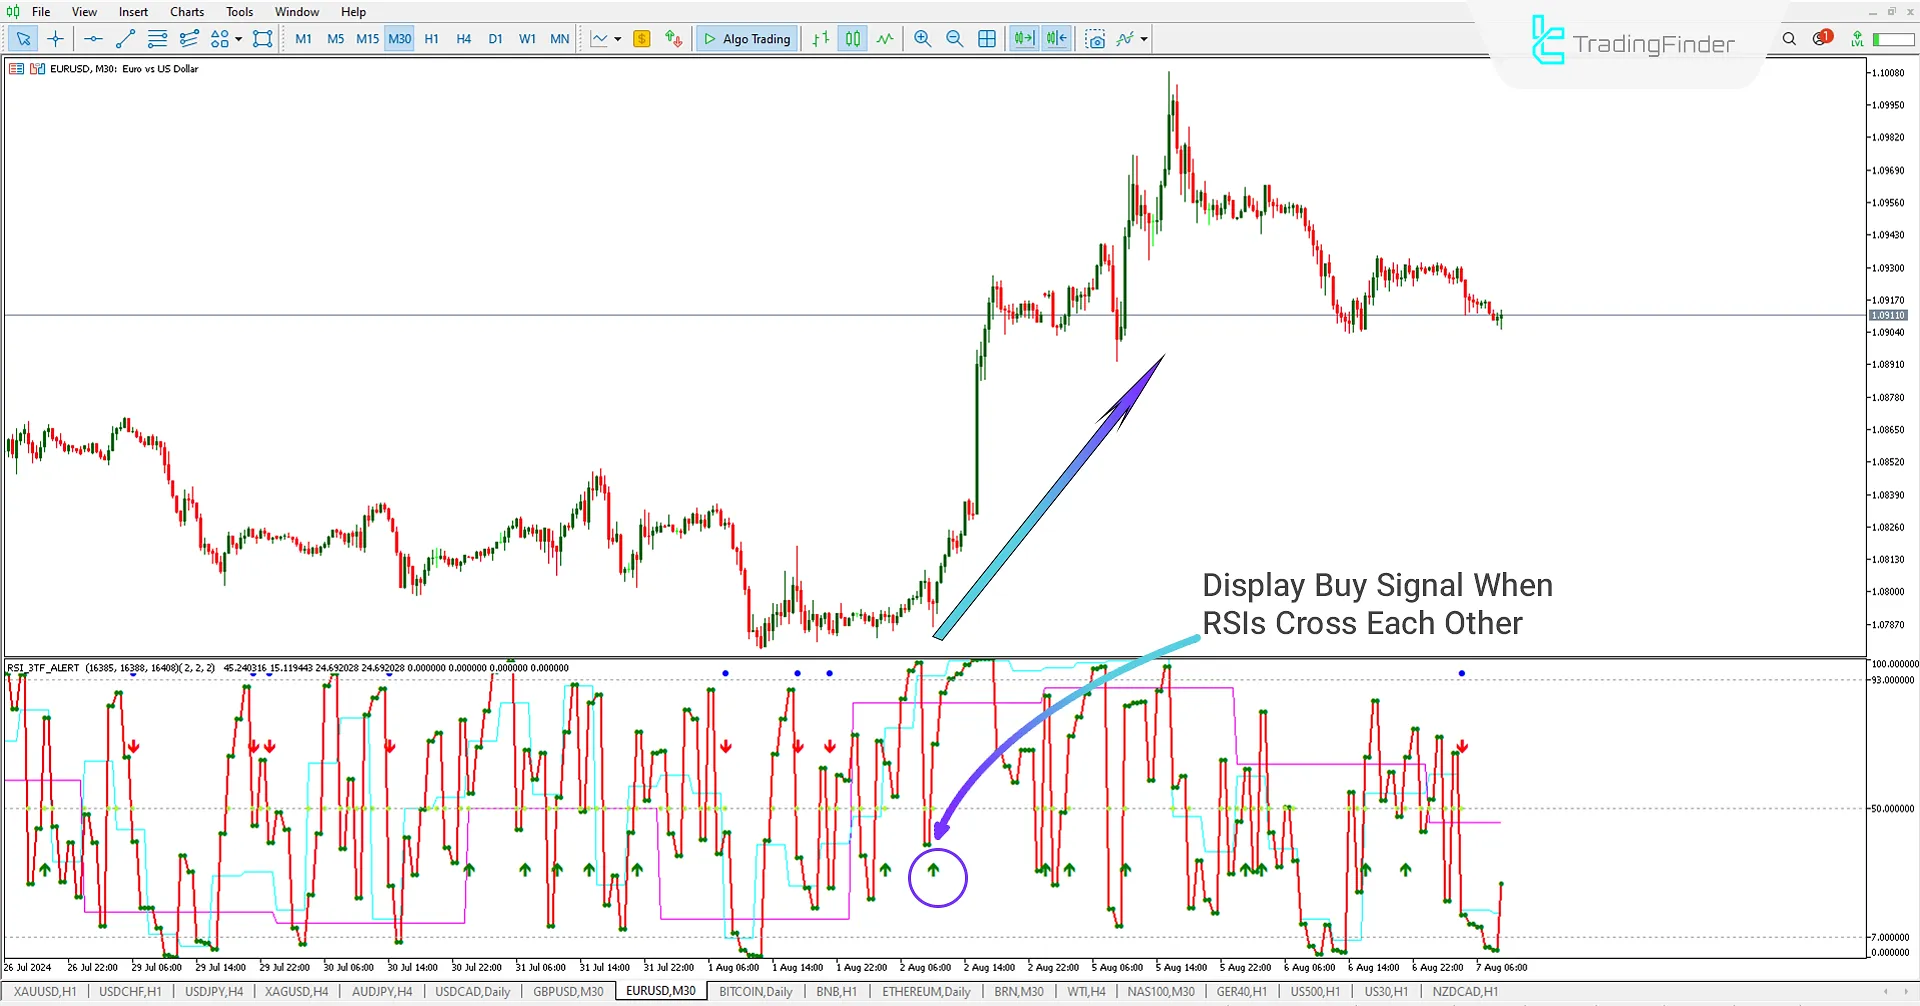
In the 30-minute chart of EUR/USD, the RSI 3TFA indicator issued a buy signal at the price of 1.07956 when the appropriate conditions were met. After this signal, the market entered an uptrend. The trader can enter a buy (BUY) trade by analyzing the market and observing this bullish signal.
Sell Signal (RSI 3TFA)

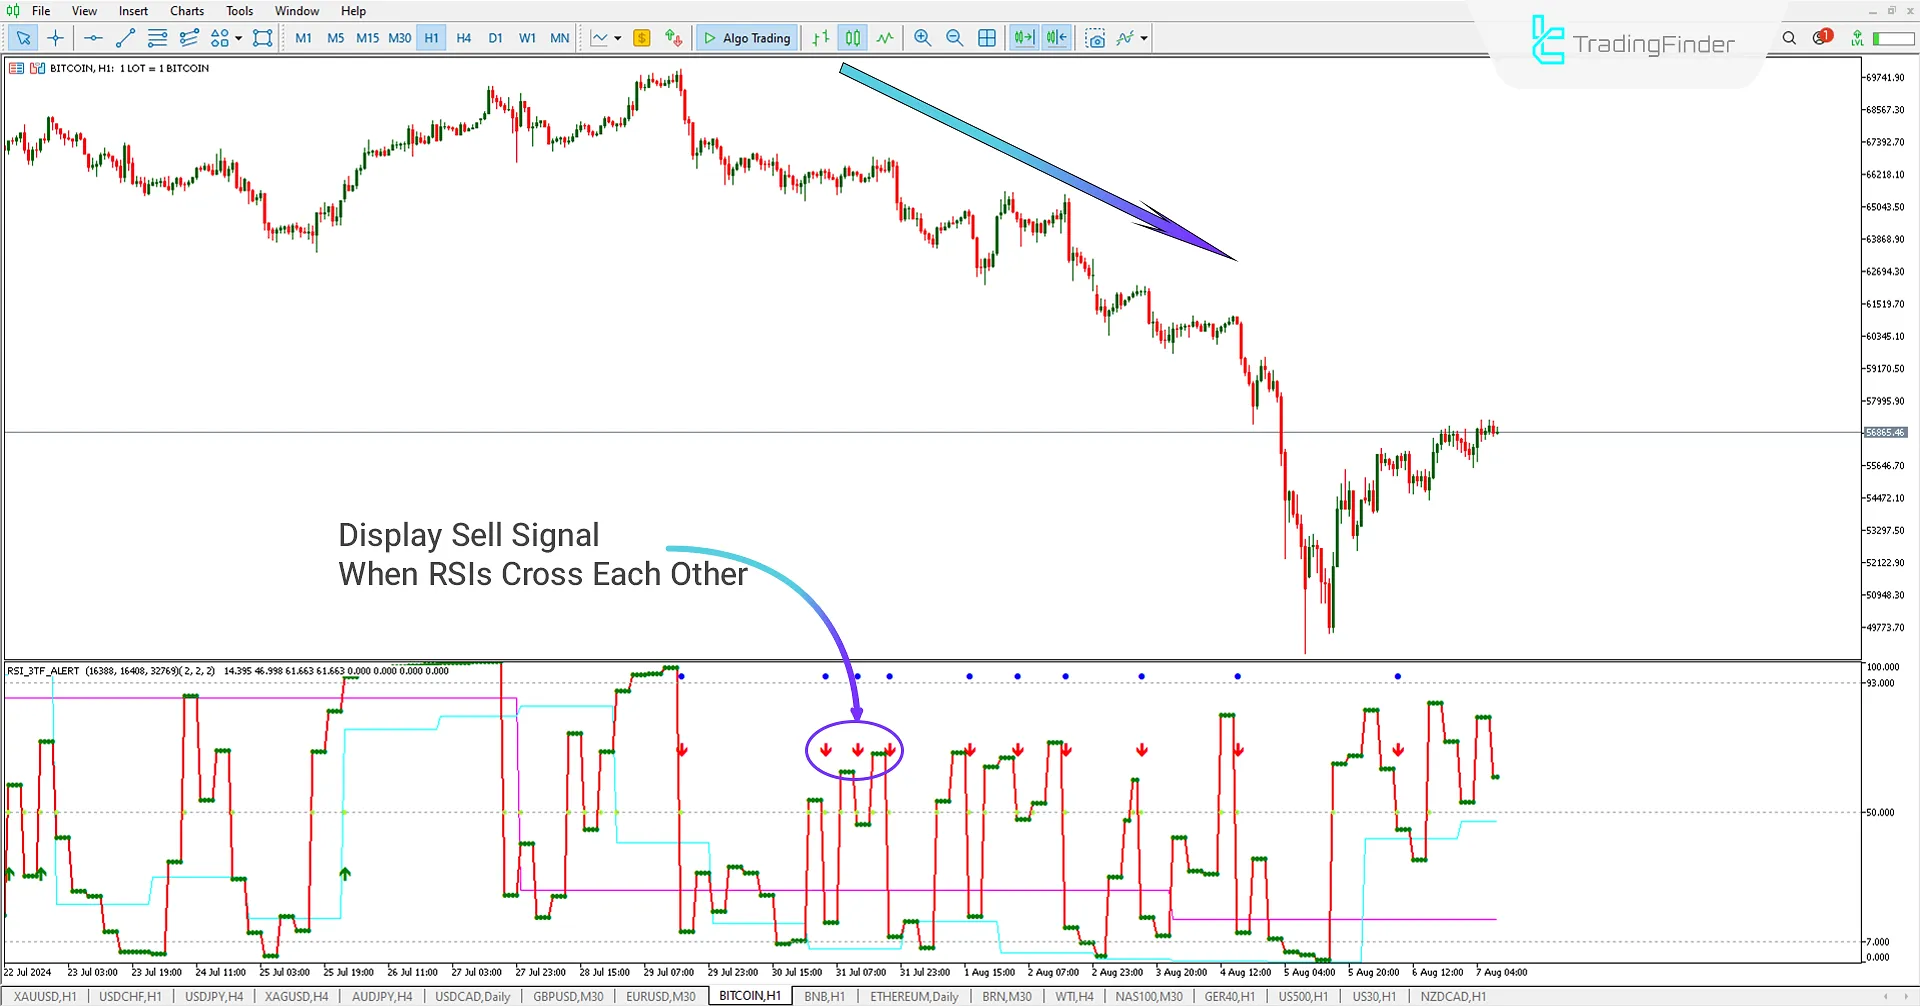
In the one-hour chart of Bitcoin, the oscillators of the RSI 3TFA are below the zero line. As the three RSI lines cross each other at the price of 66289.21, a sell signal is issued. Upon seeing this signal, the trader can enter a sell (SELL) trade.
RSI 3TFA Oscillator Settings

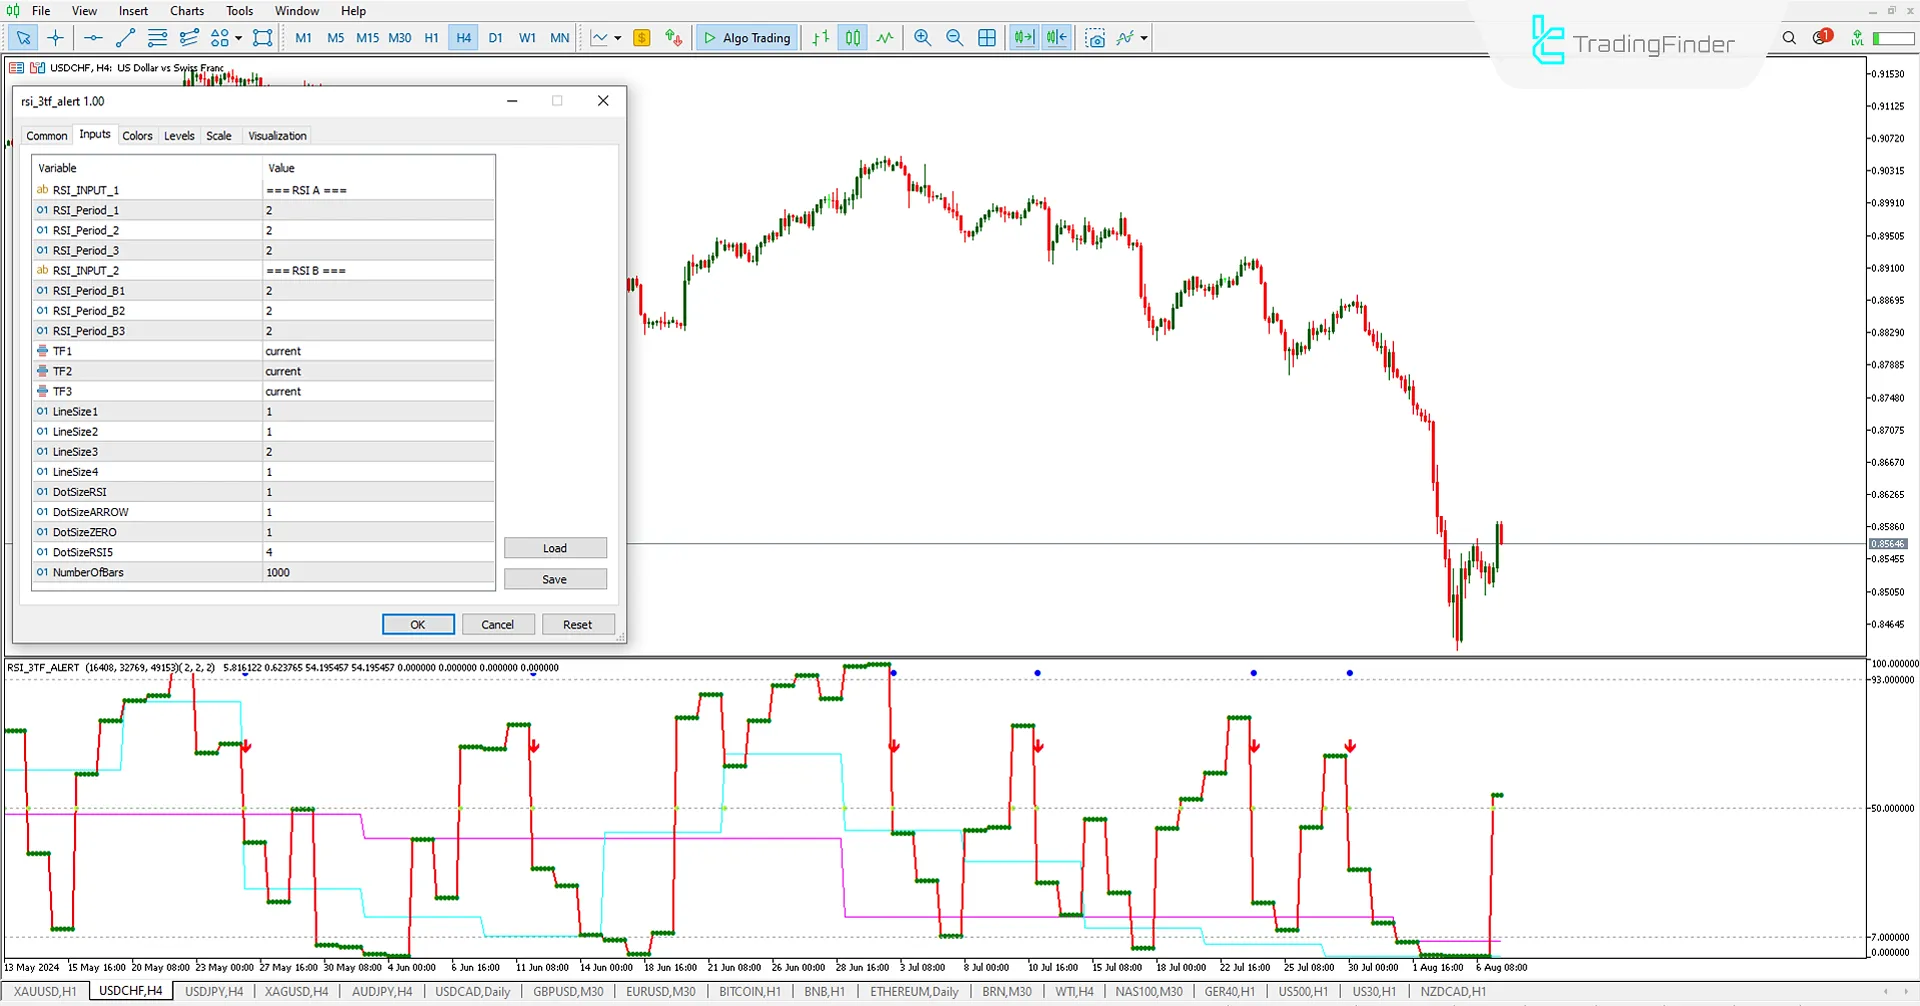
- RSI_INPUT_1: First RSI Input Settings
- RSI_Period_1: Period for RSI 1
- RSI_Period_2: Period for RSI 2
- RSI_Period_3: Period for RSI 3
- RSI_INPUT_2: Second RSI Input Settings
- RSI_Period_B1: Period for RSI B1
- RSI_Period_B2: Period for RSI B2
- RSI_Period_B3: Period for RSI B3
- TF1: Select Timeframe 1
- TF2: Select Timeframe 2
- TF3: Select Timeframe 3
- Line Size 1: Magenta Line Size
- Line Size 2: Aqua Line Size
- Line Size 3: Red Line Size
- Line Size 4: Line Size 4
- Dot Size RSI: Dot Size for RSI
- Dot Size ARROW: Signal Arrow Size
- Dot Size ZERO: Zero Line Dot Size
- Dot Size RS15: RSI 5 Dot Size
- Number of Bars: Number of Bars for Indicator Calculation
Conclusion
The RSI 3TF Alert Indicator (RSI 3TFA) uses three RSI oscillators at different timeframes to provide buy and sell signals. Building a trading strategy, Traders can add three more RSI oscillators in the settings section of this indicator to observe additional signals on the chart.
RSI 3 Time Frame MT5 PDF
RSI 3 Time Frame MT5 PDF
Click to download RSI 3 Time Frame MT5 PDFWhat is the RSI 3TF Alert Indicator?
The RSI 3TF Alert Indicator is an oscillator that combines three Relative Strength Index (RSI) indicators with different timeframes to issue stronger signals on the chart. This allows traders to use these signals for buying and selling.
How does the RSI 3TF Alert Indicator work?
This indicator combines three different RSI timeframes (usually short-term, medium-term, and long-term). A strong buy or sell signal is generated when all three RSIs converge on a signal (e.g., all being in the oversold or overbought area).
Is there any change in alerts when the arrows are plotted? Would be epic with alerts!
No. we will do that. we will add notifications on website, you can select it and notified when it will be ready.
Wonderful idea and indicator!


