![RSI Arrow Indicator for MetaTrader 5 – Free Download – [TradingFinder]](https://cdn.tradingfinder.com/image/452284/2-96-en-rsi-arrow-mt5-1.webp)
![RSI Arrow Indicator for MetaTrader 5 – Free Download – [TradingFinder] 0](https://cdn.tradingfinder.com/image/452284/2-96-en-rsi-arrow-mt5-1.webp)
![RSI Arrow Indicator for MetaTrader 5 – Free Download – [TradingFinder] 1](https://cdn.tradingfinder.com/image/452282/2-96-en-rsi-arrow-mt5-2.webp)
![RSI Arrow Indicator for MetaTrader 5 – Free Download – [TradingFinder] 2](https://cdn.tradingfinder.com/image/452283/2-96-en-rsi-arrow-mt5-3.webp)
![RSI Arrow Indicator for MetaTrader 5 – Free Download – [TradingFinder] 3](https://cdn.tradingfinder.com/image/452281/2-96-en-rsi-arrow-mt5-4.webp)
On July 6, 2025, in version 2, alert/notification and signal functionality was added to this indicator
The RSI Arrow Indicator is an analytical tool based on the Relative Strength Index (RSI), designed to display trading signals in the form of arrows within the oscillator window.
This MT5 indicator combines an RSI line with a moving average signal line.
The intersection points of these two curves serve as the basis for issuing entry and exit signals, as well as identifying overbought and oversold zones.
RSI Arrow Indicator Table
The general specifications of the RSI Arrow Indicator are presented in the following table:
Indicator Categories: | Oscillators MT5 Indicators Signal & Forecast MT5 Indicators Momentum Indicators in MT5 RSI Indicators for MetaTrader 5 |
Platforms: | MetaTrader 5 Indicators |
Trading Skills: | Intermediate |
Indicator Types: | Reversal MT5 Indicators |
Timeframe: | Multi-Timeframe MT5 Indicators |
Trading Style: | Intraday MT5 Indicators |
Trading Instruments: | Forex MT5 Indicators Crypto MT5 Indicators Stock MT5 Indicators Commodity MT5 Indicators Indices MT5 Indicators Share Stock MT5 Indicators Binary Options MT5 Indicators |
Indicator Overview
The RSI Arrow Indicator is a practical tool in technical analysis that uses blue and red arrows to signal entry and exit points, as well as overbought and oversold areas, as follows:
- Blue Arrow: Appears when the RSI exits below level 30 and crosses above the EMA line;
- Red Arrow: This appears when the RSI exits above level 70 and crosses below the EMA line.
Uptrend Conditions
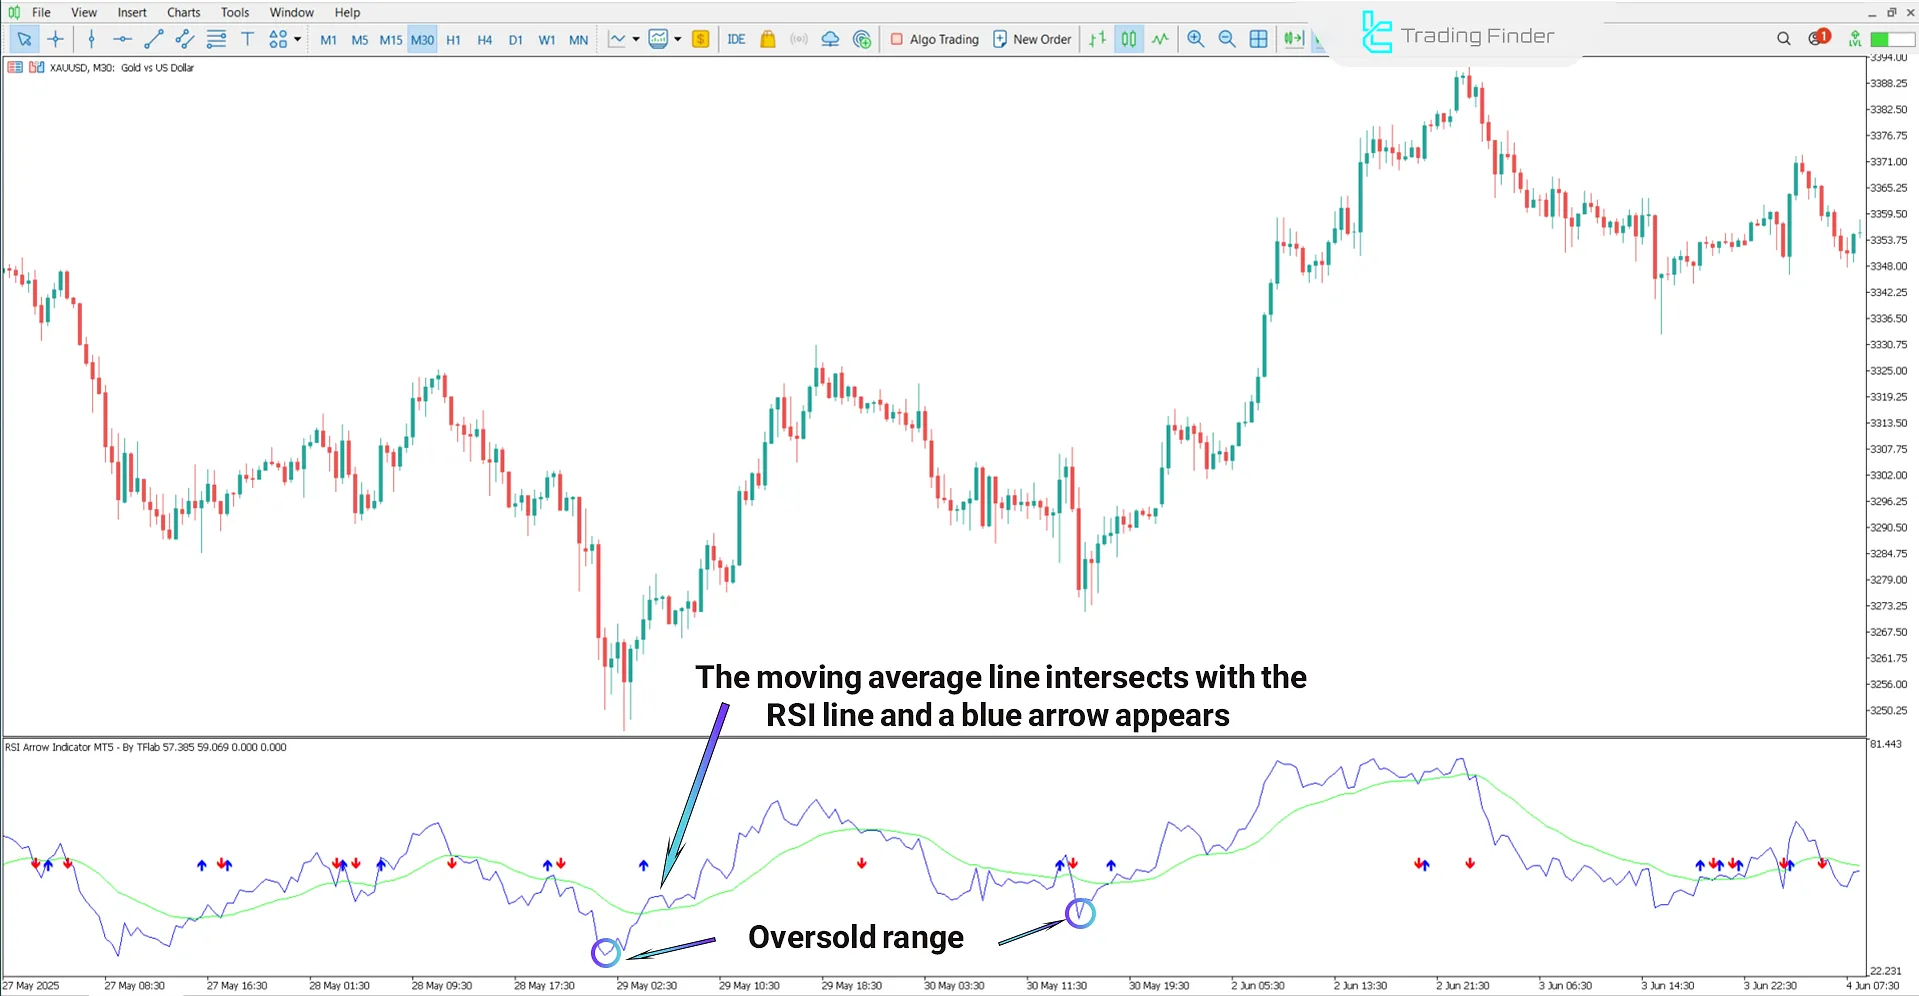
The chart below shows the XAU/USD (Gold) in a 30-minute timeframe.
In this chart, the RSI exits the oversold zone and crosses above the moving average, indicating a trend reversal and the start of an uptrend.
Simultaneously, the appearance of a blue arrow confirms the bullish movement and provides a suitable buy signal.

Downtrend Conditions
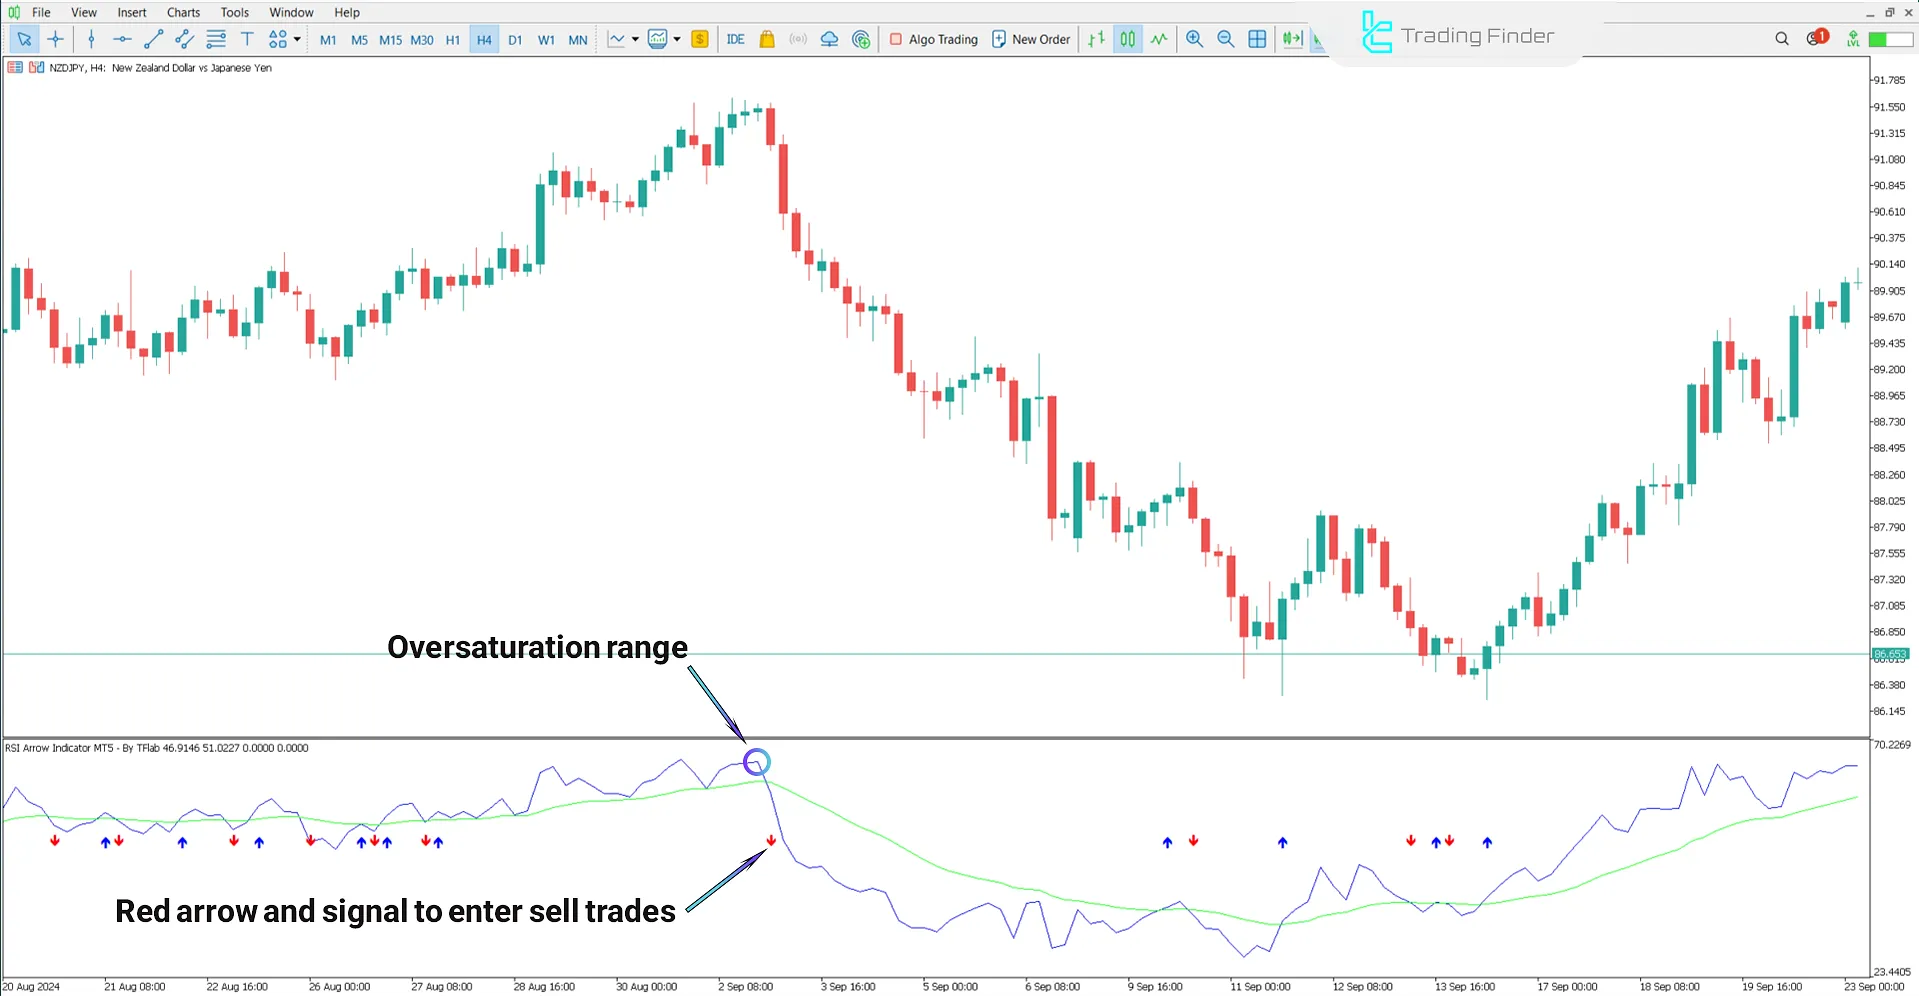
The chart below displays the NZD/JPY currency pair in a 4-hour timeframe.
A sell signal is generated when the RSI crosses below the EMA from above, accompanied by the appearance of a red arrow.
This situation indicates an overbought zone and suggests a suitable level for short positions.

RSI Arrow Indicator Settings
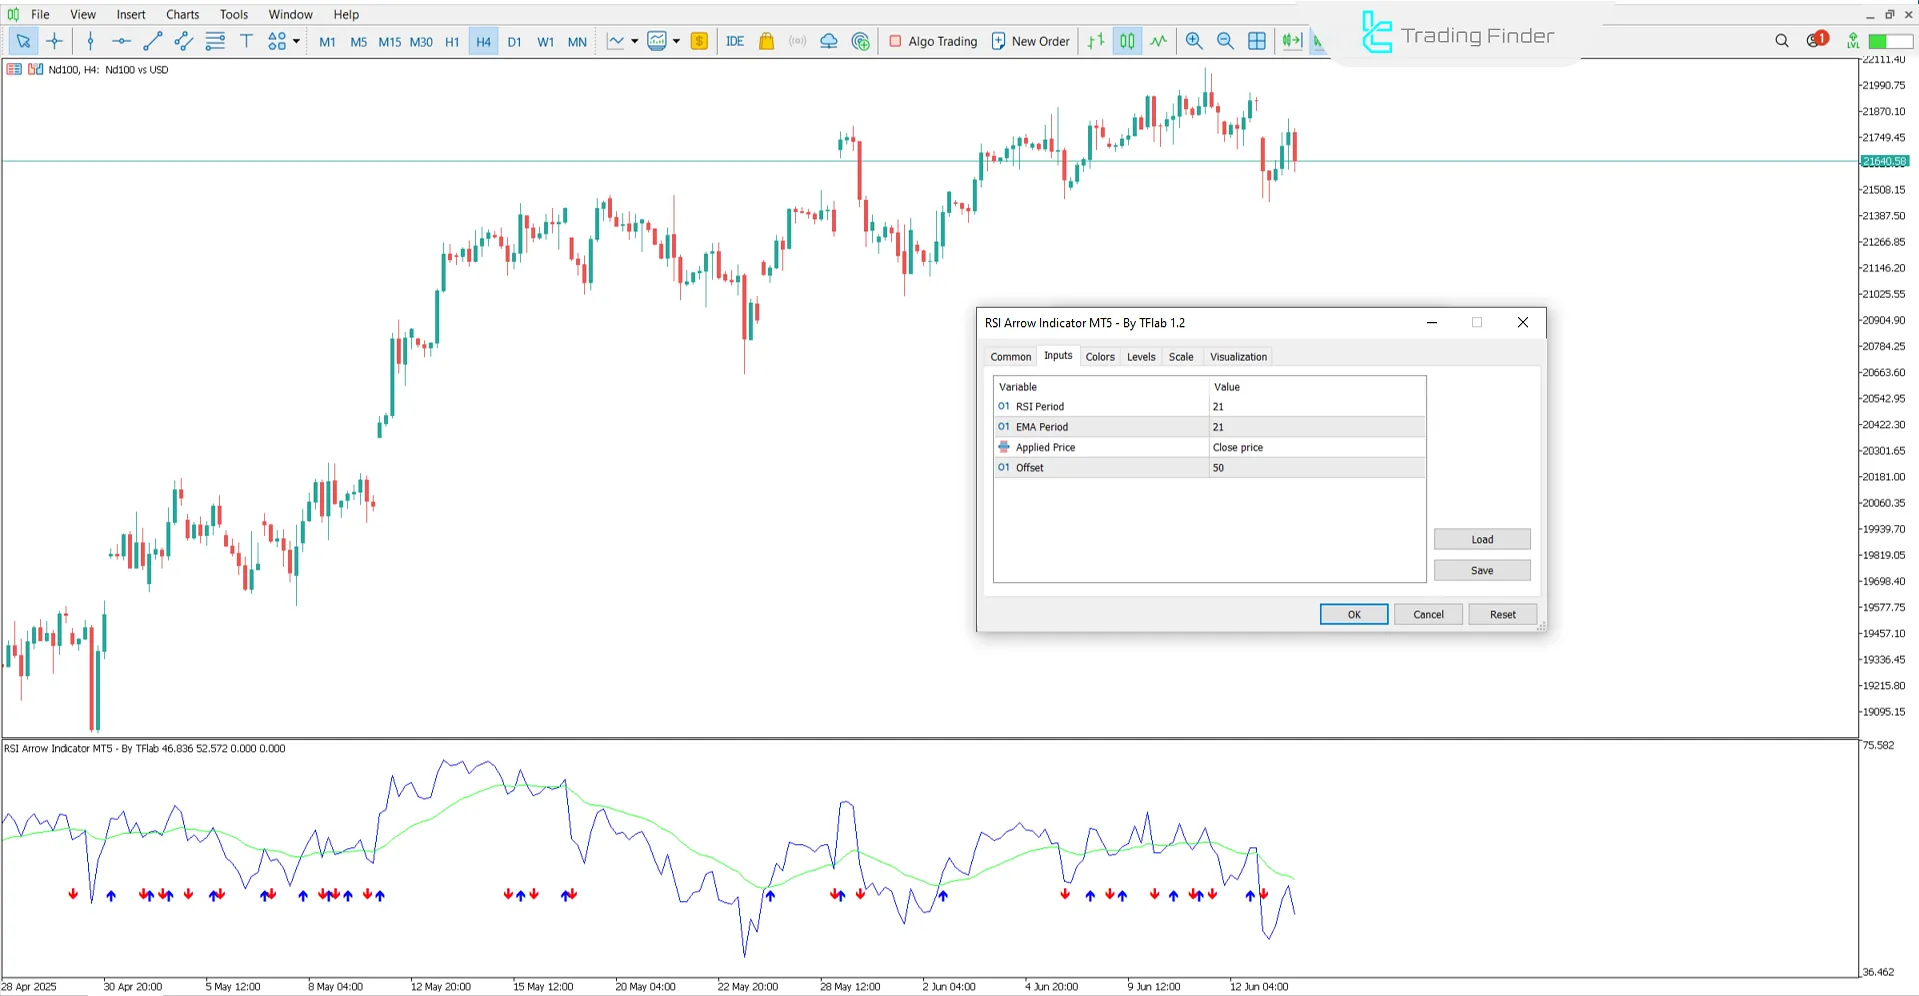
The image below shows the settings panel for the RSI Arrow Indicator:

- RSI Period: RSI calculation period;
- EMA Period: Exponential Moving Average period;
- Applied Price: The applied price type;
- Offset: Timeshift.
Conclusion
The RSI Arrow Indicator is a functional tool in technical analysis, combining RSI and EMA to provide buy and sell signals using red and blue arrows.
This Binary oscillator is effective in detecting reversal points and identifying overbought and oversold levels.
RSI Arrow MT5 PDF
RSI Arrow MT5 PDF
Click to download RSI Arrow MT5 PDFWhat type of traders is the RSI Arrow Indicator suitable for?
This indicator is ideal for swing traders, and those focused on reversal points and trend changes.
In which markets can the RSI Arrow Indicator be used?
This oscillator is applicable in all markets with price volatility, such as Forex, cryptocurrency, stocks, and commodities.


