![RSI Divergence Indicator for MetaTrader 5 Download - Free - [TF Lab]](https://cdn.tradingfinder.com/image/105580/10-8-en-rsi-divergence-mt5.webp)
![RSI Divergence Indicator for MetaTrader 5 Download - Free - [TF Lab] 0](https://cdn.tradingfinder.com/image/105580/10-8-en-rsi-divergence-mt5.webp)
![RSI Divergence Indicator for MetaTrader 5 Download - Free - [TF Lab] 1](https://cdn.tradingfinder.com/image/2326/10-08-en-rsi-divergence-mt5-02-avif)
![RSI Divergence Indicator for MetaTrader 5 Download - Free - [TF Lab] 2](https://cdn.tradingfinder.com/image/2324/10-08-en-rsi-divergence-mt5-03-avif)
![RSI Divergence Indicator for MetaTrader 5 Download - Free - [TF Lab] 3](https://cdn.tradingfinder.com/image/2325/10-08-en-rsi-divergence-mt5-04-avif)
On June 22, 2025, in version 2, alert/notification functionality was added to this indicator
The RSI Divergence indicator is one of the MetaTrader 5 oscillators that automatically identifies divergences in the price chart. Like other divergence detection indicators, this indicator is an essential tool in trading strategies and is very useful for identifying reversal points.
It detects positive divergences (D+) at the troughs and negative divergences (D-) at the peaks without requiring manual chart analysis and displays the corresponding buy and sell signals on the chart. This oscillator can be used alongside various analytical styles, including classic, price action, and supply and demand.
Indicator Table
Indicator Categories: | Price Action MT5 Indicators Oscillators MT5 Indicators Signal & Forecast MT5 Indicators |
Platforms: | MetaTrader 5 Indicators |
Trading Skills: | Elementary |
Indicator Types: | Reversal MT5 Indicators |
Timeframe: | Multi-Timeframe MT5 Indicators |
Trading Style: | Swing Trading MT5 Indicators Scalper MT5 Indicators Day Trading MT5 Indicators Fast Scalper MT5 Indicators |
Trading Instruments: | Forex MT5 Indicators Crypto MT5 Indicators Stock MT5 Indicators Commodity MT5 Indicators Indices MT5 Indicators Forward MT5 Indicators Share Stock MT5 Indicators |
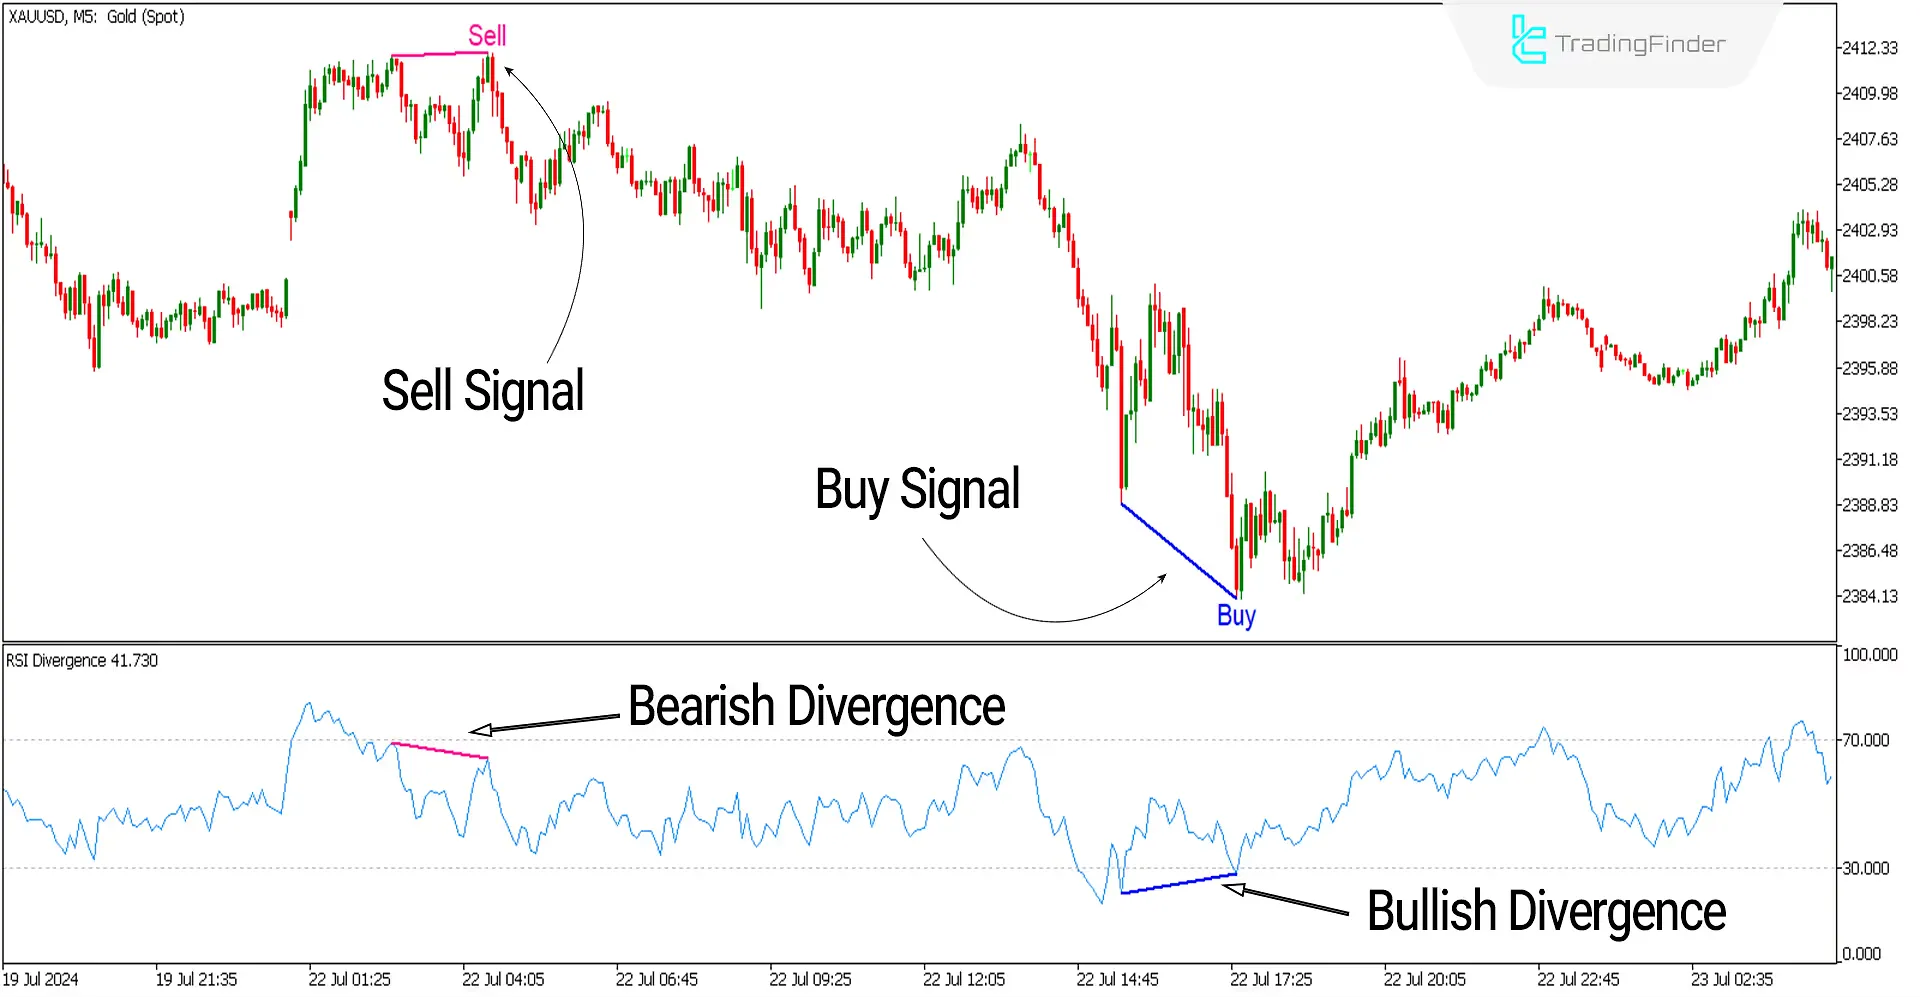
The image below shows the gold price chart against the US dollar with the symbol [XAUUSD] in a 5-minute timeframe. On the left side of the image, after an upward movement, we see the weakness of buyers at the end of the movement, and the indicator detects a bearish divergence between the peaks of the upward trend and displays a sell signal on the chart. Similarly, at the end of the same new downward trend, we observe the weakness of sellers, and the indicator detects a bullish divergence between the two troughs at the end of the downward trend, showing a buy signal on the chart.

Overview
Detecting divergences is crucial for determining whether trends continue or revert. The RSI indicator can identify bullish and bearish divergences on the price chart without the need for manual chart analysis and can be used alongside other analytical tools. Divergences are one of the strongest signals for trend reversals, so it is recommended that you use divergence detection tools alongside your trading strategy.
Uptrend Signals (Buy Positions)
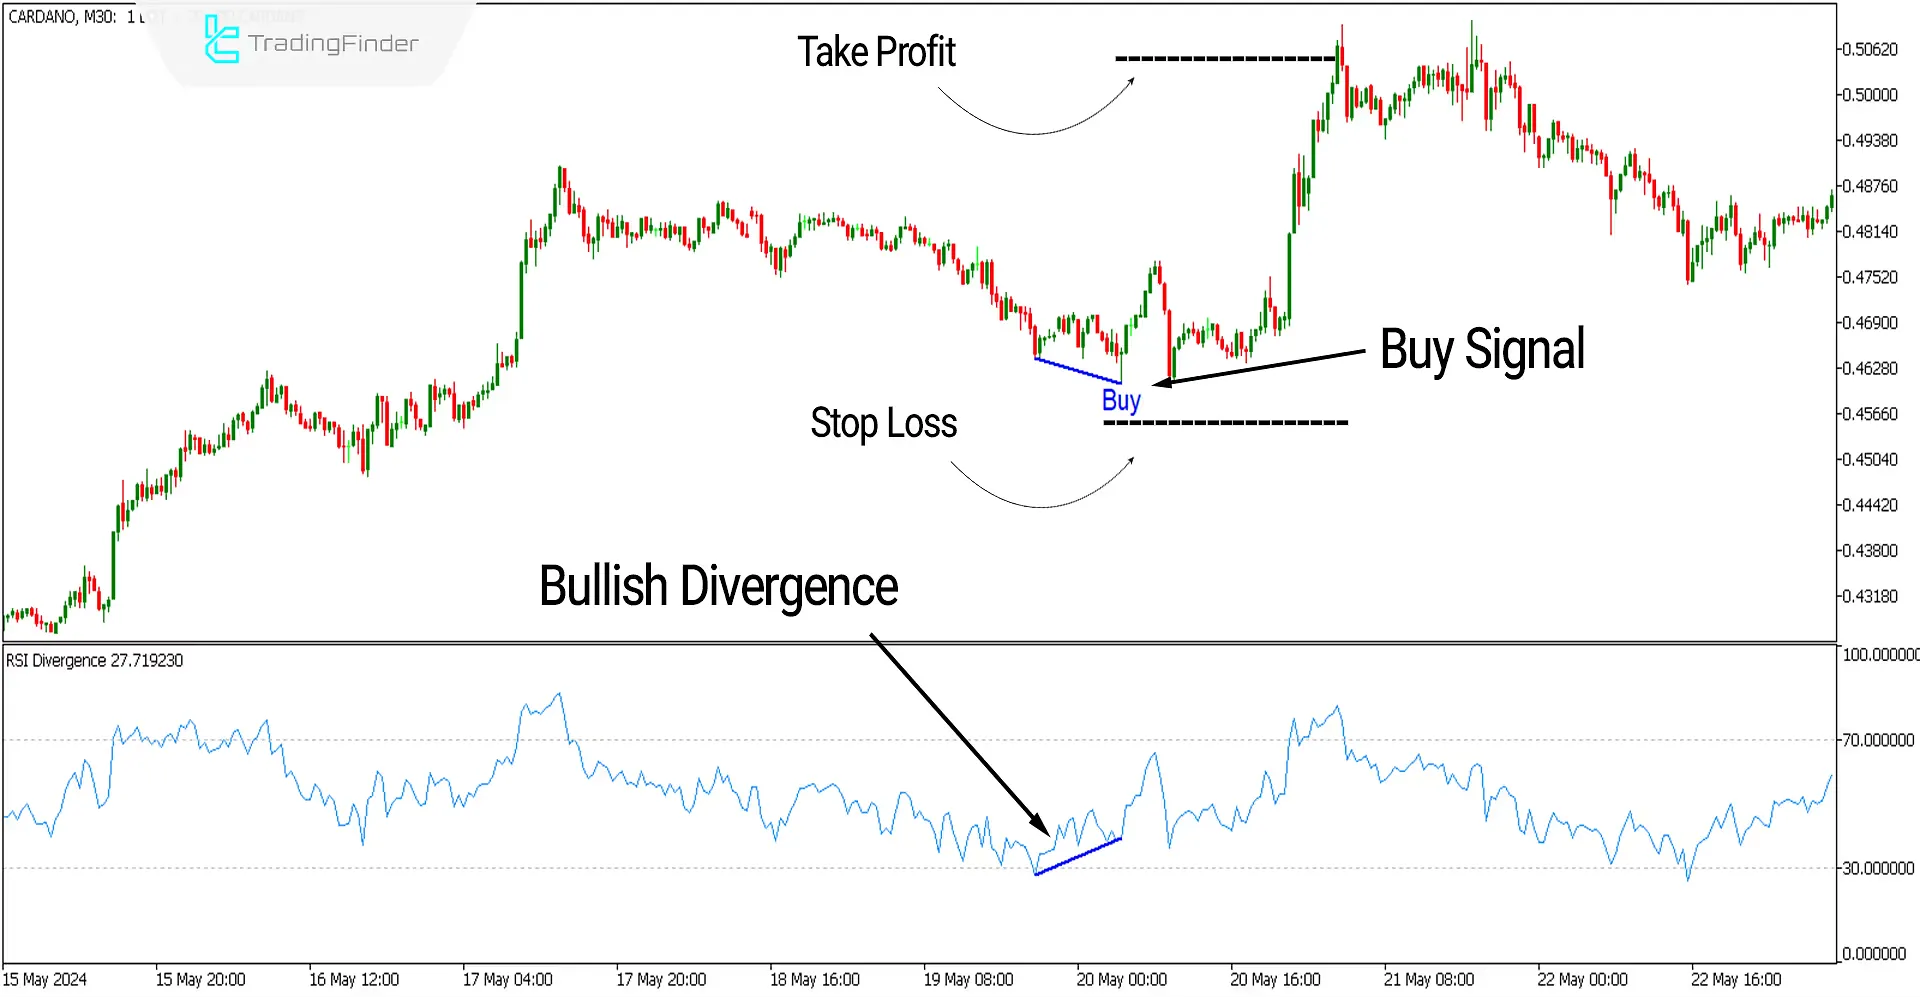
The image below shows the Cardano cryptocurrency price chart with the symbol (CARDANO) in a 30-minute timeframe. At the end of a downward correction, the indicator reaches below the level of 30 (oversold), and we observe a positive divergence (RD+) at the end of the correction. The indicator displays a buy signal (BUY) on the price chart. A suitable buying opportunity (Long) for Cardano buyers is created in this situation.
Take Profit and Stop Loss for Buy Signals
The take profit can be set at a price reaching the overbought zone, and the stop loss can be placed near the last trough at the end of the correction.

Downtrend Signals (Sell Positions)
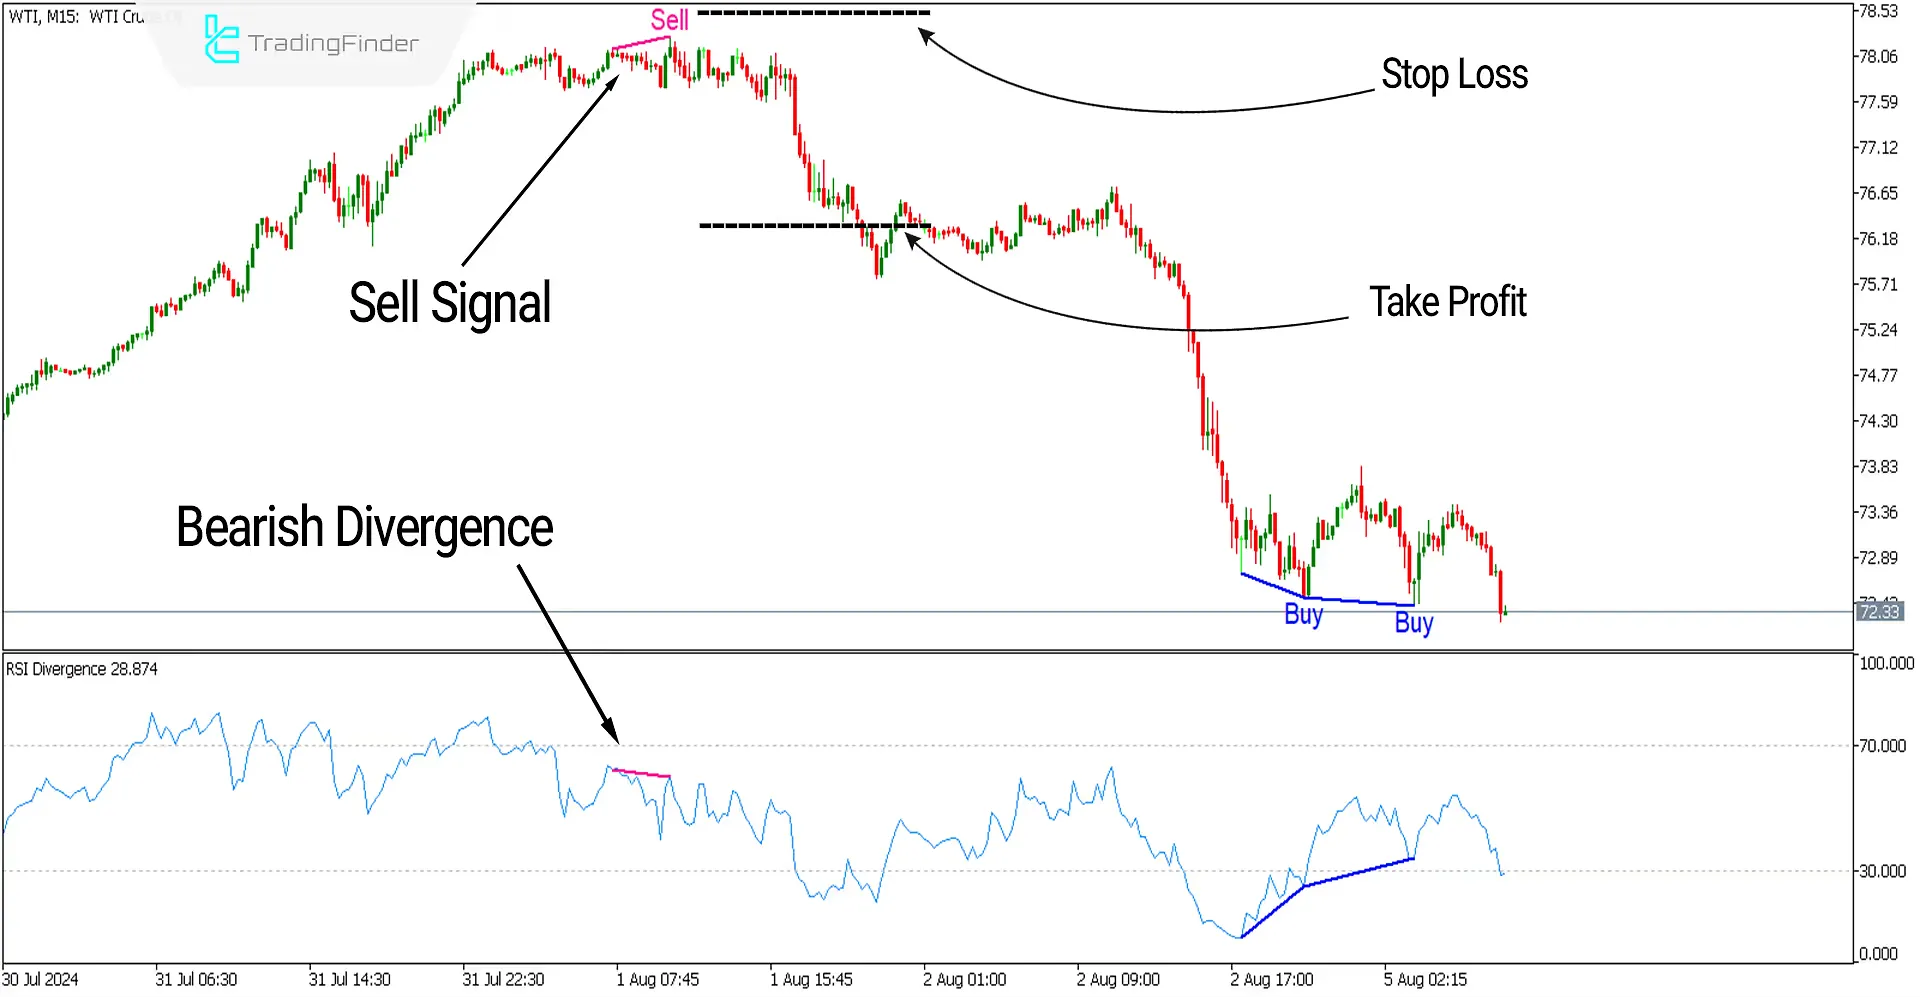
The image below shows the West Texas Oil price chart with the symbol (WTI) in a 15-minute timeframe. At the end of an upward trend, the indicator reaches above the level of 70 (overbought), and we observe a negative divergence (RD-) at the end of the trend, with the indicator displaying a sell signal (Sell) on the price chart. A suitable selling opportunity (Short) for the oil symbol is created in this situation.
Take Profit and Stop Loss for Sell Signals
The take profit can be set at a price reaching the oversold zone, and the stop loss can be placed near the last peak of the upward trend.

Settings of the RSI Divergence Indicator

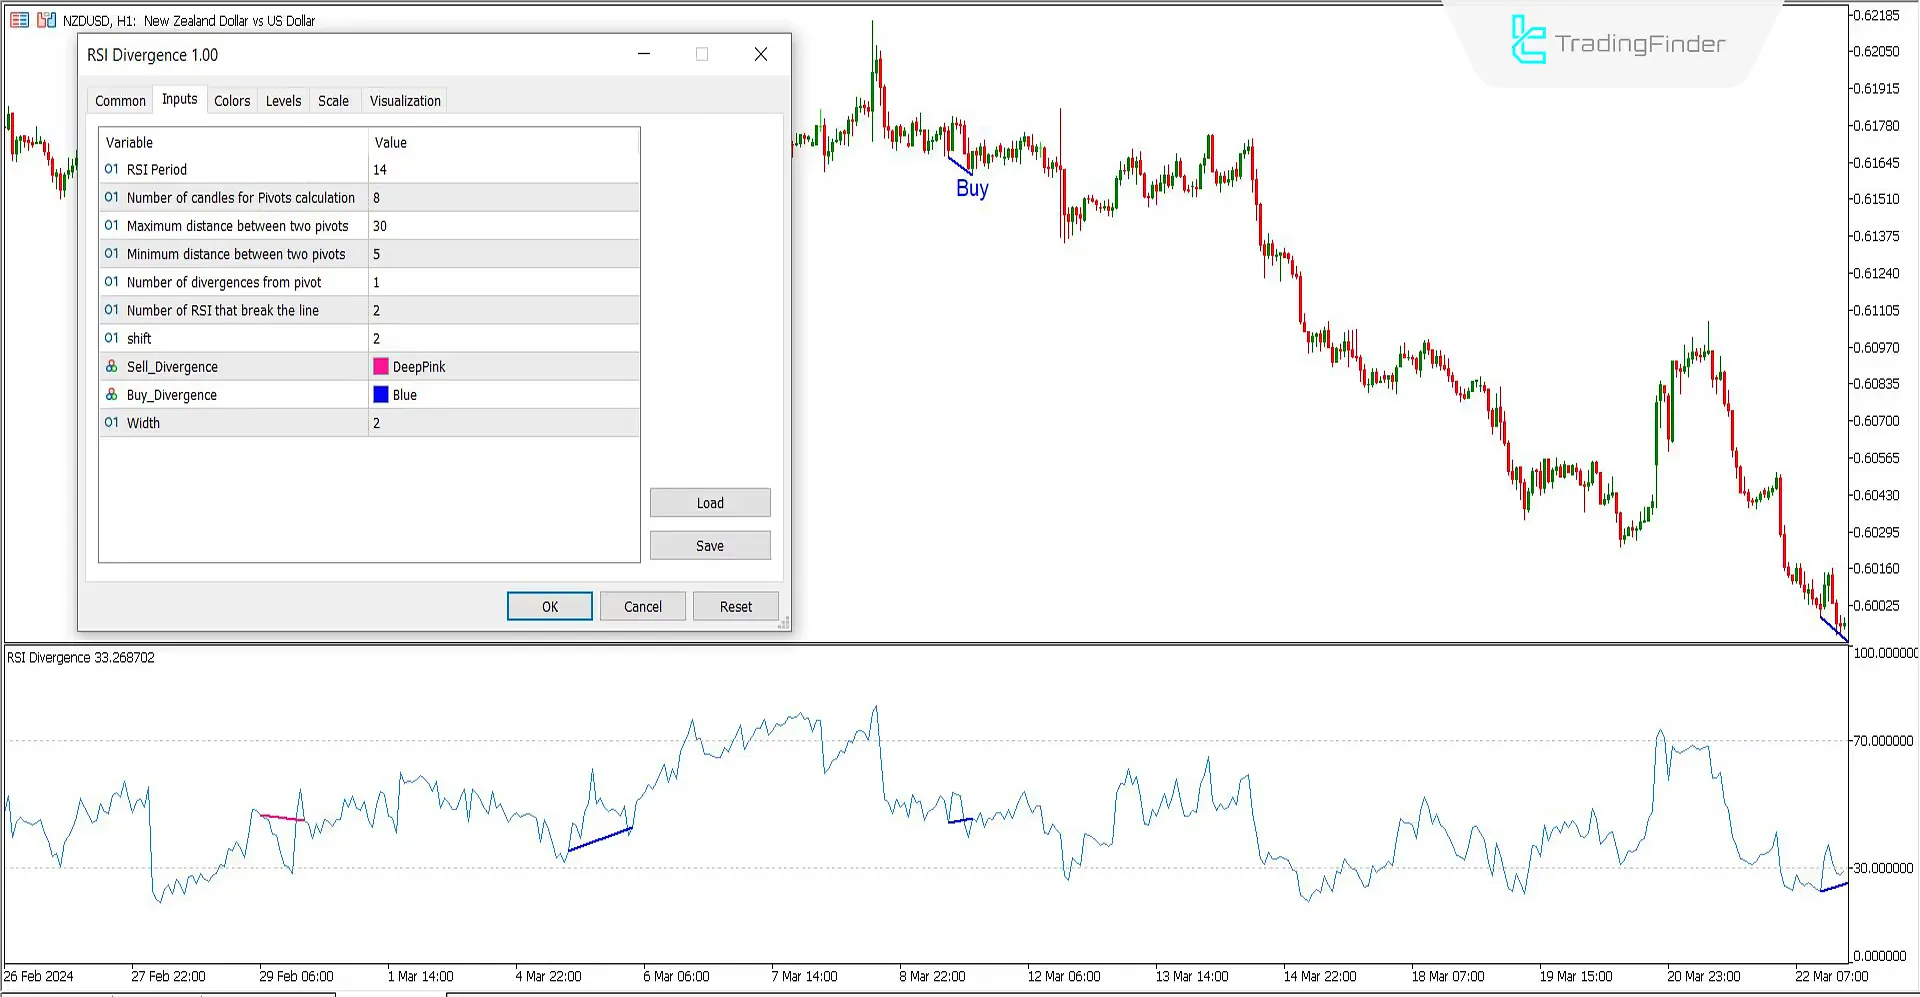
- RSI Period: The RSI period is set to 14
- Number of candles for Pivots calculation: The number for pivot calculation is set to 8
- Maximum distance between two pivots: The maximum distance between two pivots is 30
- Minimum distance between two pivots: The minimum distance between two pivots is 5
- Number of divergences from pivot: The number of divergences from each pivot is 1
- Number of RSI that break the line: The number of RSI line breaks is set to 2
- Shift: The shift is set to 2
- Sell_Divergence: Set the color for sell signals to pink or any color you choose
- Buy_Divergence: Set the color for buy signals to blue or any color you choose
- Width: The width of the divergence line can be set to 2
Conclusion
The RSI Divergence oscillator, like the MACD Divergence detection oscillator, is an essential tool that should be used alongside any trading style and strategy. Correctly identifying trend reversal points using divergences can significantly increase the win rate of trades, so it is recommended to incorporate this Trading Assist into your trading strategy as a confirming factor.
RSI Divergence MT5 PDF
RSI Divergence MT5 PDF
Click to download RSI Divergence MT5 PDFWhen should we use RSI divergence?
RSI divergences are usually very effective at market trend reversal points. Traders use this indicator to identify suitable trade entry and exit points.
What is the use of the RSI Divergence oscillator?
This oscillator automatically shows divergences on the price chart and identifies reversal points.


