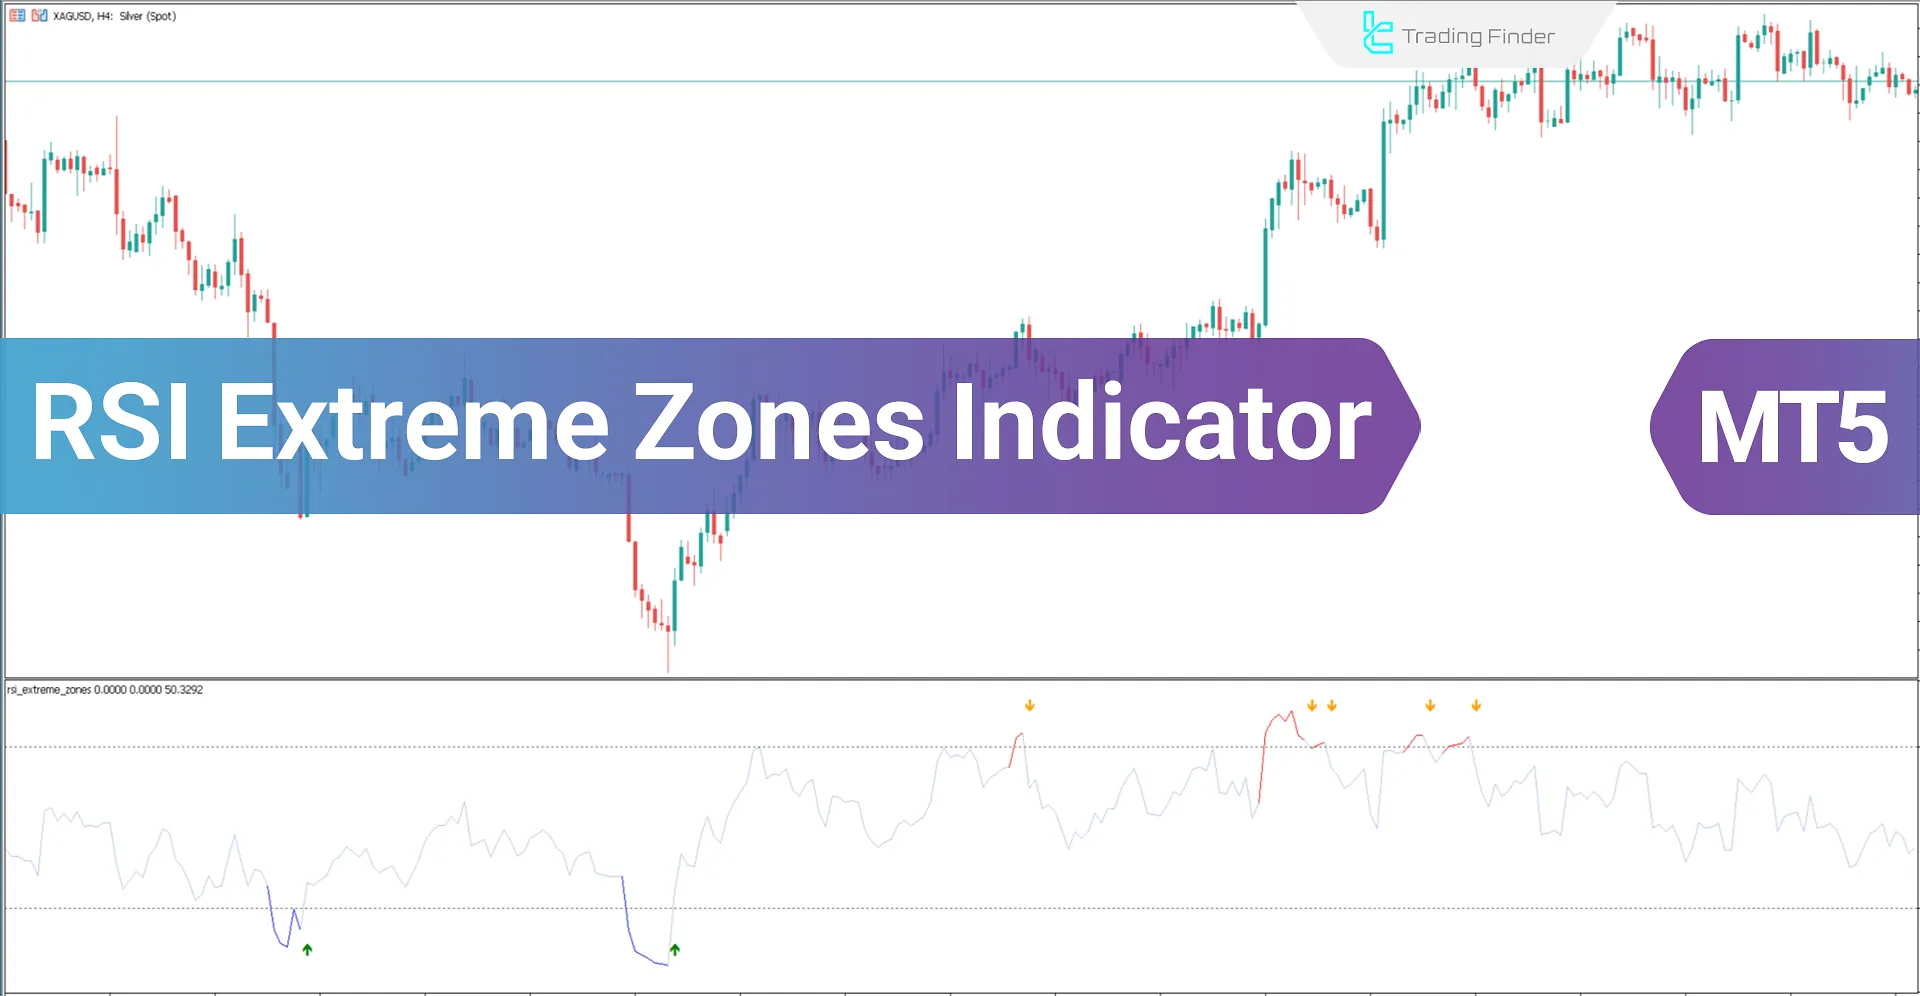


The RSI Extreme Zones (RSI EZ) is an advanced MetaTrader5 oscillator derived from the classic RSI designed for the MetaTrader 5 (MT5) platform. The RSI EZ indicator helps traders identify overbought (70) and oversold (30) levels.
When the price moves out of these zones, the indicator provides buy and sell signals, notifying traders of potential trend reversals at these critical points.
RSI Indicator Table
Indicator Categories: | Oscillators MT5 Indicators Signal & Forecast MT5 Indicators Trading Assist MT5 Indicators |
Platforms: | MetaTrader 5 Indicators |
Trading Skills: | Elementary |
Indicator Types: | Leading MT5 Indicators Reversal MT5 Indicators |
Timeframe: | Multi-Timeframe MT5 Indicators |
Trading Style: | Swing Trading MT5 Indicators Scalper MT5 Indicators Day Trading MT5 Indicators |
Trading Instruments: | Forex MT5 Indicators Crypto MT5 Indicators Stock MT5 Indicators Share Stock MT5 Indicators |
Indicator at a Glance
TheRSI Extreme Zones (RSI EZ) Indicator is a practical tool for traders seeking to identify overbought and oversold zones in the RSI oscillator.
This MetaTrader5 indicator changes color upon entering maximum saturation zones, alerting traders to these critical price areas and simplifying market condition analysis for more precise decision-making.
Oversold Zone

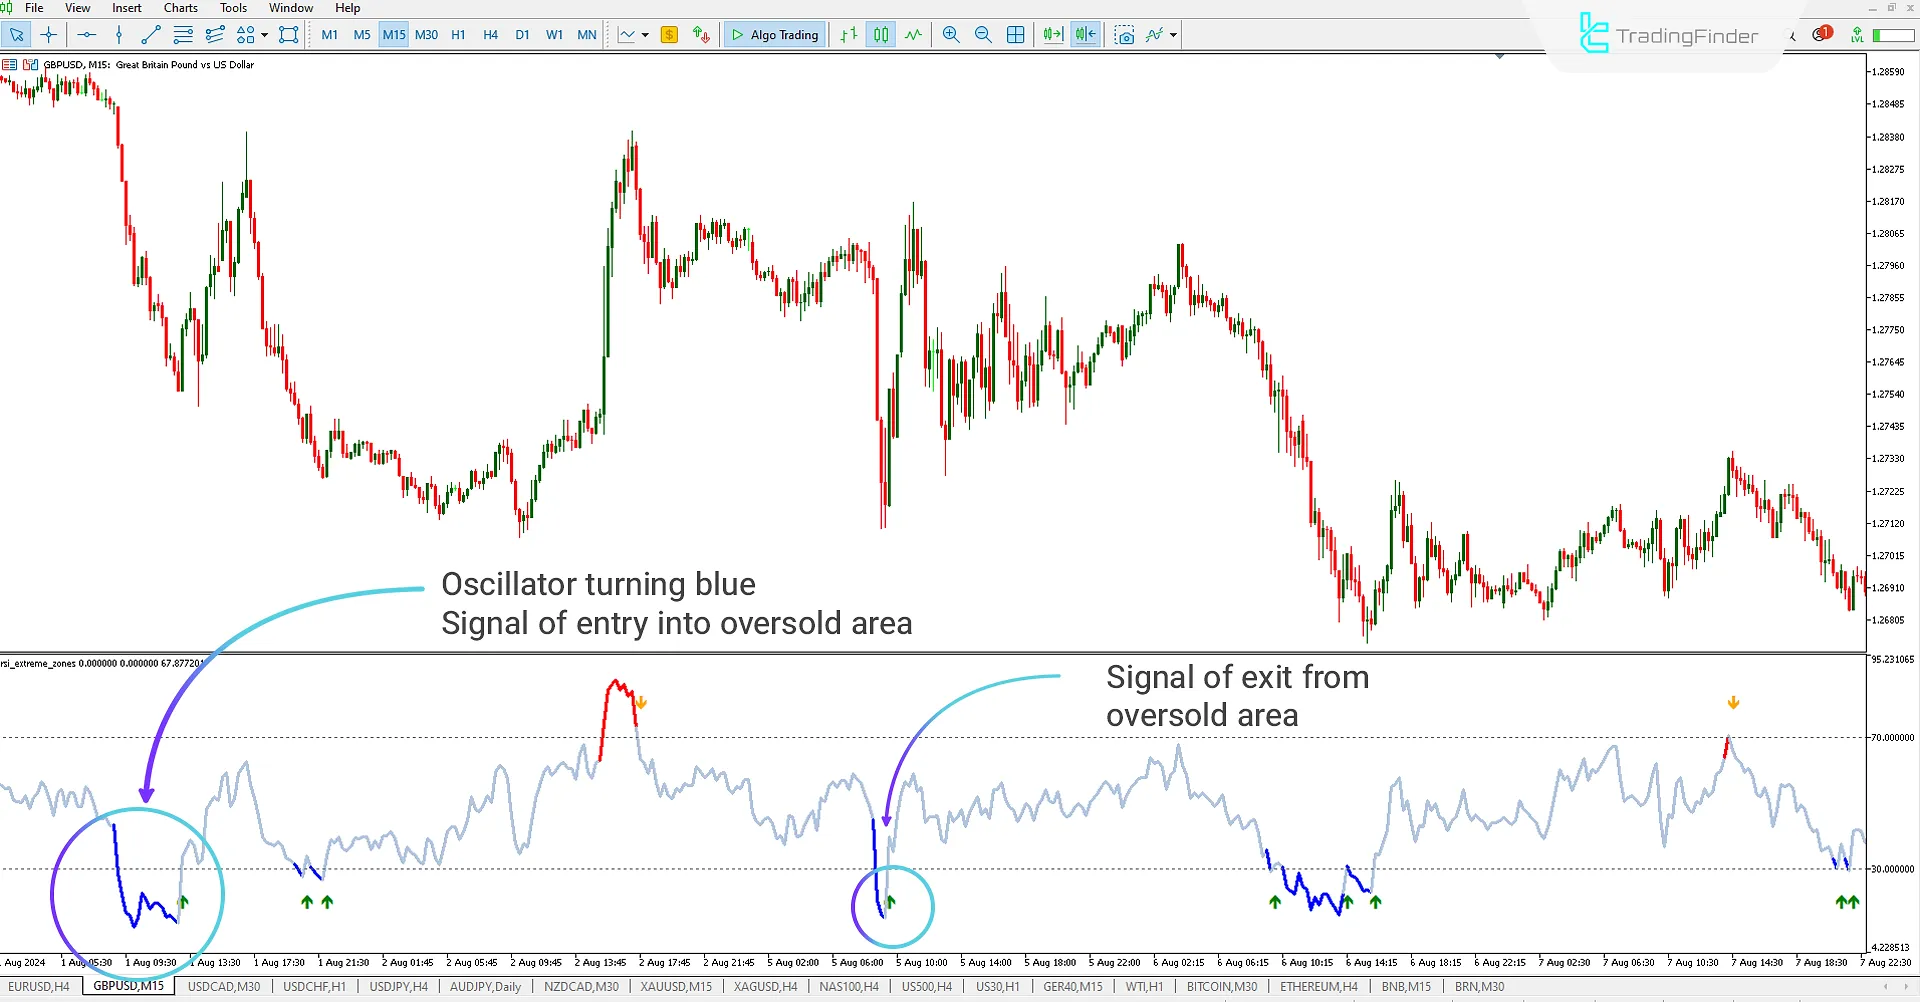
In the 15-minute GBP/USD chart, the RSI Extreme Zones (RSI EZ) indicator helps traders monitor the RSI oscillator closely. When the price enters the oversold zone (below 30), the oscillator turns blue, alerting traders to this condition. When the price moves back above the 30 level, the RSI EZ indicator indicates that the price has exited the oversold zone.
Overbought Zone

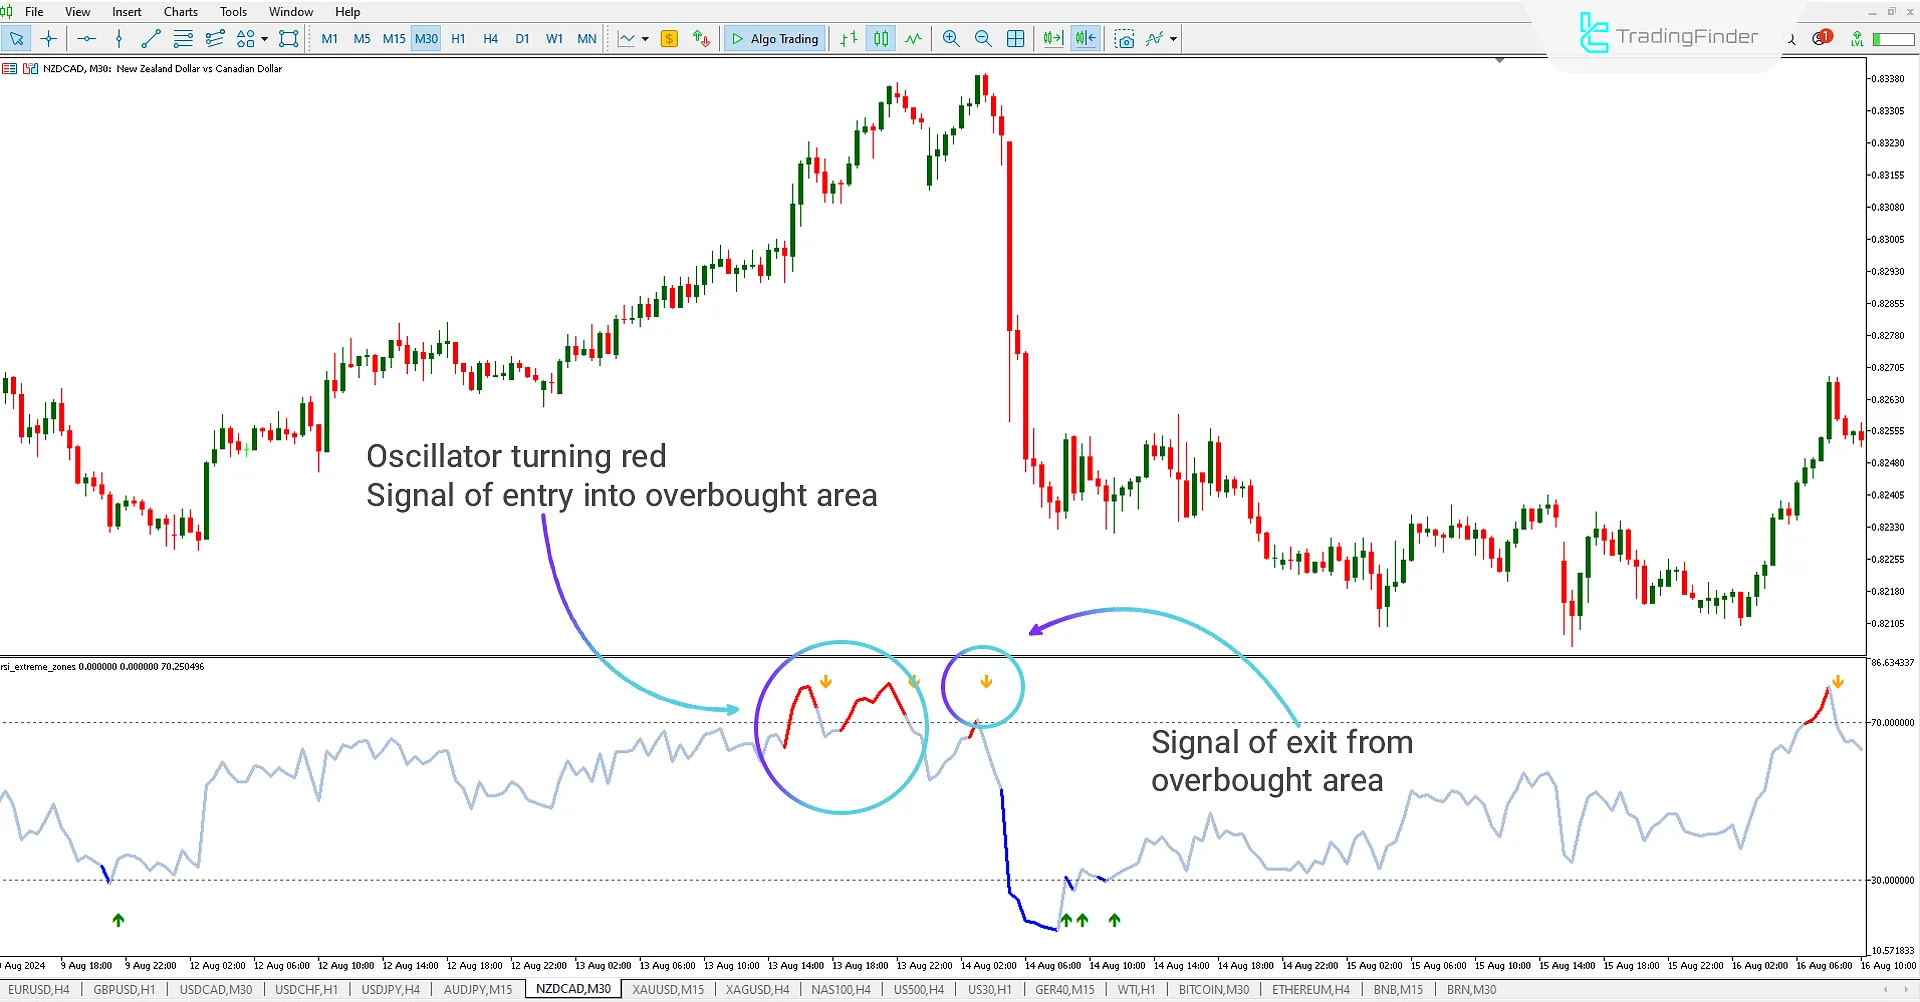
In the 30-minute NZD/CAD chart, the RSI EZ indicator helps traders track the RSI oscillator's position. When the price reaches the overbought zone (above 70), the oscillator turns red, signaling the entry into the overbought zone. When the price exits this area, the RSI EZ indicator displays a signal, alerting traders to a potential reversal.
RSI Indicator Settings

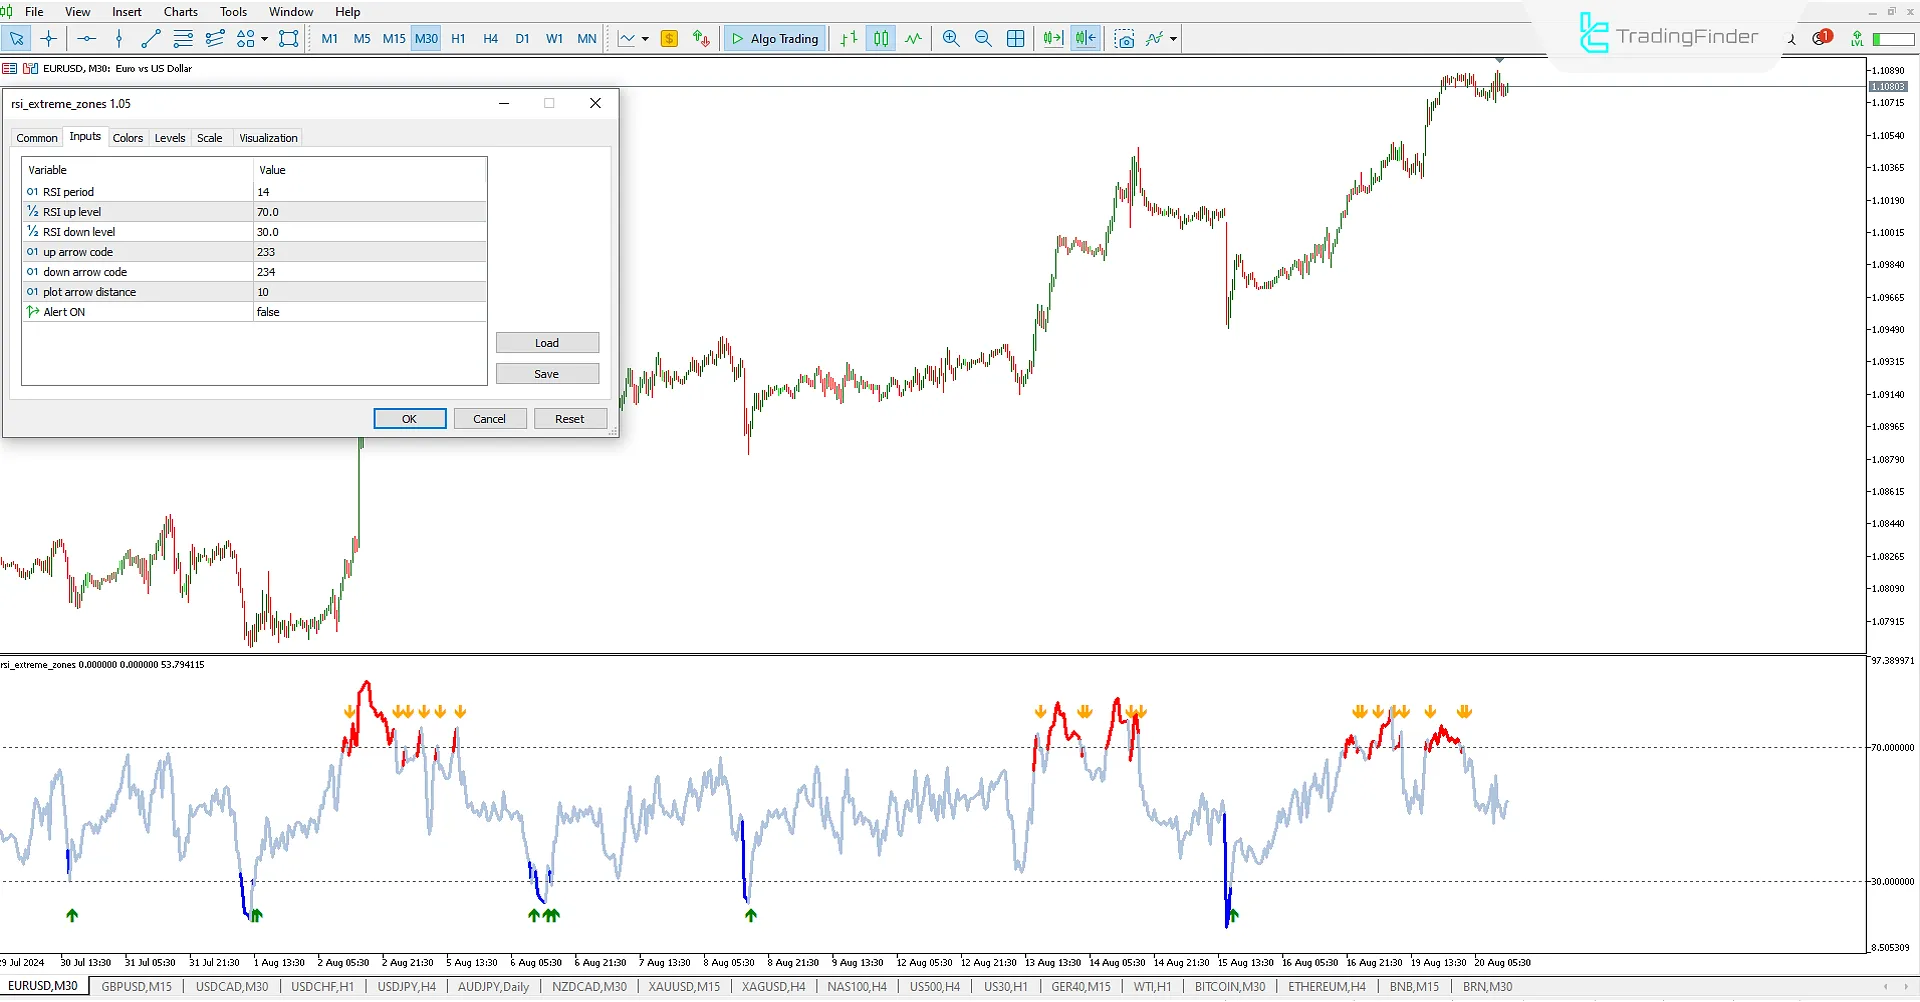
- RSI Period: Set the RSI period to 14
- RSI Up Level: Set the overbought level to 70
- RSI Down Level: Set the oversold level to 30
- Up Arrow Code: Select the signal arrow shape (233)
- Down Arrow Code: Select the signal arrow shape (234)
- Arrow Distance: Set the distance for signal arrows (10)
- Alert On: Enable or turn off signal alerts (default: false)
Summary
The RSI Extreme Zones (RSI EZ) indicator is a practical and efficient oscillator for traders who use the RSI to identify overbought and oversold zones. With its visual display of these zones and the signals provided when the price exits these areas, the Trading Tools effectively informs traders of essential market changes, helping them make better trading decisions.
RSI Extreme Zones indicator MT5 PDF
RSI Extreme Zones indicator MT5 PDF
Click to download RSI Extreme Zones indicator MT5 PDFWhat is the difference between the standard RSI and RSI Extreme Zones?
While the standard RSI only shows overbought (above 70) and oversold (below 30) levels, the RSI Extreme Zones indicator highlights these areas more clearly. It provides signals that indicate a potential trend reversal.
How can traders use the signals from the RSI Extreme Zones indicator?
When the RSI enters one of the extreme zones (e.g., above 70 or below 30), it can signal a potential trend reversal. Traders can use these signals to decide when to enter or exit trades.


