![RSI Heatmap Indicator for MetaTrader5 - Free Download – [Trading Finder]](https://cdn.tradingfinder.com/image/106535/10-14-en-rsi-heatmap-mt5.webp)
![RSI Heatmap Indicator for MetaTrader5 - Free Download – [Trading Finder] 0](https://cdn.tradingfinder.com/image/106535/10-14-en-rsi-heatmap-mt5.webp)
![RSI Heatmap Indicator for MetaTrader5 - Free Download – [Trading Finder] 1](https://cdn.tradingfinder.com/image/36246/10-14-en-rsi-heatmap-mt5-02.avif)
![RSI Heatmap Indicator for MetaTrader5 - Free Download – [Trading Finder] 2](https://cdn.tradingfinder.com/image/36245/10-14-en-rsi-heatmap-mt5-03.avif)
![RSI Heatmap Indicator for MetaTrader5 - Free Download – [Trading Finder] 3](https://cdn.tradingfinder.com/image/36247/10-14-en-rsi-heatmap-mt5-04.avif)
The RSI Heatmap Indicator is a MetaTrader 5 indicator that uses the Relative Strength Index (RSI) to calculate the strength of various currencies and their overbought and oversold zones.
It displays these zones as a heatmap panel in the bottom left corner of the chart. This heatmap gives a general idea of the direction of the price trend across different timeframes. It shows bullish conditions (buy trades) in green and bearish conditions (sell trades) in red.
Indicator Table
Indicator Categories: | Signal & Forecast MT5 Indicators Currency Strength MT5 Indicators Trading Assist MT5 Indicators Heatmap Indicators for MetaTrader 5 |
Platforms: | MetaTrader 5 Indicators |
Trading Skills: | Elementary |
Indicator Types: | Reversal MT5 Indicators |
Timeframe: | M1-M5 Timeframe MT5 Indicators M15-M30 Timeframe MT5 Indicators H1-H4 Timeframe MT5 Indicators |
Trading Style: | Swing Trading MT5 Indicators Scalper MT5 Indicators Day Trading MT5 Indicators |
Trading Instruments: | Forex MT5 Indicators Forward MT5 Indicators |
Overview
The RSI Heatmap Indicator can confirm and correctly identify trend direction in various trading strategies. This MetaTrader5 Currency Strength indicator can show the direction and strength of future trends of currency pairs by identifying overbought and oversold zones in different timeframes. Strong and weak bullish trends are shown in light green and green, respectively, while strong and weak bearish trends are shown in red and dark red.
Bullish Signal Conditions of the Indicator (Bullish Setup)
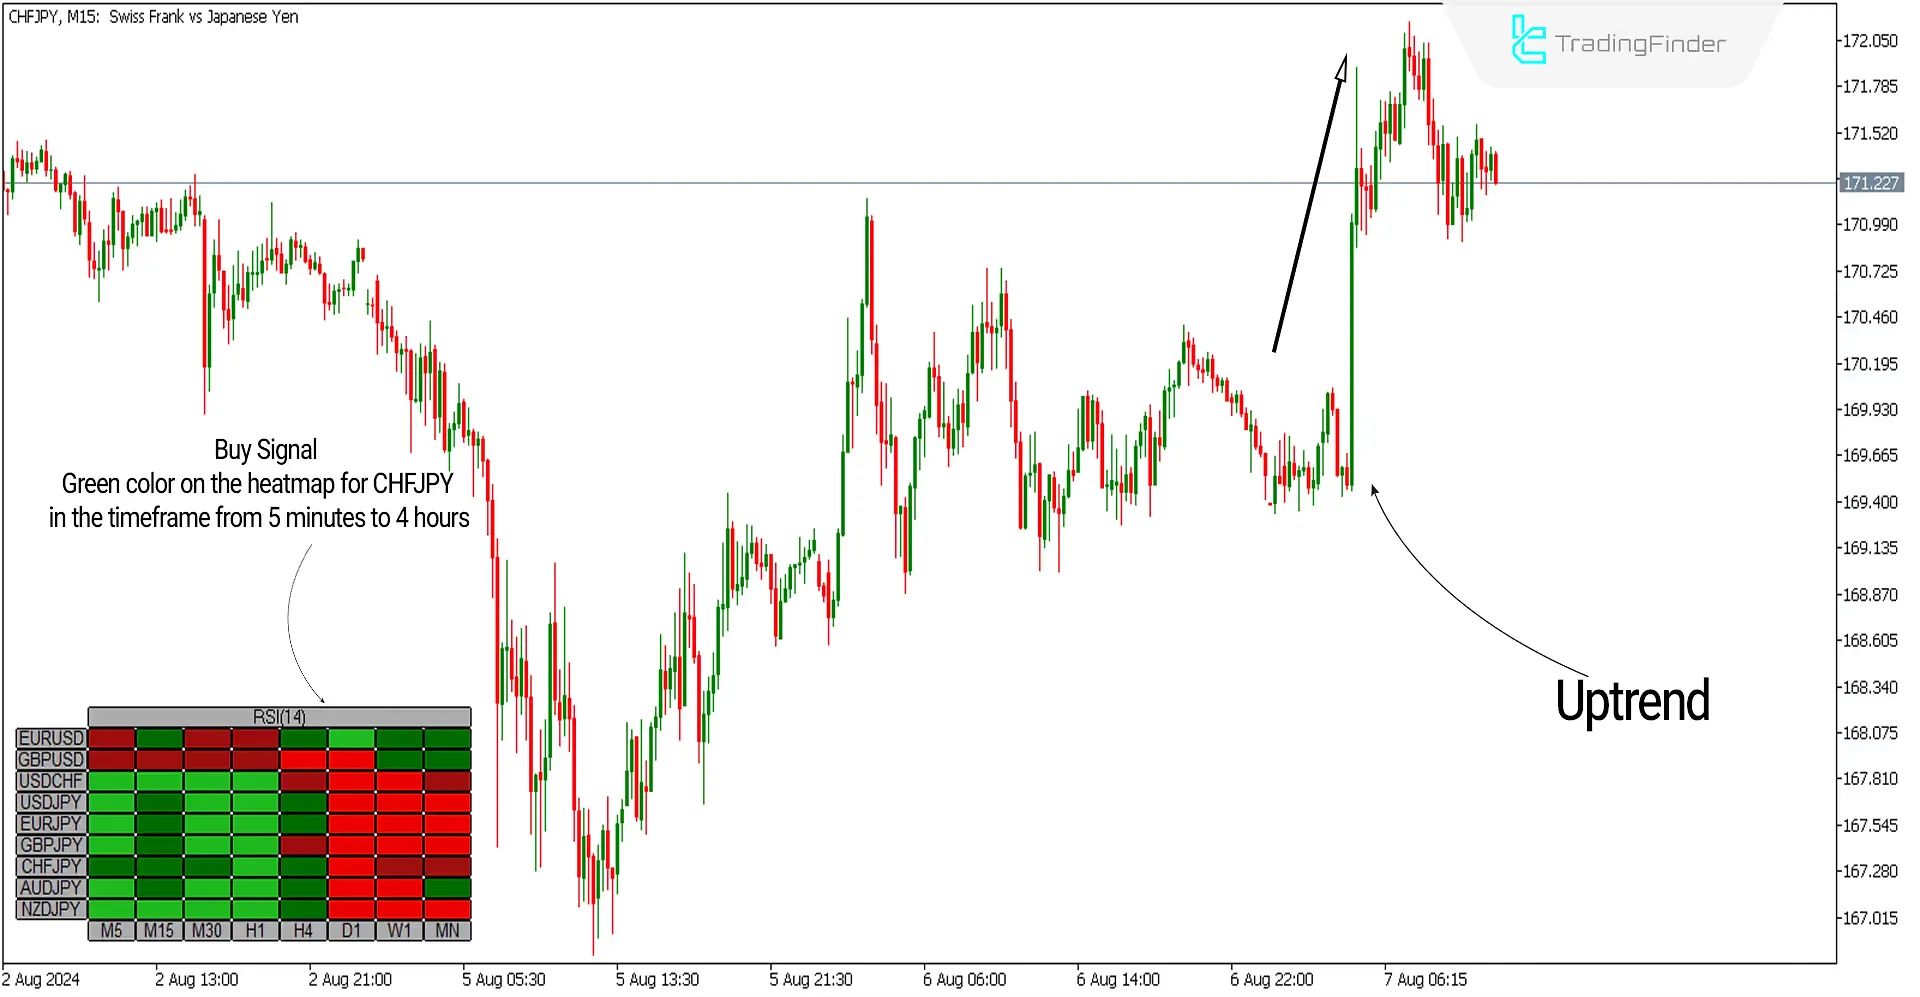
The chart of the CHF/JPY currency pair in the 15-minute timeframe is shown in the image below. In the heatmap, the timeframes from 5 minutes to 4 hours are displayed in green, indicating oversold conditions and a bullish trend in the short to medium term. Therefore, one can look for a trigger to enter buy trades in these timeframes.

Bearish Signal Conditions of the Indicator (Bearish Setup)
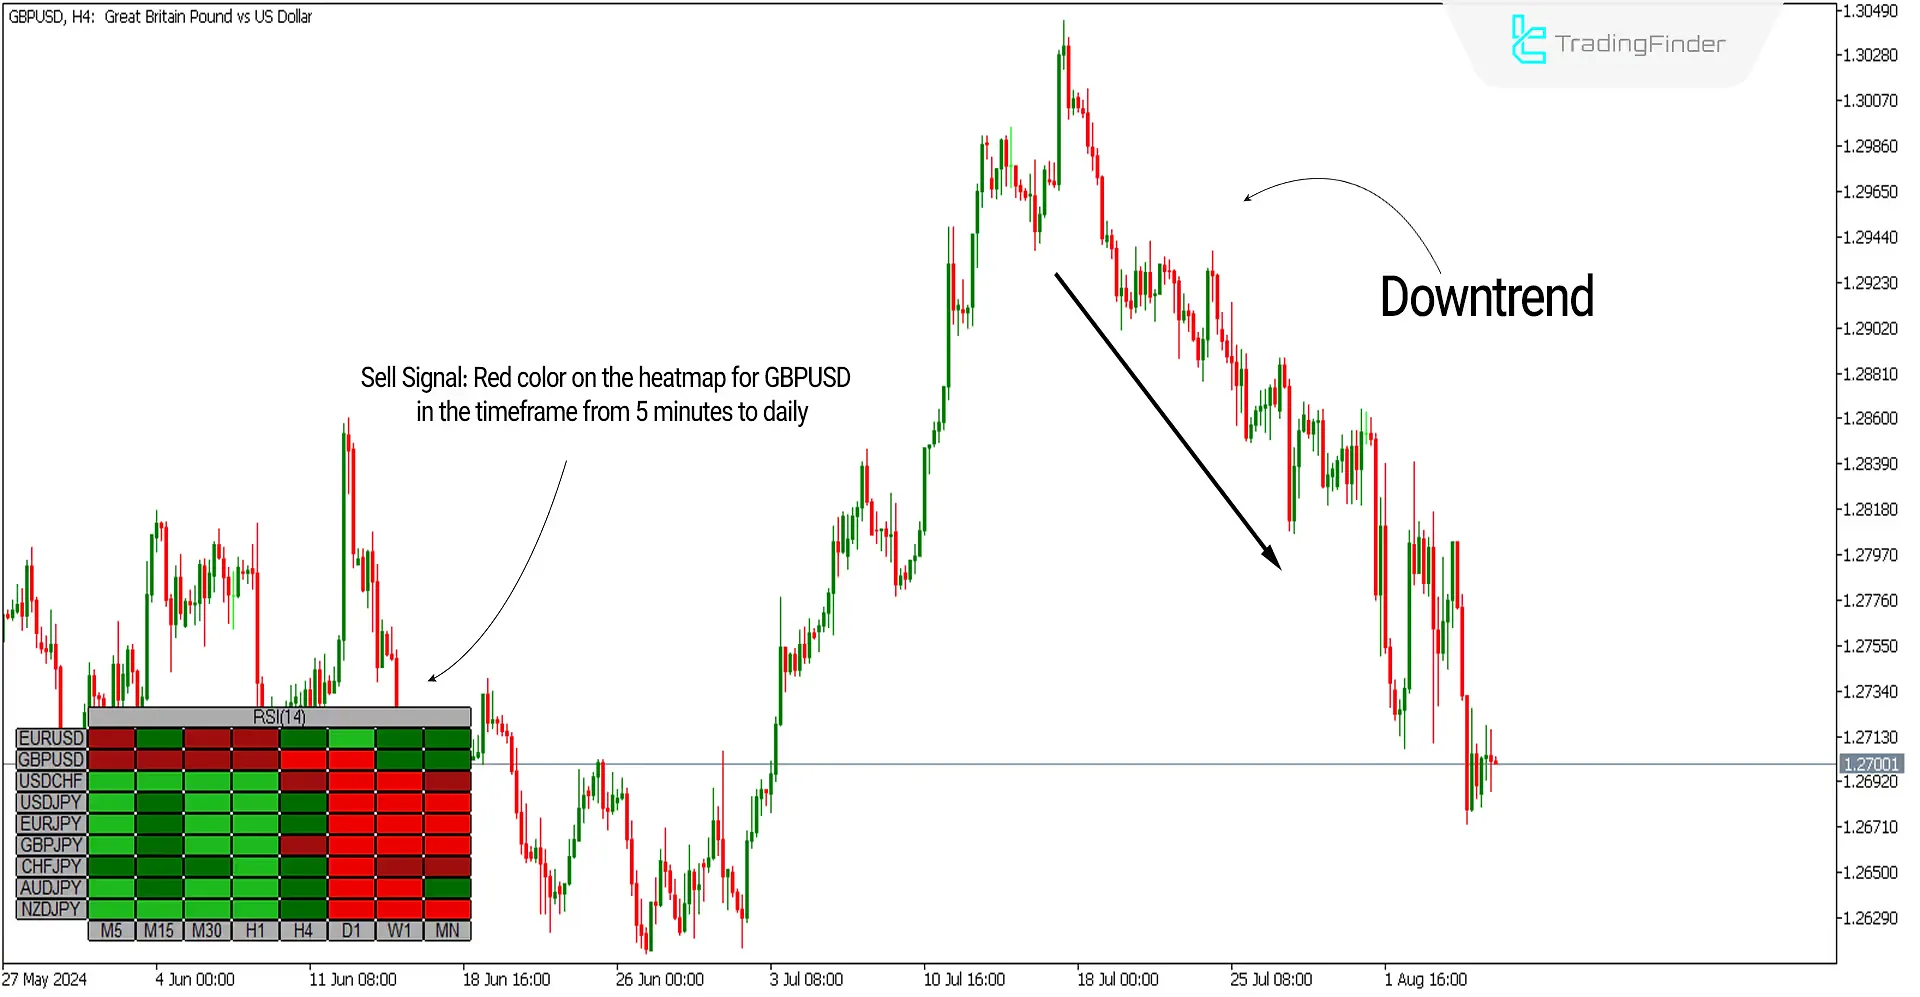
In the image below, the chart of the GBP/USD currency pair in the 4-hour timeframe is shown. In the heatmap, the timeframes from 5 minutes to daily are displayed in red, indicating overbought conditions and the start of a bearish trend in the medium to long term. Therefore, one can look for a trigger to enter sell trades in these timeframes.

RSI Heatmap Indicator Settings

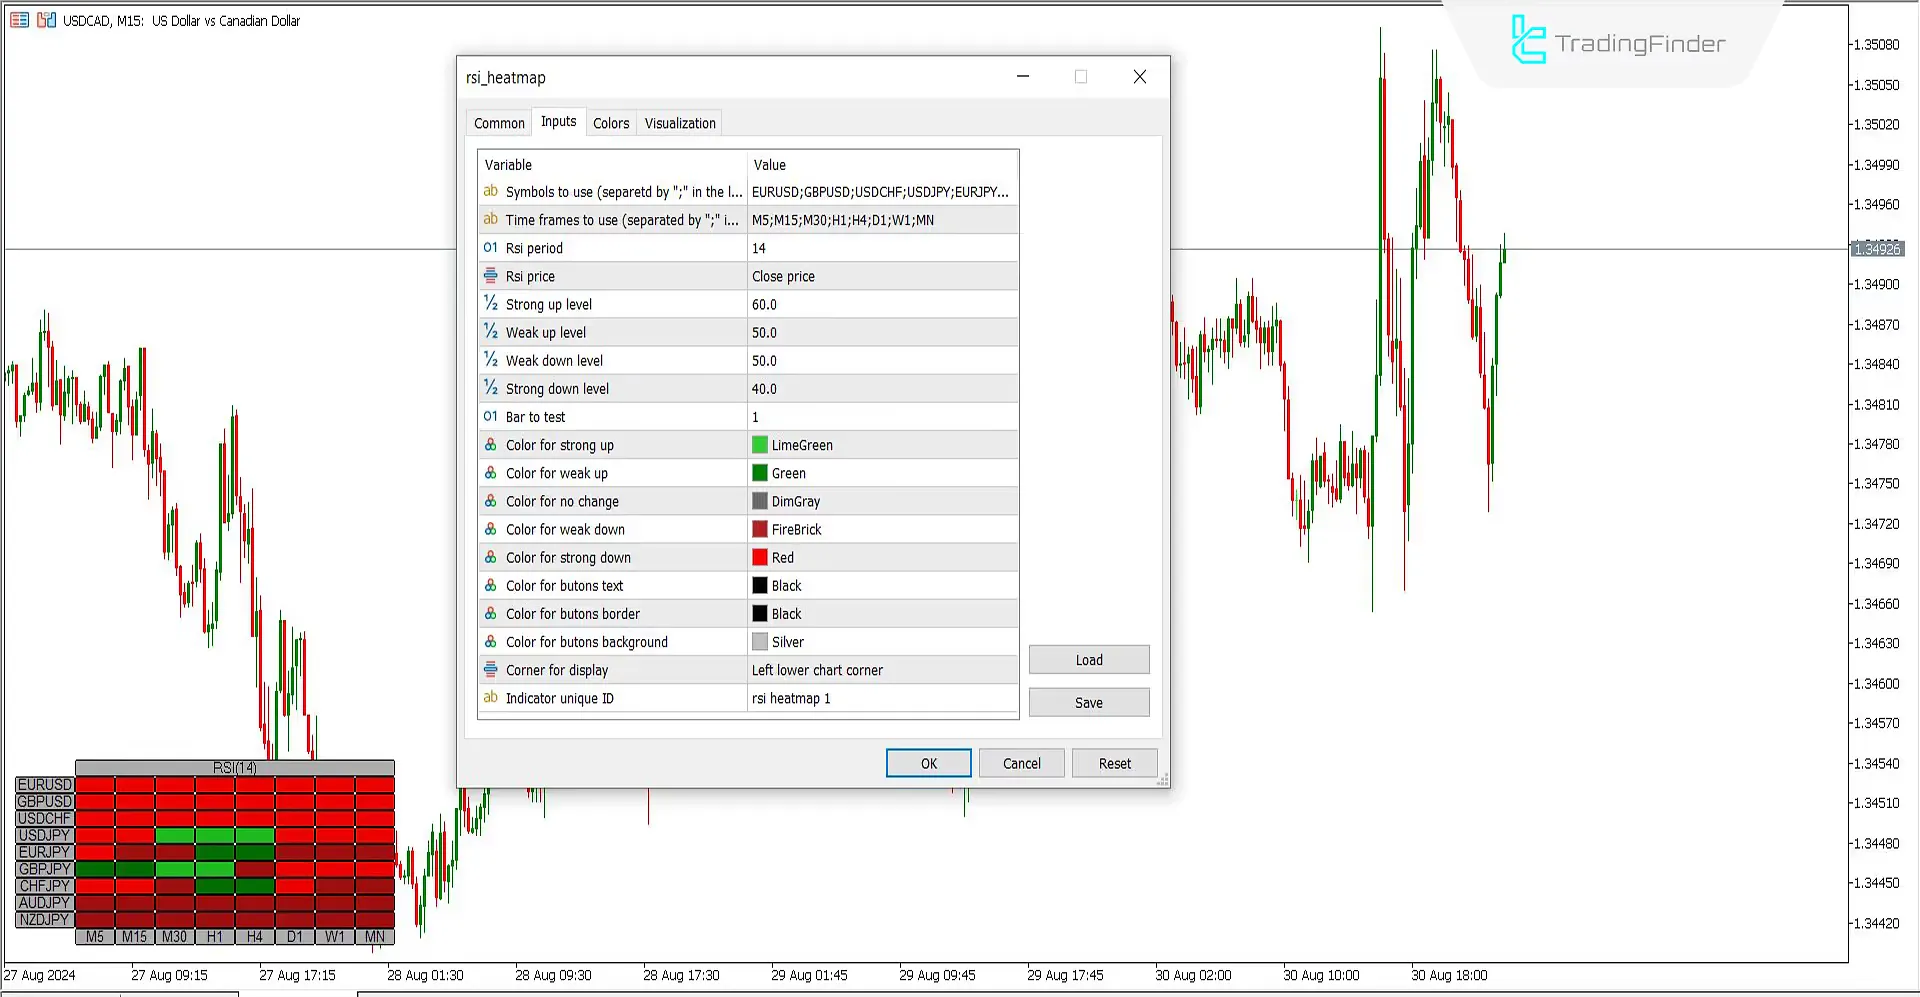
- Symbols to use: EURUSD, GBPUSD, USDCHF, USDJPY, EURJPY, GBPJPY, CHFJPY, AUDJPY, NZDJPY
- Time frames to use: M5, M15, M30, H1, H4, D1, W1, MN
- RSI period: 14
- RSI price: Based on Close Price
- Strong up level: 60 for a strong bullish trend
- Weak up level: 50 for a weak bullish trend
- Weak down level: 50 for a weak bearish trend
- Strong down level: 40 for a strong bearish trend
- Bar to test: RSI calculation based on the second to last candle
- Color for strong up: Light green for a strong bullish trend
- Color for weak up: Green for a weak bullish trend
- Color for no change: Gray for a neutral trend
- Color for weak down: Dark red for a weak bearish trend
- Color for strong down: Red for a strong bearish trend
- Color for buttons text: Black
- Color for buttons border: Black
- Color for buttons background: Gray
- Corner for display: Right upper chart corner
- Indicator unique ID: RSI Heatmap 1
Summary
Given the importance of identifying trend strength in daily trading, using the RSI Heatmap Indicator can confirm the correctness of trend identification in various strategies. This indicator allows the examination of the strength of currency pair trends across different timeframes and helps traders align their trades with the trend direction.
RSI Heatmap MT5 PDF
RSI Heatmap MT5 PDF
Click to download RSI Heatmap MT5 PDFHow does the RSI Heatmap show trend directions?
This indicator displays strong bullish trends in green and weak bullish trends in dark green. It also uses red for intense and dark red for weak bearish trends.
What is the use of the RSI Heatmap?
This indicator shows the trend strength status in a heatmap panel to help identify strong and weak trends.


