![RSI Levels Indicator for MetaTrader 5 Download - Free - [TradingFinder]](https://cdn.tradingfinder.com/image/317085/11-76-en-rsi-levels-mt5-01.webp)
![RSI Levels Indicator for MetaTrader 5 Download - Free - [TradingFinder] 0](https://cdn.tradingfinder.com/image/317085/11-76-en-rsi-levels-mt5-01.webp)
![RSI Levels Indicator for MetaTrader 5 Download - Free - [TradingFinder] 1](https://cdn.tradingfinder.com/image/317087/11-76-en-rsi-levels-mt5-02.webp)
![RSI Levels Indicator for MetaTrader 5 Download - Free - [TradingFinder] 2](https://cdn.tradingfinder.com/image/317078/11-76-en-rsi-levels-mt5-03.webp)
![RSI Levels Indicator for MetaTrader 5 Download - Free - [TradingFinder] 3](https://cdn.tradingfinder.com/image/317084/11-76-en-rsi-levels-mt5-04.webp)
The RSI Levels Indicator is one of the level indicators for MetaTrader 5, designed to plot seven lines, including three levels above and three levels below a central level.
Traders can use this indicator to identify potential price reaction levels and conduct more professional and specialized analysis on charts. This tool provides a structured view, improving technical analysis accuracy and trading decisions.
RSI Levels Indicator Table
Below are the general specifications of the RSI Levels Indicator:
Indicator Categories: | Price Action MT5 Indicators Volatility MT5 Indicators Levels MT5 Indicators RSI Indicators for MetaTrader 5 |
Platforms: | MetaTrader 5 Indicators |
Trading Skills: | Elementary |
Indicator Types: | Entry & Exit MT5 Indicators Reversal MT5 Indicators |
Timeframe: | Multi-Timeframe MT5 Indicators |
Trading Style: | Intraday MT5 Indicators Scalper MT5 Indicators Day Trading MT5 Indicators |
Trading Instruments: | Forex MT5 Indicators Stock MT5 Indicators Indices MT5 Indicators Share Stock MT5 Indicators |
Uptrend
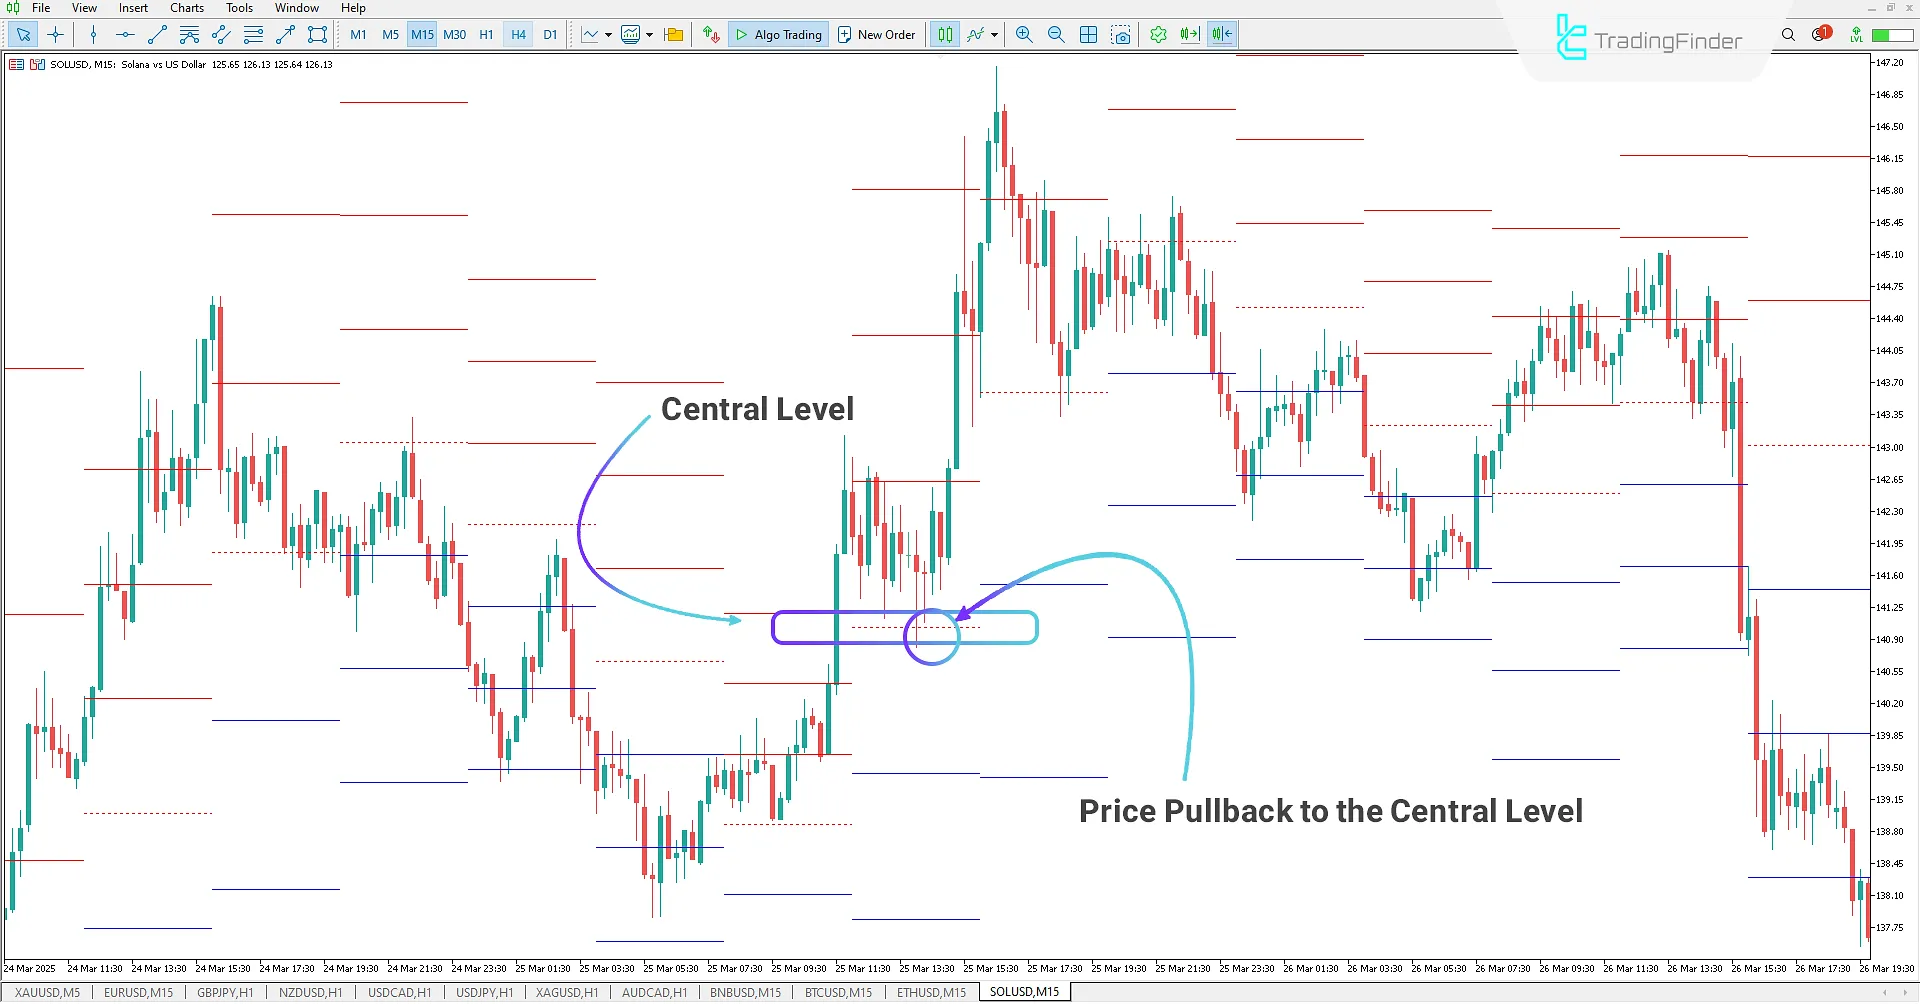
In the 15-minute chart of Solana, the price has broken the central level of the RSI Levels Indicator upwards. Traders can enter a buy trade when the price returns to this level.
As seen in the chart below, after testing the central level, the price moved strongly upwards with momentum. This behavior presents an opportunity for traders to take advantage of the uptrend.

Downtrend
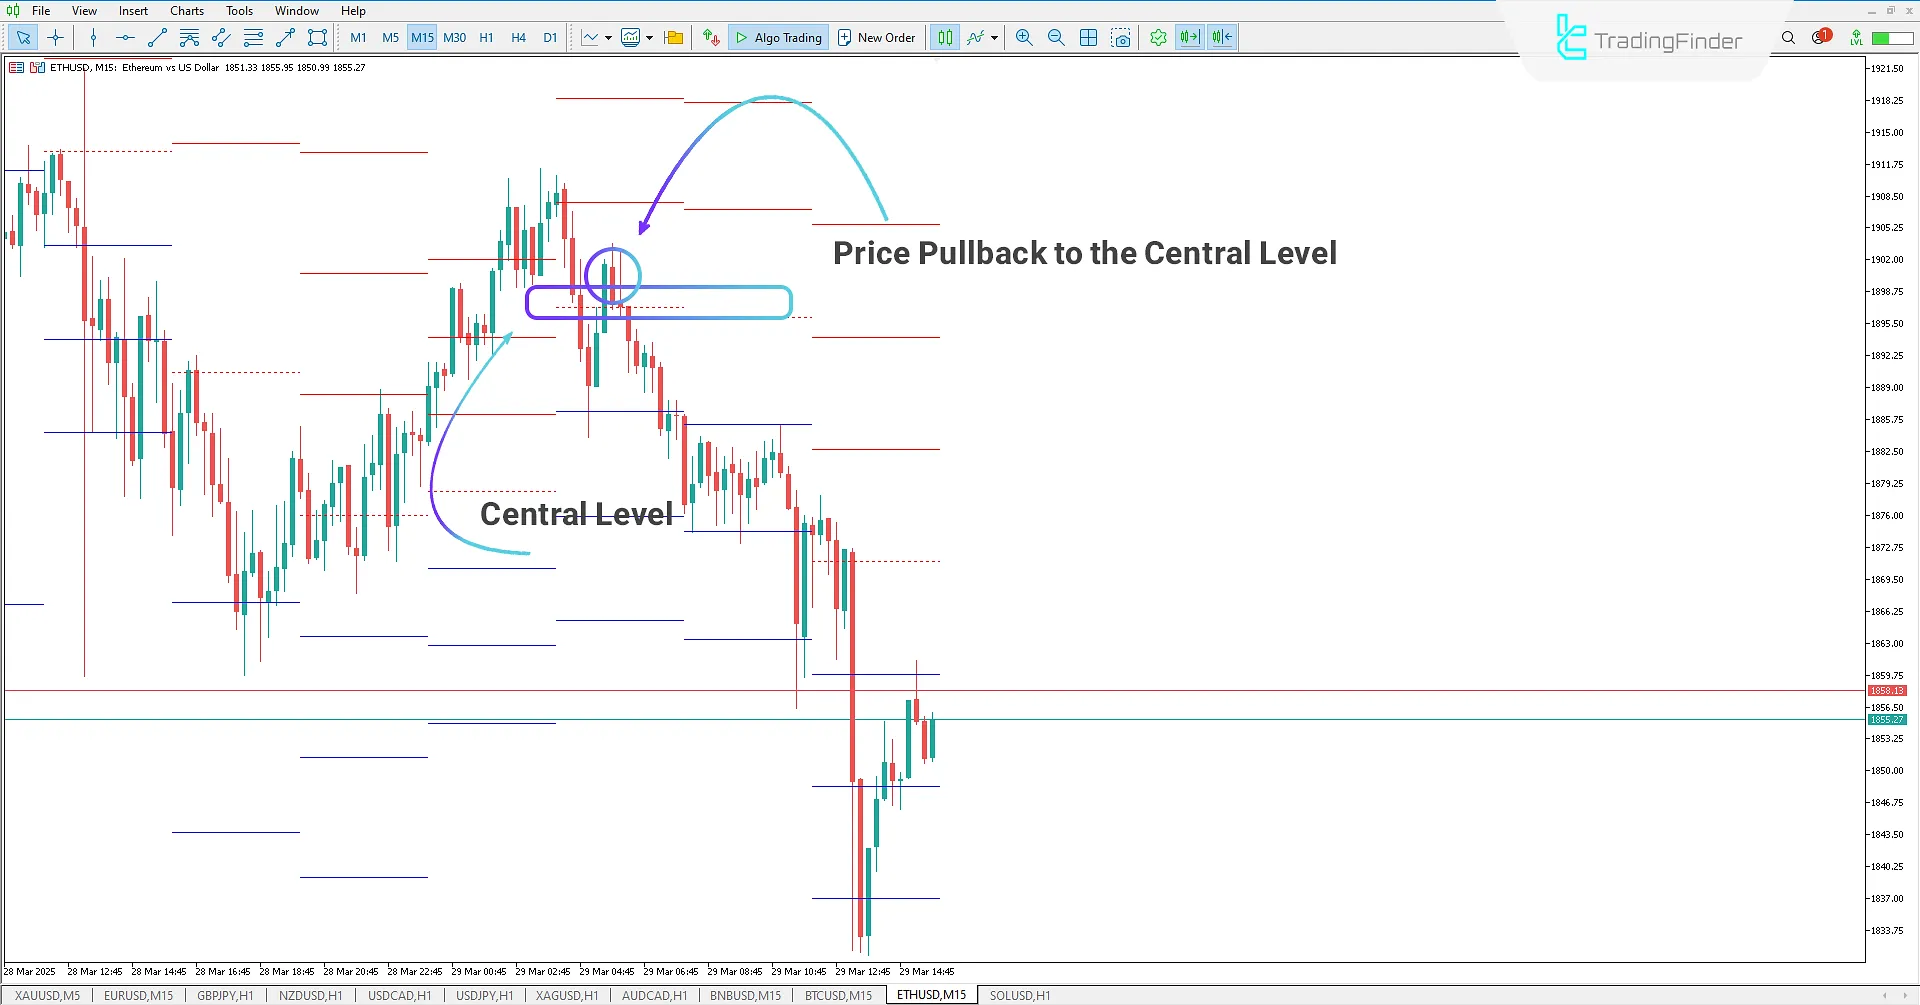
In the 15-minute Ethereum chart, the RSI Levels Indicator has successfully identified and plotted potential price reaction levels. After breaking the central level downwards, the price made a pullback to the central level before continuing its sharp downtrend.
Traders can enter a sell trade when testing this area and use the plotted levels as support or resistance for determining take profit and stop loss, enhancing trade accuracy and profitability.

RSI Levels Indicator Settings
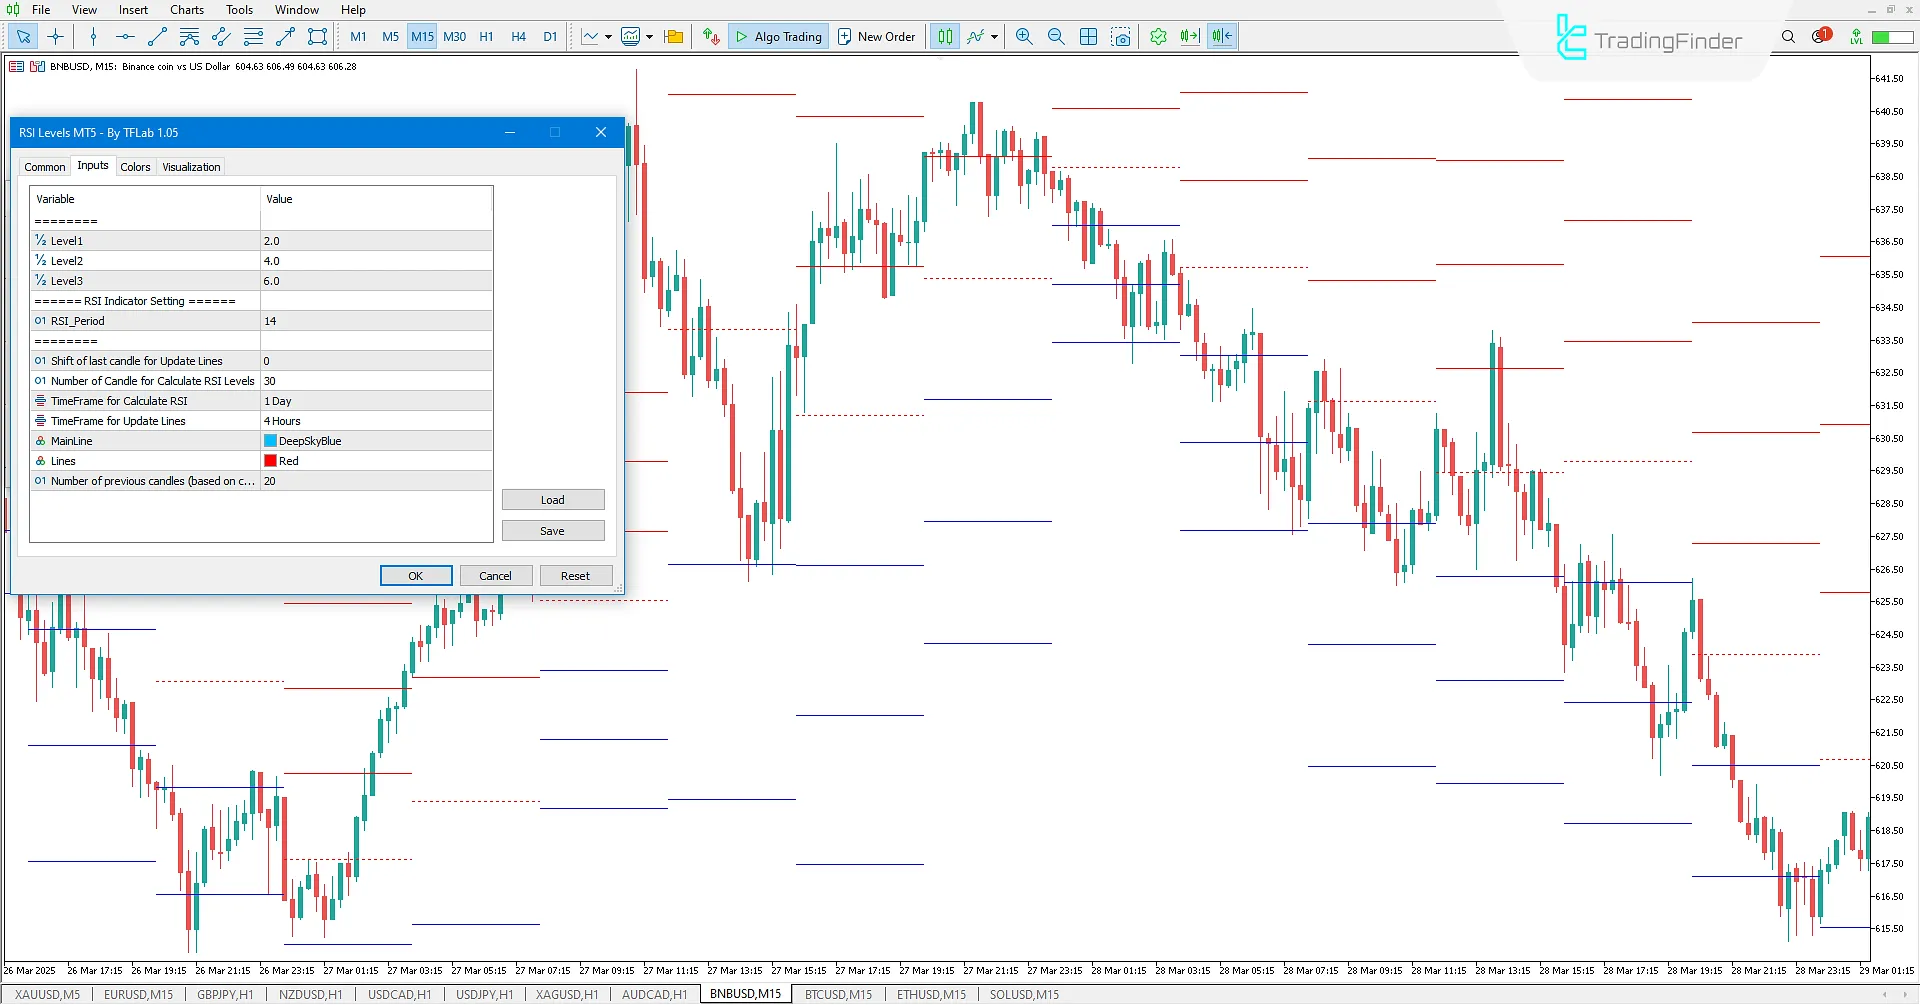
Below are the settings for the RSI Levels Indicator:

- Level1: Select period for level 1 (closest level);
- Level2: Select period for level 2;
- Level3: Select period for level 3 (farthest level);
- Shift of last candle for Update Lines: Choose the shift period;
- Number of Candles for Calculate RSI Levels: Select the number of candles for averaging calculations based on the chosen timeframe;
- Time Frame for Calculate RSI: Choose the RSI calculation timeframe;
- Time Frame for Update Lines: Choose the timeframe for updating the lines;
- Main Line: Select the color of the central level;
- Lines: Select the color of the levels;
- Number of previous candles: Choose the period for displaying calculations and lines based on the selected timeframe;
- RSI_Period: Choose the RSI period;
- Price: Select the price calculation type.
Conclusion
The RSI Levels Indicator is one of the volatile MetaTrader 5 indicators that enables traders to identify high-potential levels.
Traders can use the plotted levels as support or resistance and utilize the central level to determine market trend direction, allowing for more specialized and accurate chart analysis.
RSI Levels MT5 PDF
RSI Levels MT5 PDF
Click to download RSI Levels MT5 PDFWho is the RSI Levels Indicator suitable for?
This tool is beneficial for traders interested in technical analysis and price action, aiming to better identify support and resistance levels using RSI.
How does the RSI Levels Indicator improve trading decisions?
By displaying key RSI levels, this indicator enables traders to identify high-probability price reversal areas and make better-informed trading decisions.


