![RSI Adaptive Length Indicator in MetaTrader 5 Download – [TradingFinder]](https://cdn.tradingfinder.com/image/693573/en-rsi-mt5.webp)
![RSI Adaptive Length Indicator in MetaTrader 5 Download – [TradingFinder] 0](https://cdn.tradingfinder.com/image/693573/en-rsi-mt5.webp)
![RSI Adaptive Length Indicator in MetaTrader 5 Download – [TradingFinder] 1](https://cdn.tradingfinder.com/image/579105/11-116-en-rsi-multilength-mt5-02.webp)
![RSI Adaptive Length Indicator in MetaTrader 5 Download – [TradingFinder] 2](https://cdn.tradingfinder.com/image/579116/11-116-en-rsi-multilength-mt5-03.webp)
![RSI Adaptive Length Indicator in MetaTrader 5 Download – [TradingFinder] 3](https://cdn.tradingfinder.com/image/579126/11-116-en-rsi-multilength-mt5-04.webp)
The RSI Adaptive Length Indicator is an advanced version of the classic RSI that runs in MetaTrader 5, allowing traders to identify overbought and oversold zones and forecast potential market trends.
This indicator calculates multiple RSI periods, generates a new average, and provides more accurate signals. As a result, forex traders can detect possible market reversals earlier and make more precise trading decisions.
By displaying the strength of overbought and oversold conditions as a histogram, this indicator enables traders to perform more specialized analysis of trend intensity and determine entry or exit points with higher confidence.
RSI Adaptive Length Indicator Table
Below is the information related to the RSI Adaptive Length Indicator:
Indicator Categories: | Oscillators MT5 Indicators Signal & Forecast MT5 Indicators Trading Assist MT5 Indicators |
Platforms: | MetaTrader 5 Indicators |
Trading Skills: | Advanced |
Indicator Types: | Trend MT5 Indicators Entry & Exit MT5 Indicators Reversal MT5 Indicators |
Timeframe: | Multi-Timeframe MT5 Indicators |
Trading Style: | Intraday MT5 Indicators Scalper MT5 Indicators Day Trading MT5 Indicators |
Trading Instruments: | Forex MT5 Indicators Crypto MT5 Indicators Stock MT5 Indicators Indices MT5 Indicators Share Stock MT5 Indicators |
RSI Adaptive Length Indicator at a Glance
The RSI Adaptive Length Indicator is a professional tool for identifying overbought and oversold conditions in forex and crypto markets.
By combining multiple RSI values and displaying them as a histogram, it shows the strength of overbought and oversold conditions, helping traders make more confident decisions.
When the oscillator line enters overbought or oversold zones, traders can analyze histogram values to assess the intensity of these conditions and manage trades with a more professional outlook.
Uptrend in the RSI Adaptive Length Indicator
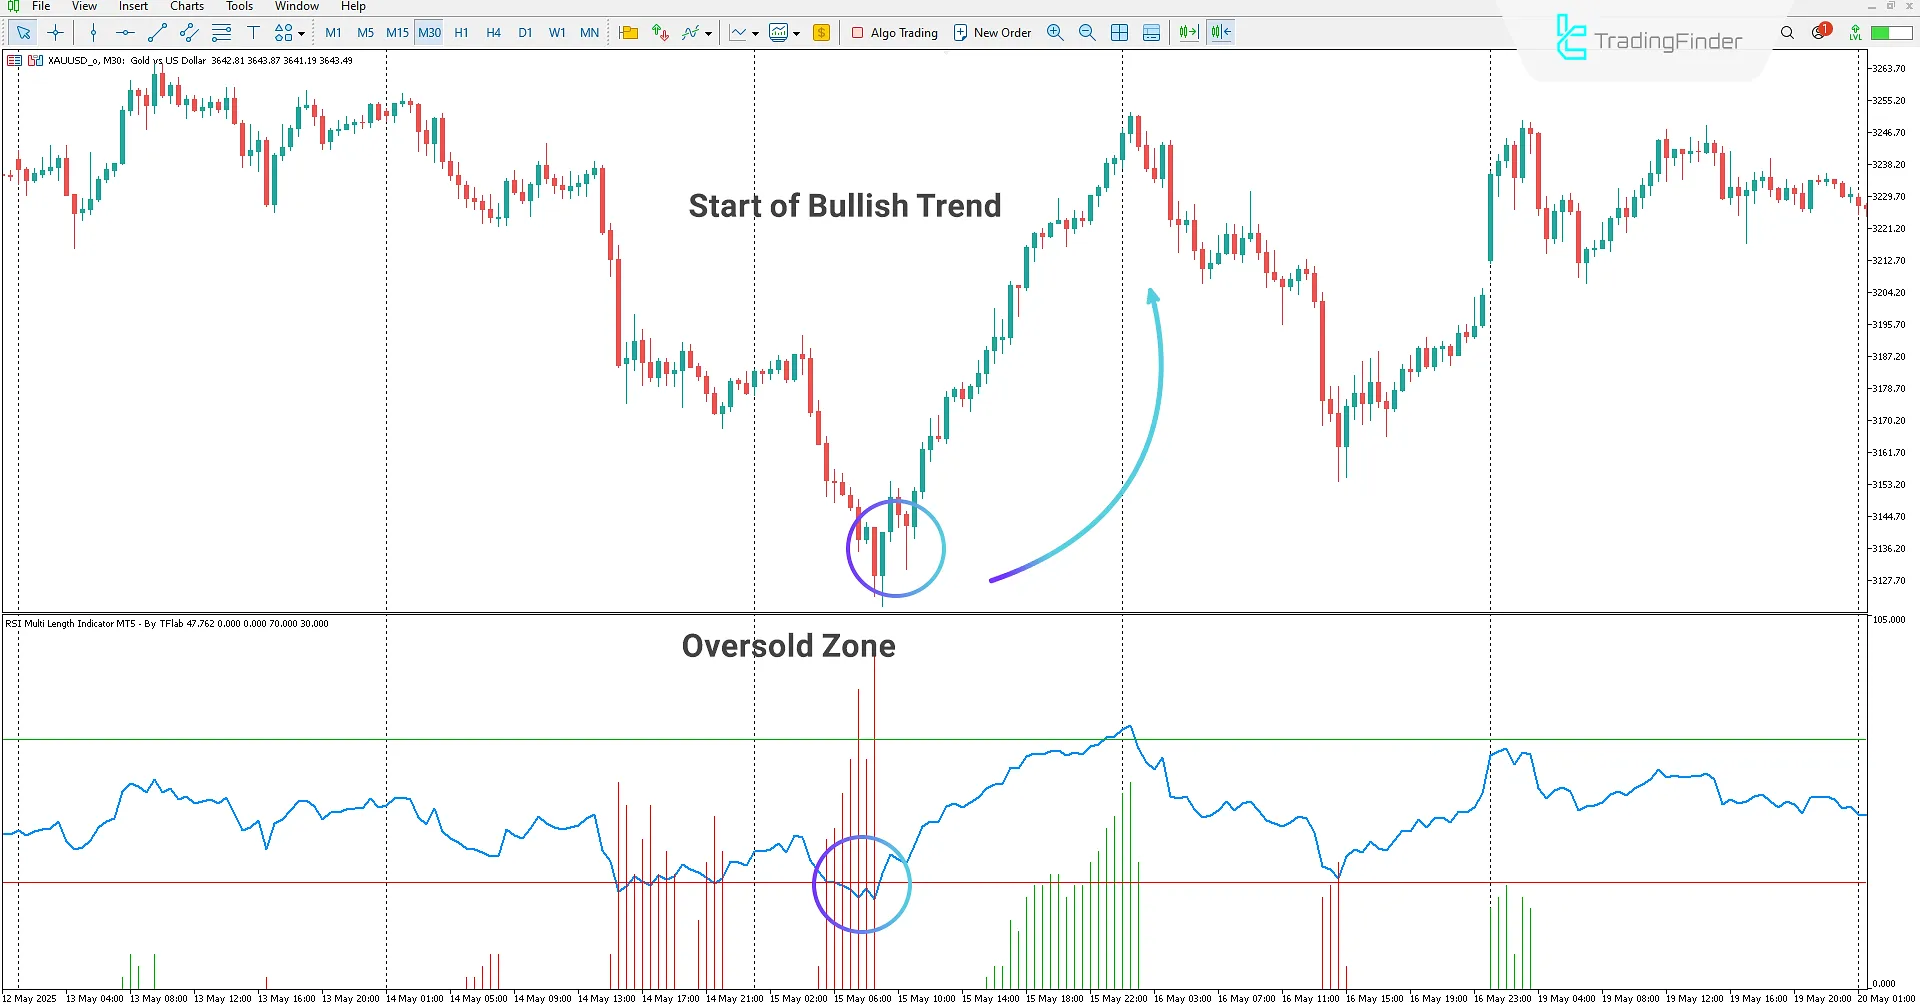
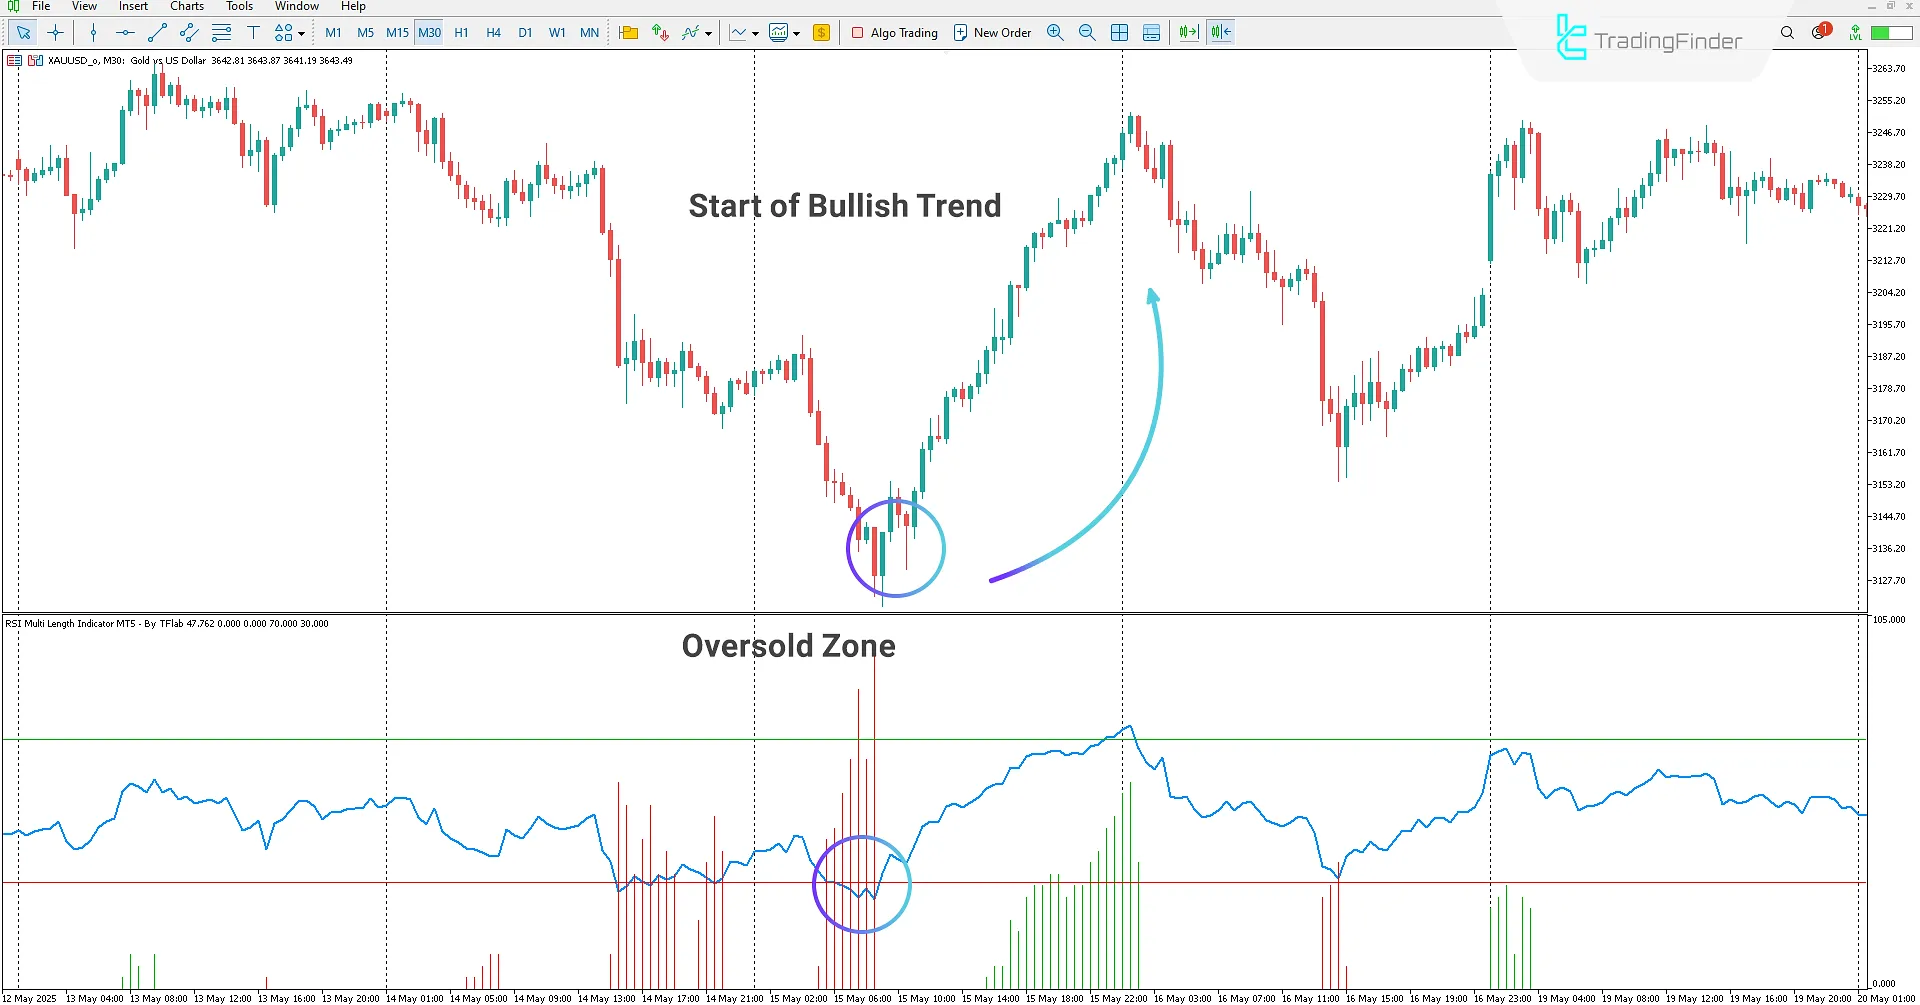
On the 30-minute XAU/USD chart, traders can use the RSI Adaptive Length Indicator to detect when the oscillator enters the oversold zone.
By analyzing histogram values, they can measure the strength of selling pressure.
When the oscillator exits the oversold zone, this movement signals the end of a bearish trend and the potential start of an uptrend, providing an opportunity to enter buy positions.

Downtrend in the RSI Adaptive Length Indicator
On the 15-minute USD/CHF chart, the RSI Adaptive Length Indicator shows entry into the overbought zone, signaling the weakening of the bullish trend and the possibility of its completion.
Traders can evaluate the intensity of buying pressure using the histogram and, upon confirmation, enter sell positions.

RSI Adaptive Length Indicator Settings
Below are the settings of the RSI Adaptive Length Indicator:

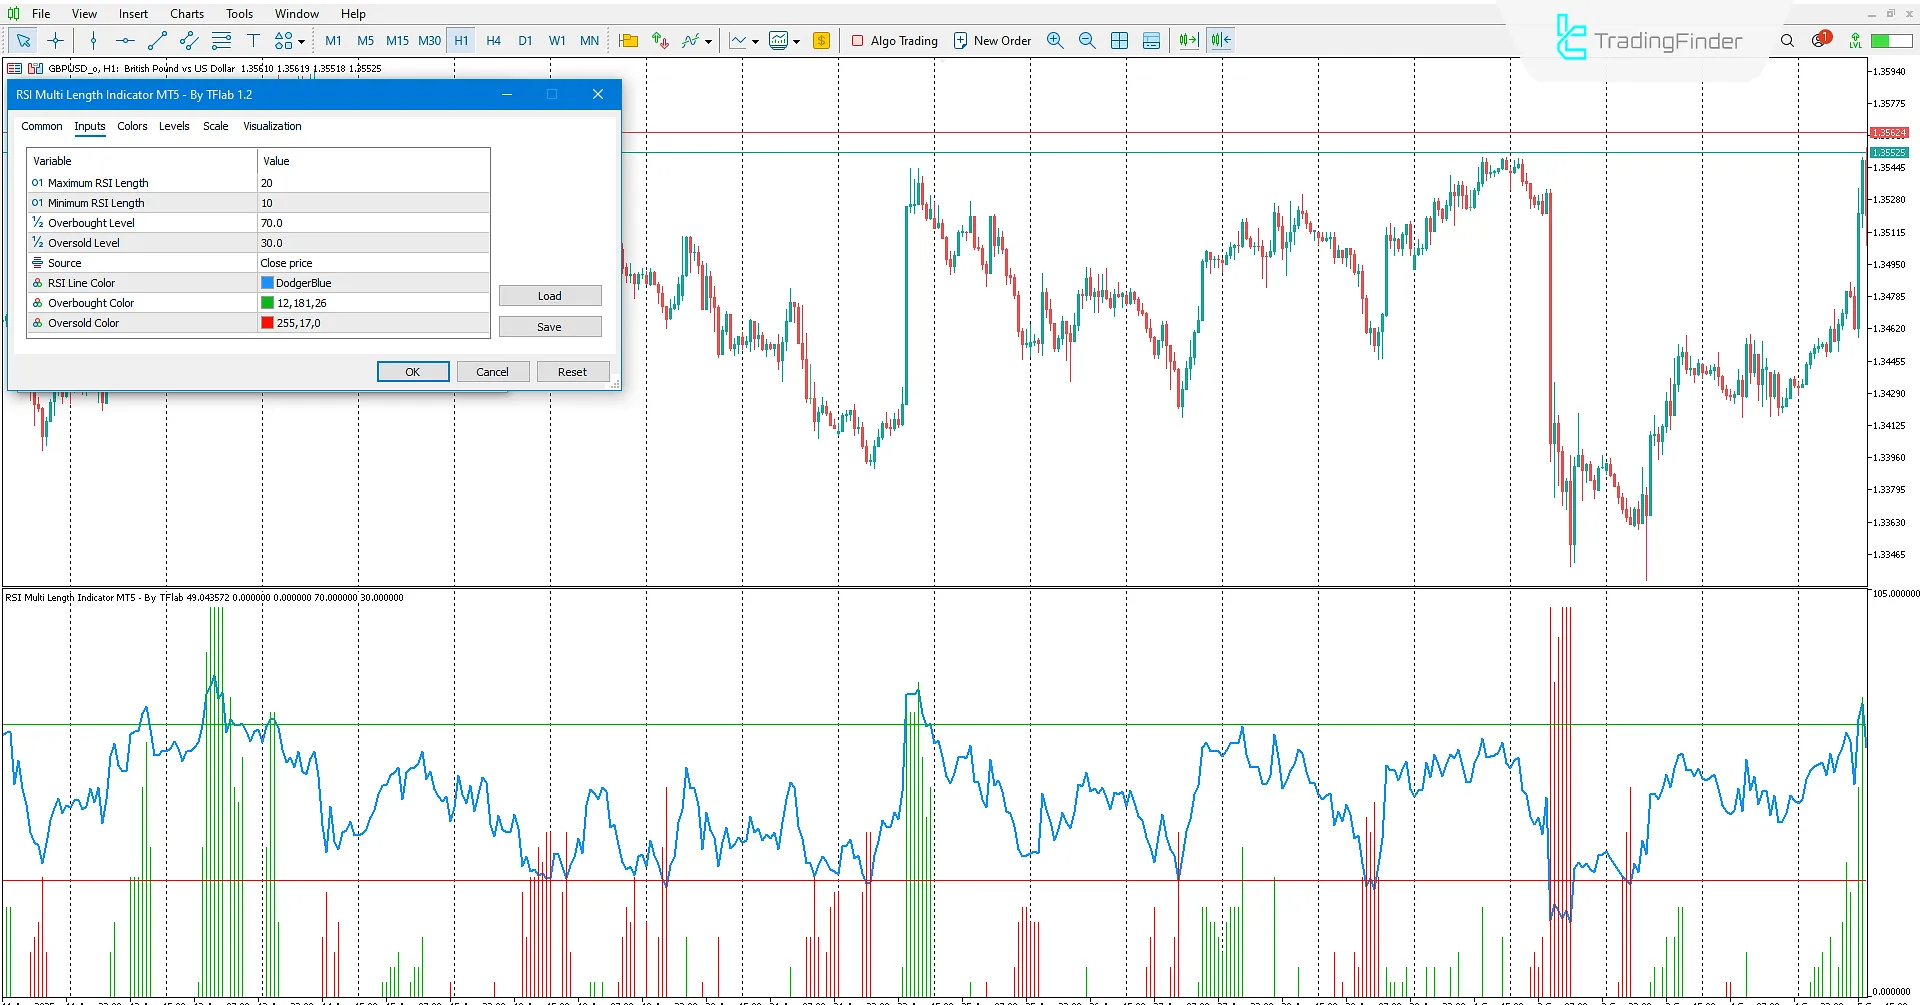
- Maximum RSI Length: Set maximum RSI period length;
- Minimum RSI Length: Set minimum RSI period length;
- Overbought Level: Define overbought level;
- Oversold Level: Define oversold level;
- Source: Define calculation source;
- RSI Line Color: Customize RSI line color;
- Overbought Color: Set overbought level line color;
- Oversold Color: Customize oversold level line color.
Conclusion
The RSI Adaptive Length Indicator uses advanced calculations to more accurately display overbought and oversold conditions.
Traders can integrate this indicator into their trading strategies, identify overbought and oversold zones, and after confirmation, enter buy or sell positions.
RSI Adaptive Length MT5 Indicator PDF
RSI Adaptive Length MT5 Indicator PDF
Click to download RSI Adaptive Length MT5 Indicator PDFWhat is the RSI Adaptive Length Indicator?
It is an advanced version of the classic RSI in MetaTrader 5 that combines multiple RSI periods to more accurately display overbought and oversold zones and forecast market trends.
How does the RSI Adaptive Length Indicator work?
It calculates multiple RSI values, generates a new average, and displays the strength of overbought and oversold conditions as a histogram, showing trend intensity and potential reversal points.


