![RSI on Moving Average Indicator for MetaTrader 5 Download - Free - [TFlab]](https://cdn.tradingfinder.com/image/182691/4-36-en-rsi-on-ma-mt5-1.webp)
![RSI on Moving Average Indicator for MetaTrader 5 Download - Free - [TFlab] 0](https://cdn.tradingfinder.com/image/182691/4-36-en-rsi-on-ma-mt5-1.webp)
![RSI on Moving Average Indicator for MetaTrader 5 Download - Free - [TFlab] 1](https://cdn.tradingfinder.com/image/182659/4-36-en-rsi-on-ma-mt5-2.webp)
![RSI on Moving Average Indicator for MetaTrader 5 Download - Free - [TFlab] 2](https://cdn.tradingfinder.com/image/182661/4-36-en-rsi-on-ma-mt5-3.webp)
![RSI on Moving Average Indicator for MetaTrader 5 Download - Free - [TFlab] 3](https://cdn.tradingfinder.com/image/182660/4-36-en-rsi-on-ma-mt5-4.webp)
The RSI on MA Indicator combines Moving Average Crossovers with the Relative Strength Index (RSI), making it a valuable MetaTrader 5 indicators for identifying trend direction and price momentum.
It plots two oscillating lines from 0 to 100, enabling the identification of buy and sell signals while providing a clearer understanding of price trend directions.
RSI on Moving Average Indicator Specifications
The specifications of this indicator are summarized in the table below:
Indicator Categories: | Oscillators MT5 Indicators Volatility MT5 Indicators Trading Assist MT5 Indicators RSI Indicators for MetaTrader 5 |
Platforms: | MetaTrader 5 Indicators |
Trading Skills: | Intermediate |
Indicator Types: | Leading MT5 Indicators |
Timeframe: | Multi-Timeframe MT5 Indicators |
Trading Style: | Intraday MT5 Indicators |
Trading Instruments: | Forex MT5 Indicators Crypto MT5 Indicators Stock MT5 Indicators Forward MT5 Indicators Share Stock MT5 Indicators |
Overview of the Indicator
This indicator uses the Relative Strength Index (RSI) based on moving averages to provide a clear insight into market behavior. The blue line represents the slower-moving average, and the red line represents the faster-moving average.
When these two lines cross, a signal is generated to confirm trade entry points.
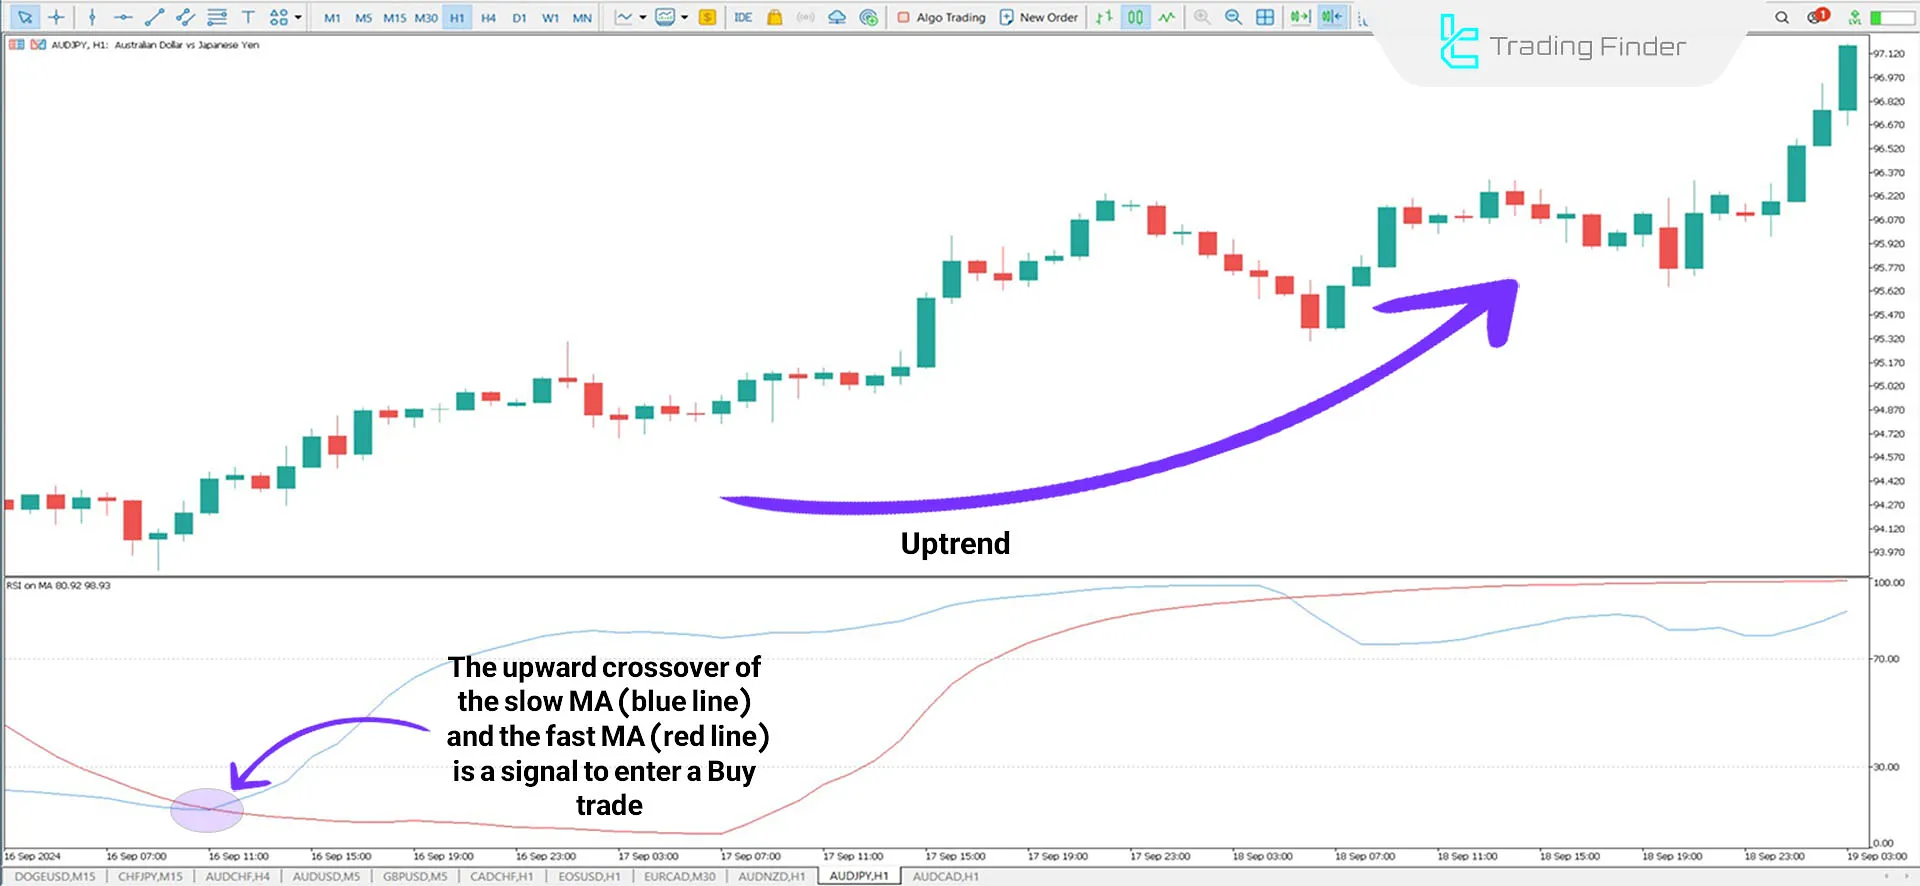
Indicator in an Uptrend
When the slow line (blue) and the fast line (red) approach the 0 level, and the slow line crosses the fast line upward, it signals the start of an uptrend.
Analysts can confirm with necessary validations before entering a Buy trade.

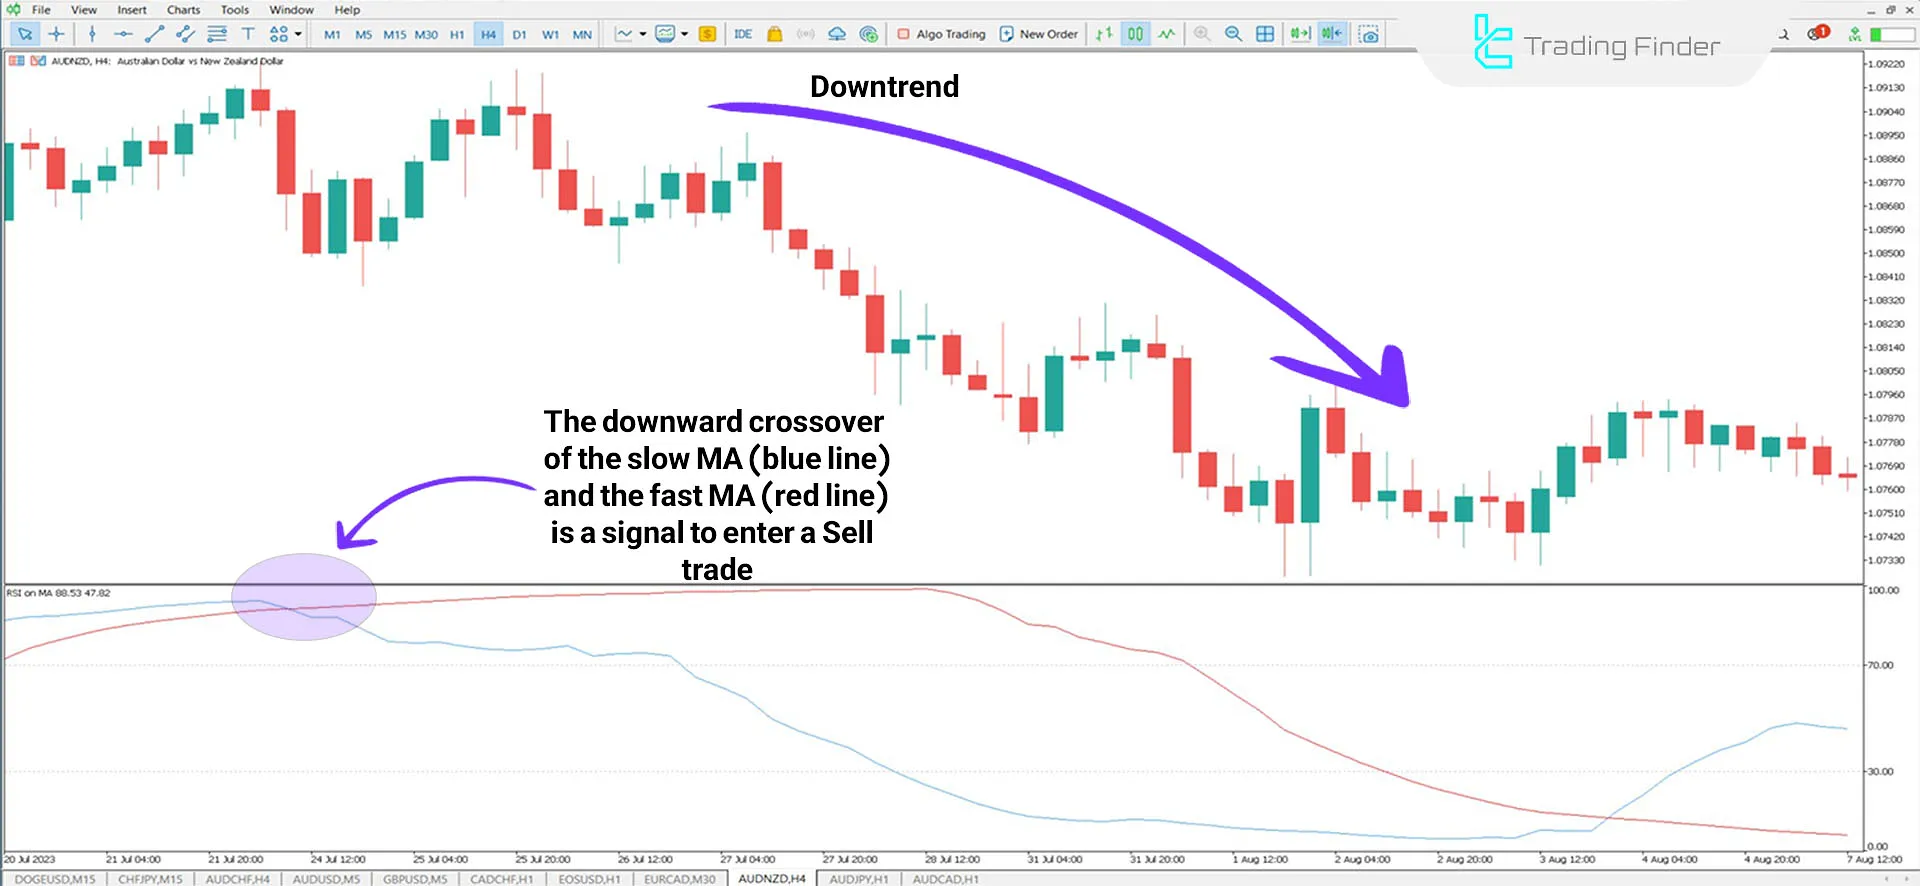
Indicator in a Downtrend
In the price chart of the AUD/NZD currency pair on a 4-hour timeframe, when the two moving average lines approach the 100 level and the slow line (blue) crosses the fast line (red) downward, this event can be interpreted as a signal to enter a Sell trade.
Traders can proceed with additional validations before initiating the trade.

RSI on Moving Average Indicator Settings
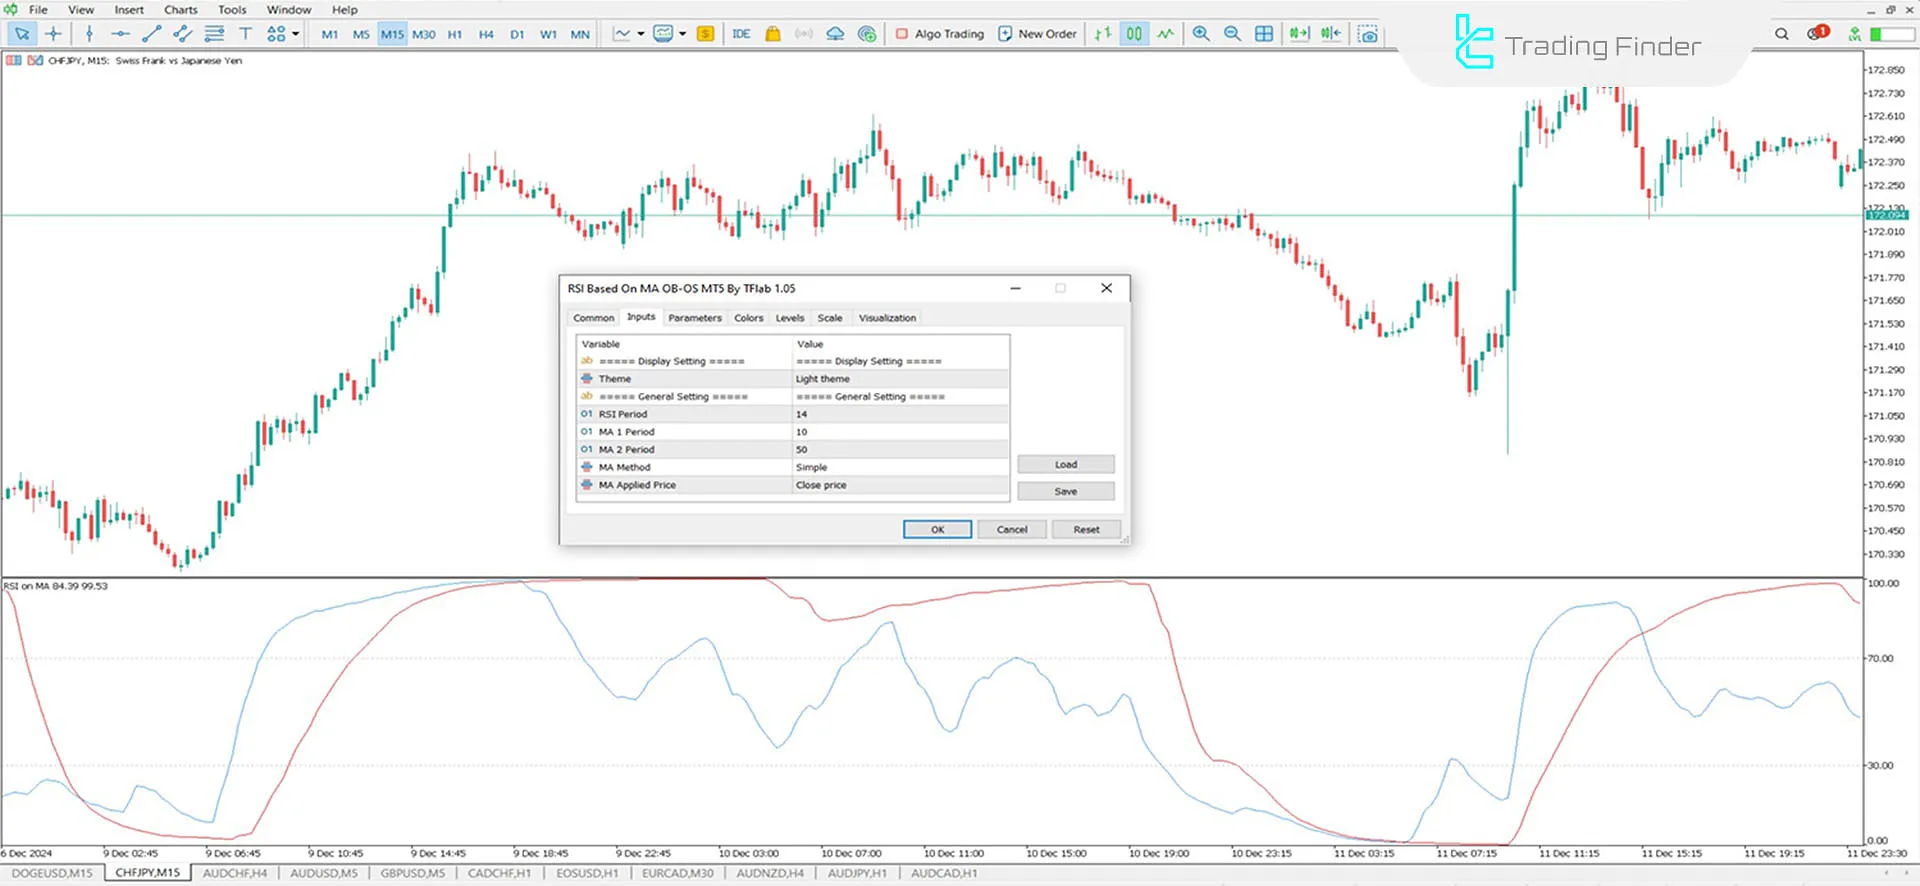
The image below displays the specifications of the RSI on Moving Average indicator:

- Theme: The background theme of the indicator chart;
- RSI Period: The number of candlesticks used for calculating the RSI;
- First Moving Average Period: The period for the faster-moving average;
- Second Moving Average Period: The period for the slower-moving average;
- Moving Average Mode: The type of moving average used;
- Price Mode: The price type used (Open, Close, High, or Low).
Conclusion
The RSI on MA Indicator is a hybrid tool that utilizes the Relative Strength Index (RSI) and Moving Averages to identify trend direction and price momentum.
This MetaTrader 5 oscillator plots two oscillating lines (slow and fast) within the 0 to 100 range, making it useful for detecting crossover points.
RSI Moving Average MT5 PDF
RSI Moving Average MT5 PDF
Click to download RSI Moving Average MT5 PDFWhat is the RSI on the MA Indicator?
The RSI on the MA Indicator is a combination tool that integrates the Relative Strength Index (RSI) and moving averages to identify trends, momentum, and buy/sell signals.
What is the difference between the slow line and the fast line?
The slow line (blue) represents the long-term moving average, while the fast line (red) represents the short-term moving average.


