![RSI Overbought Oversold Indicator MT5 Download – Free – [TrdingFinder]](https://cdn.tradingfinder.com/image/552990/13-214-en-rsi-overbought-oversold-mt5-01.webp)
![RSI Overbought Oversold Indicator MT5 Download – Free – [TrdingFinder] 0](https://cdn.tradingfinder.com/image/552990/13-214-en-rsi-overbought-oversold-mt5-01.webp)
![RSI Overbought Oversold Indicator MT5 Download – Free – [TrdingFinder] 1](https://cdn.tradingfinder.com/image/552988/13-214-en-rsi-overbought-oversold-mt5-02.webp)
![RSI Overbought Oversold Indicator MT5 Download – Free – [TrdingFinder] 2](https://cdn.tradingfinder.com/image/552987/13-214-en-rsi-overbought-oversold-mt5-03.webp)
![RSI Overbought Oversold Indicator MT5 Download – Free – [TrdingFinder] 3](https://cdn.tradingfinder.com/image/552991/13-214-en-rsi-overbought-oversold-mt5-04.webp)
The RSI Overbought Oversold Indicator use colored arrows to mark market overbought and oversold areas.
The signals displayed by this tool are recognized as potential price reversal levels.
Traders can combine these signals with the overall market trend to identify optimal entry or exit opportunities.
Specifications Table of RSI Indicator and Overbought/Oversold Zones
The table below describes the specifications of the RSI Indicator and Overbought/Oversold Zones:
Indicator Categories: | Currency Strength MT5 Indicators Trading Assist MT5 Indicators |
Platforms: | MetaTrader 5 Indicators |
Trading Skills: | Elementary |
Indicator Types: | Overbought & Oversold MT5 Indicators Reversal MT5 Indicators |
Timeframe: | Multi-Timeframe MT5 Indicators |
Trading Style: | Swing Trading MT5 Indicators Scalper MT5 Indicators Day Trading MT5 Indicators |
Trading Instruments: | Forex MT5 Indicators Crypto MT5 Indicators Stock MT5 Indicators |
RSI Overbought Oversold Indicator at a Glance
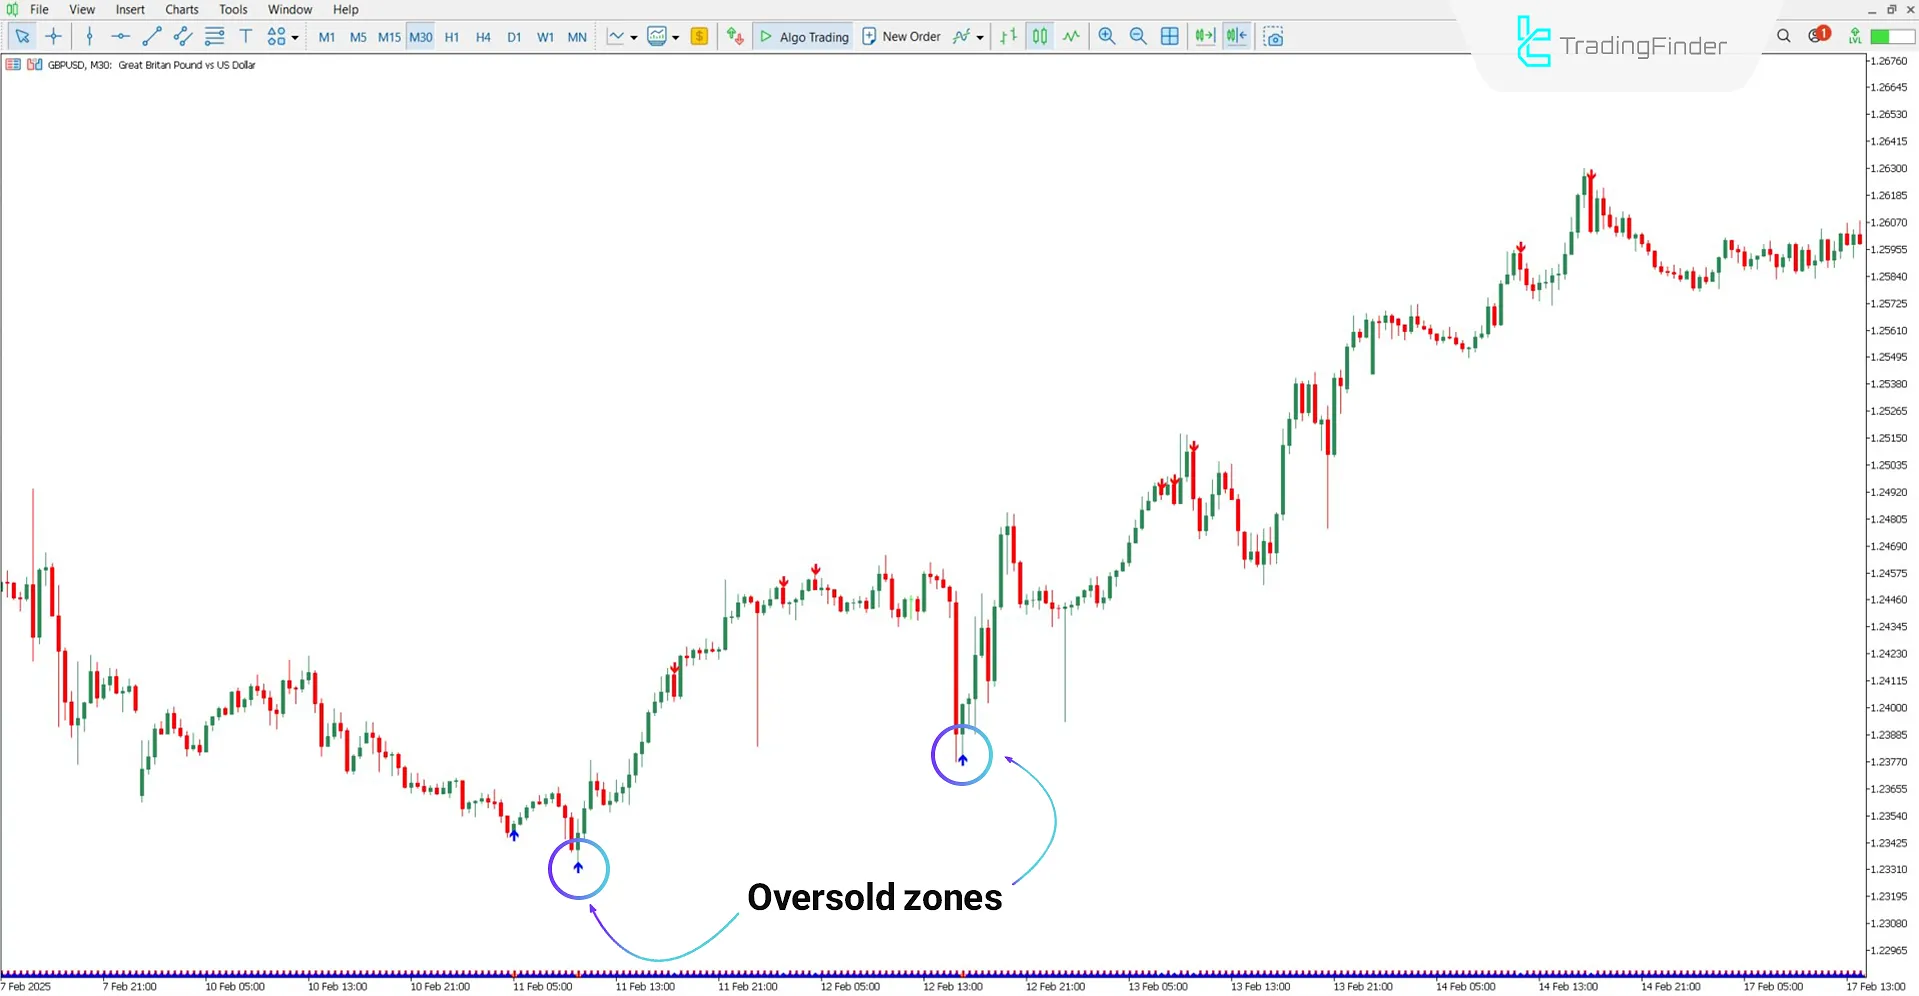
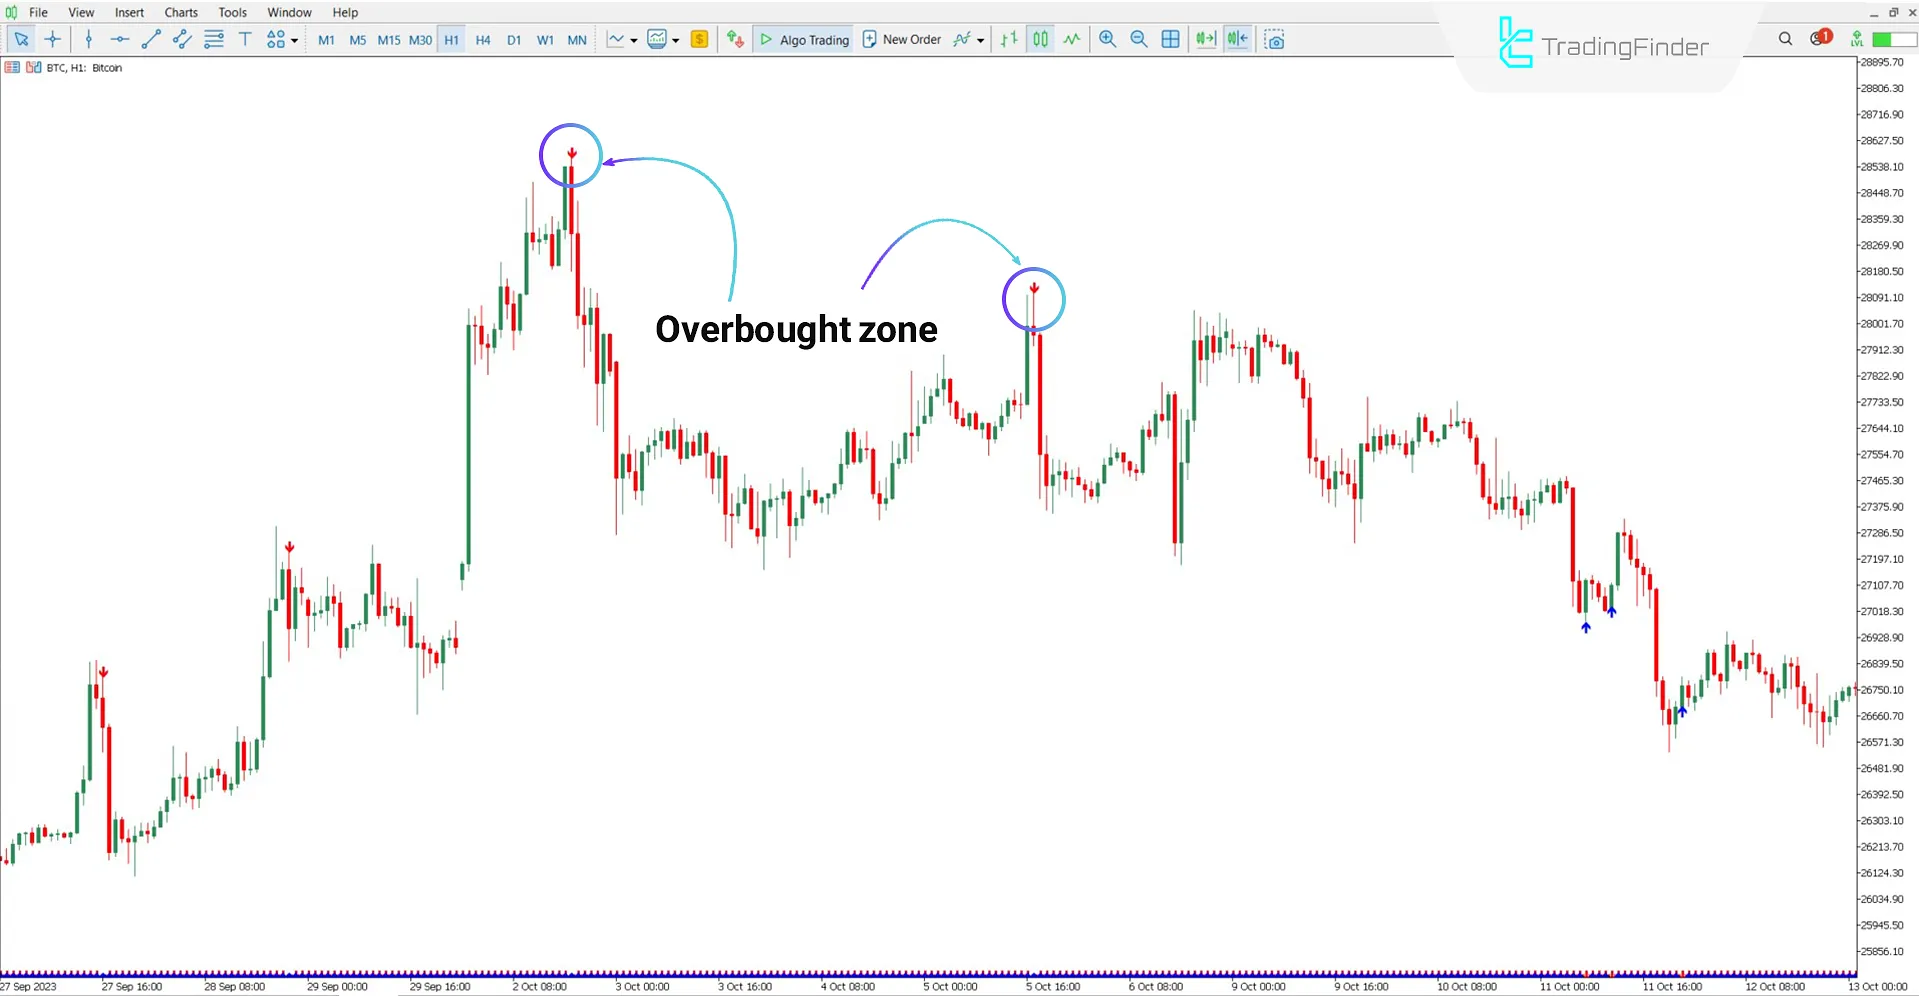
The RSI Overbought Oversold Indicator display oversold points with blue arrows, while overbought zones are marked with red arrows.
Bullish Trend Conditions
Based on the GBP/USD 30-minute chart, the indicator detected two entries into the oversold area.
If the market is bullish, these signals are considered opportunities for entering buy trades.

Bearish Trend Conditions
On the BTC 1-hour chart, overbought zones are displayed with red arrows.

RSI Overbought Oversold Indicator Settings
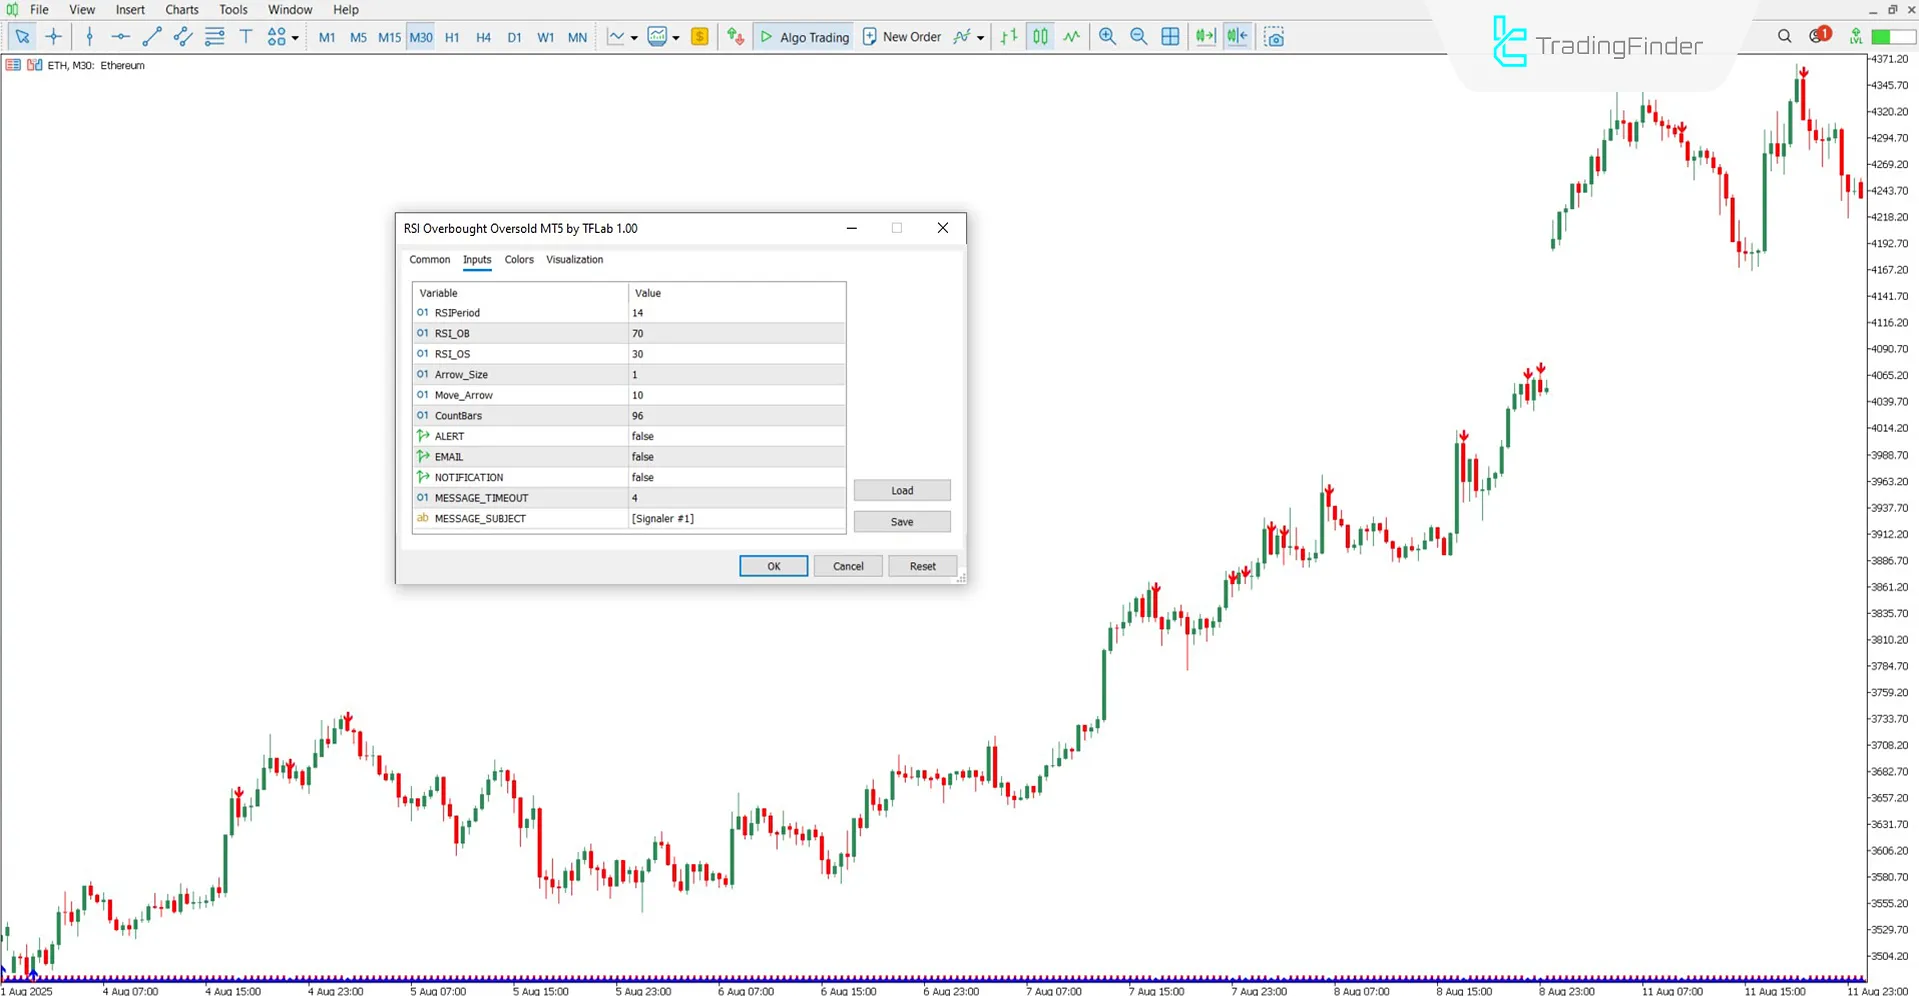
The settings of the RSI Overbought Oversold Indicator are as follows:

- RSIPeriod: RSI calculation period
- RSI_OB: Overbought level
- RSI_OS: Oversold level
- Arrow_Size: Signal arrow size
- Move_Arrow: Arrow distance from candles
- CountBars: Number of candles under review
- ALERT: Alert activation
- EMAIL: Alert via email
- NOTIFICATION: Notification activation
- MESSAGE_TIMEOUT: Alert message interval
- MESSAGE_SUBJECT: Alert subject
Conclusion
The RSI Overbought Oversold Indicator are based on the Relative Strength Index and are capable of identifying market overbought and oversold levels.
After detecting such areas, the tool marks them with arrows on the chart. Traders can use these signals, in line with the dominant market trend, as entry points for buy or sell trades.
RSI Overbought Oversold Indicator MT5 PDF
RSI Overbought Oversold Indicator MT5 PDF
Click to download RSI Overbought Oversold Indicator MT5 PDFCan this indicator be used on small timeframes?
Yes, the RSI Overbought Oversold Indicator are multi-timeframe and applicable to all markets.
What do the red arrows mean?
Red arrows indicate overbought zones.


