![Sentiment Ratio Oscillator for MT5 Download – Free – [TradingFinder]](https://cdn.tradingfinder.com/image/507521/13-192-en-sentiment-ratio-oscillator-mt5-01.webp)
![Sentiment Ratio Oscillator for MT5 Download – Free – [TradingFinder] 0](https://cdn.tradingfinder.com/image/507521/13-192-en-sentiment-ratio-oscillator-mt5-01.webp)
![Sentiment Ratio Oscillator for MT5 Download – Free – [TradingFinder] 1](https://cdn.tradingfinder.com/image/507523/13-192-en-sentiment-ratio-oscillator-mt5-02.webp)
![Sentiment Ratio Oscillator for MT5 Download – Free – [TradingFinder] 2](https://cdn.tradingfinder.com/image/507520/13-192-en-sentiment-ratio-oscillator-mt5-03.webp)
![Sentiment Ratio Oscillator for MT5 Download – Free – [TradingFinder] 3](https://cdn.tradingfinder.com/image/507519/13-192-en-sentiment-ratio-oscillator-mt5-04.webp)
The Sentiment Ratio Oscillator is a practical tool in technical analysis, used to evaluate the prevailing market psychology and identify potential overbought and oversold conditions.
This indicator, relying on Exponential Moving Averages (EMA) and price behavior analysis, provides insight into the dominant inclination of traders toward a specific asset.
Specification Table of Sentiment Ratio Oscillator
The specifications of the Sentiment Ratio Oscillator are as follows:
Indicator Categories: | Oscillators MT5 Indicators Signal & Forecast MT5 Indicators Volatility MT5 Indicators Market Sentiment Analysis Indicators for MT5 |
Platforms: | MetaTrader 5 Indicators |
Trading Skills: | Intermediate |
Indicator Types: | Reversal MT5 Indicators |
Timeframe: | Multi-Timeframe MT5 Indicators |
Trading Style: | Swing Trading MT5 Indicators Scalper MT5 Indicators Day Trading MT5 Indicators |
Trading Instruments: | Forex MT5 Indicators Crypto MT5 Indicators Stock MT5 Indicators |
Sentiment Ratio Oscillator at a Glance
The Sentiment Ratio Oscillator generates signals based on analyzing market overbought and oversold conditions.
When the oscillator curve enters overbought or oversold zones, the probability of a price reversal increases. Subsequently, the contact or crossover of indicator lines can be interpreted as potential opportunities for trade entries.
Buy Setup
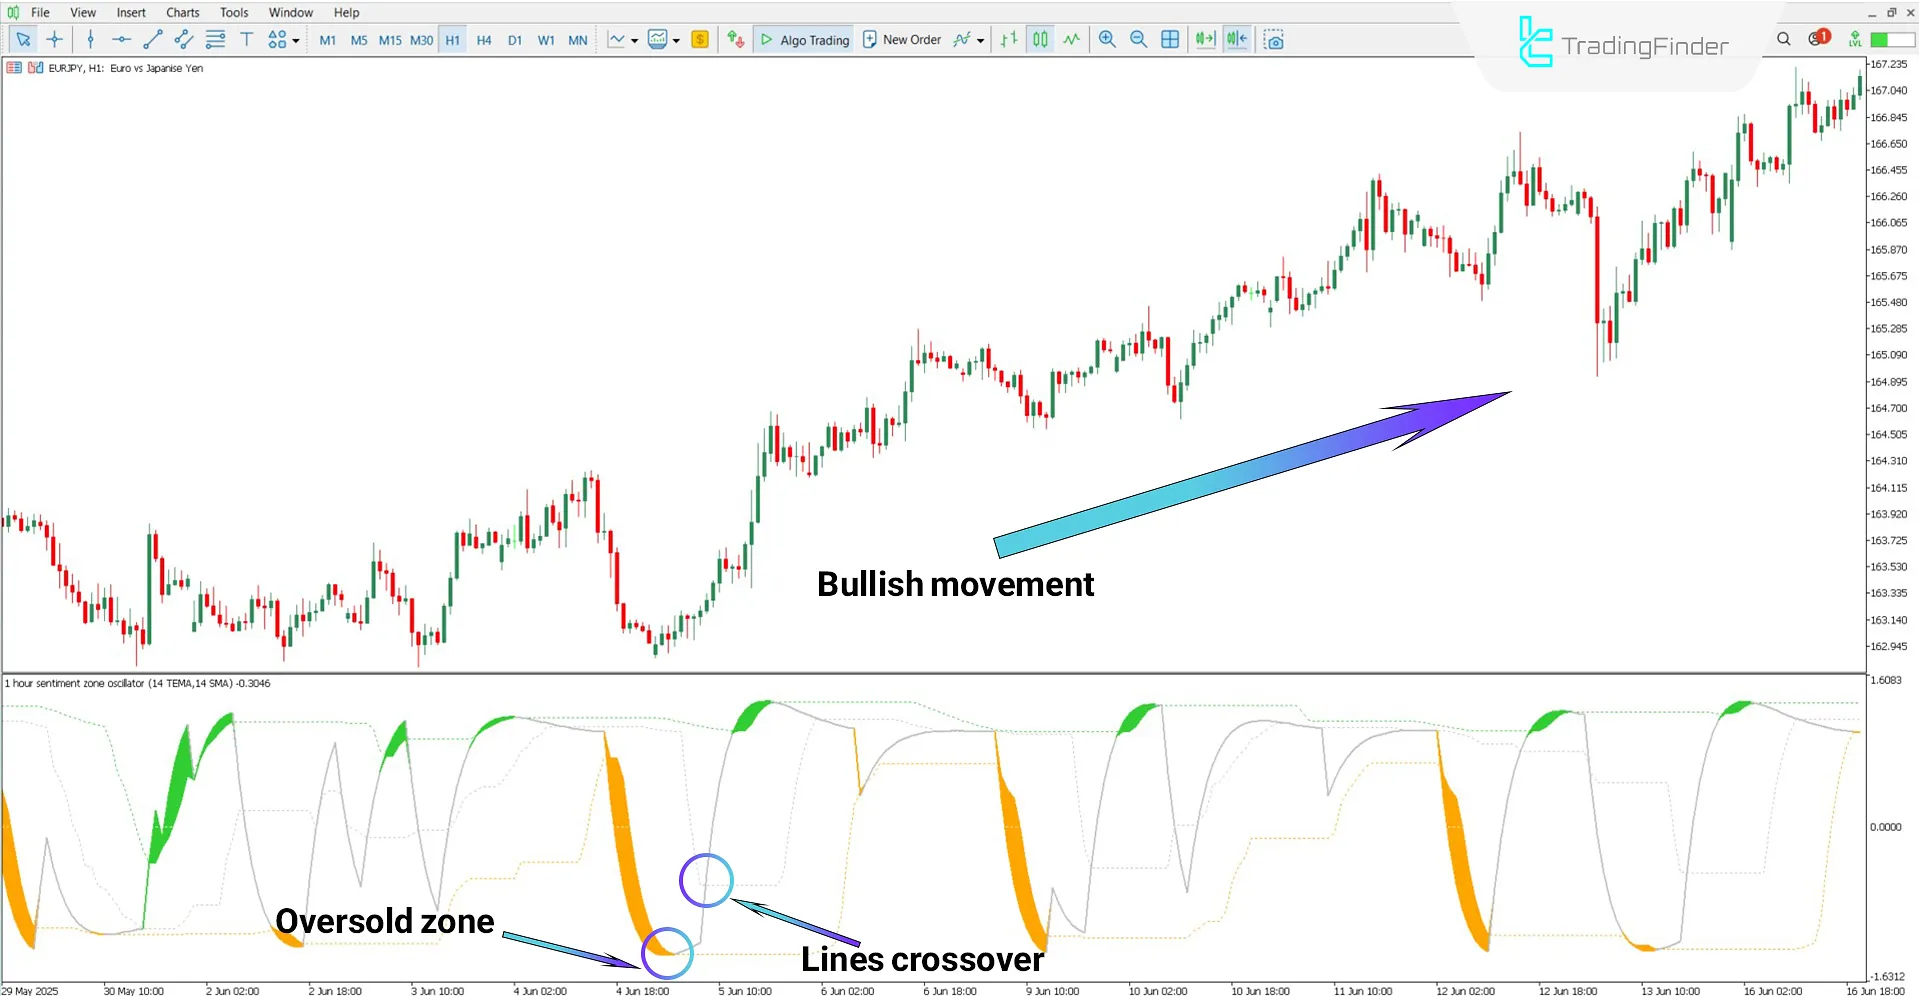
According to the USD/JPY chart on the 1-hour time frame, the Sentiment Ratio oscillator curve has entered the oversold zone, showing signs of trend reversal.
In this situation, the upward crossover of the indicator curve with the grey line is considered a buy signal.

Sell Setup
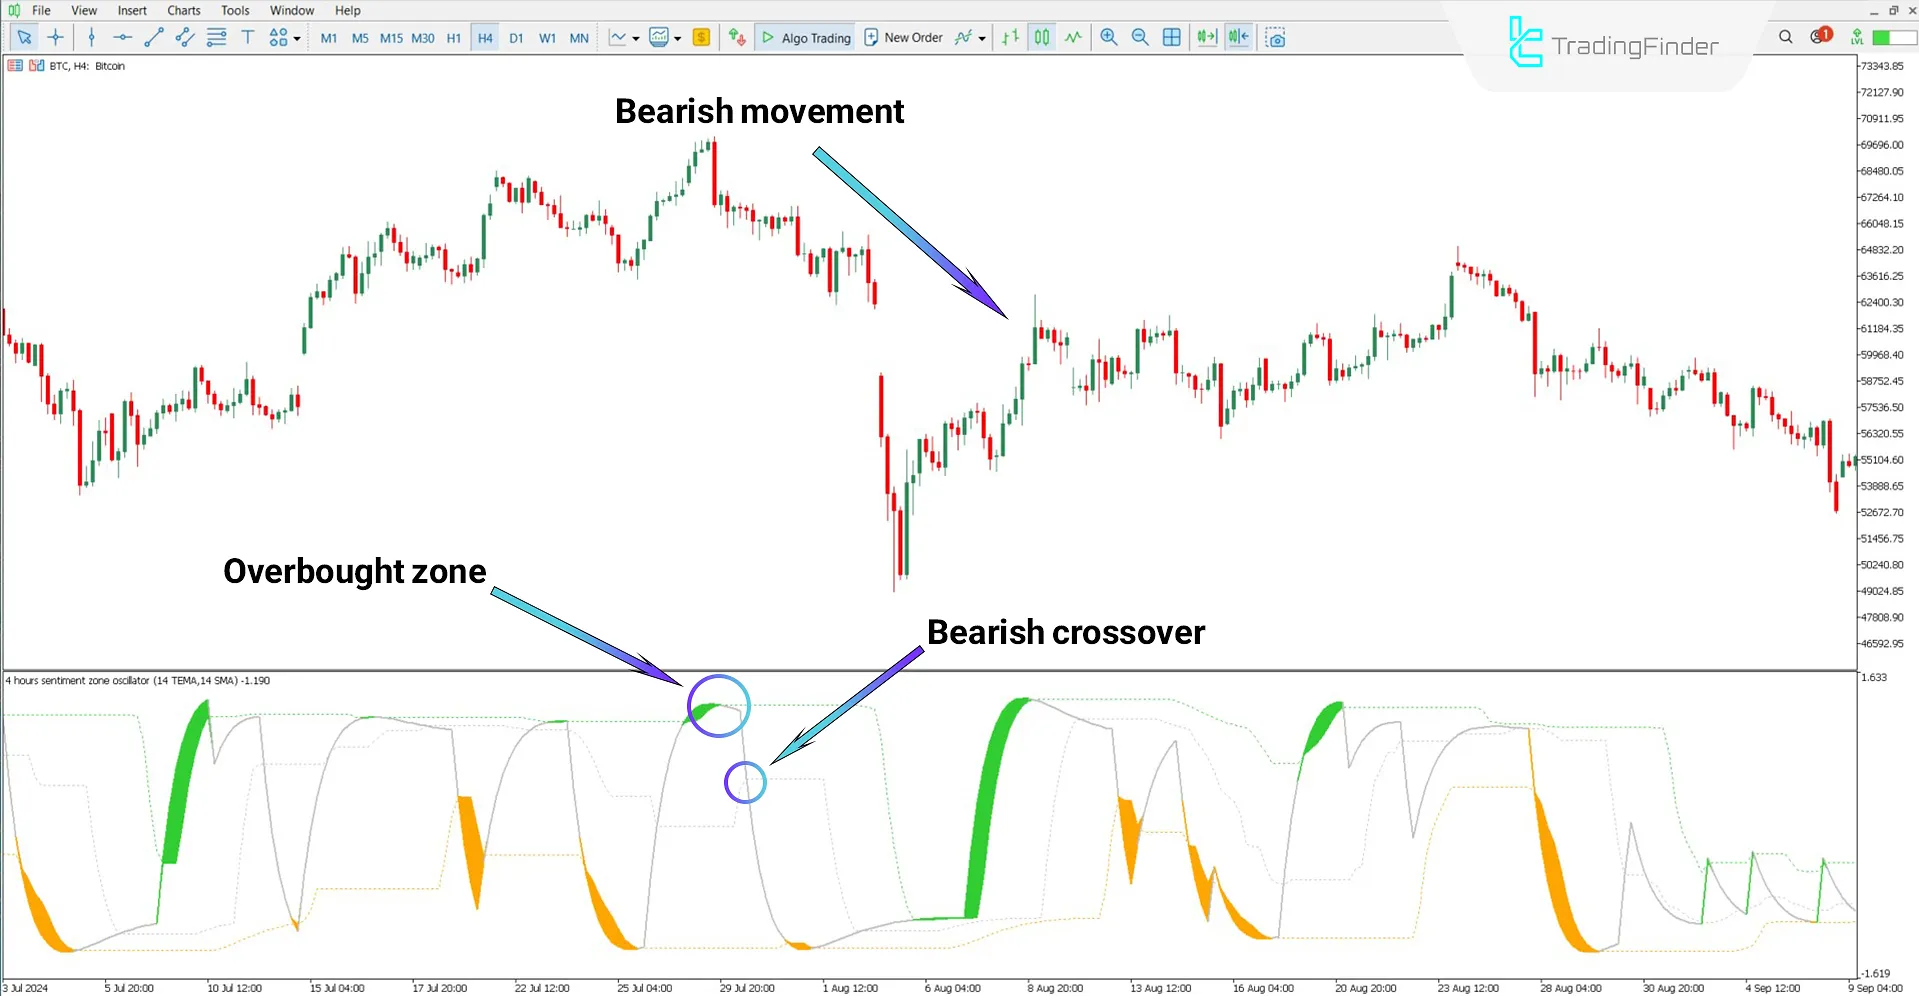
According to the Bitcoin (BTC) chart, after the price entered the overbought zone, signs of a downward reversal appeared.
In such conditions, the downward crossover of the oscillator curve with the signal line can be considered as a suitable setup for a sell trade.

Sentiment Ratio Oscillator Settings
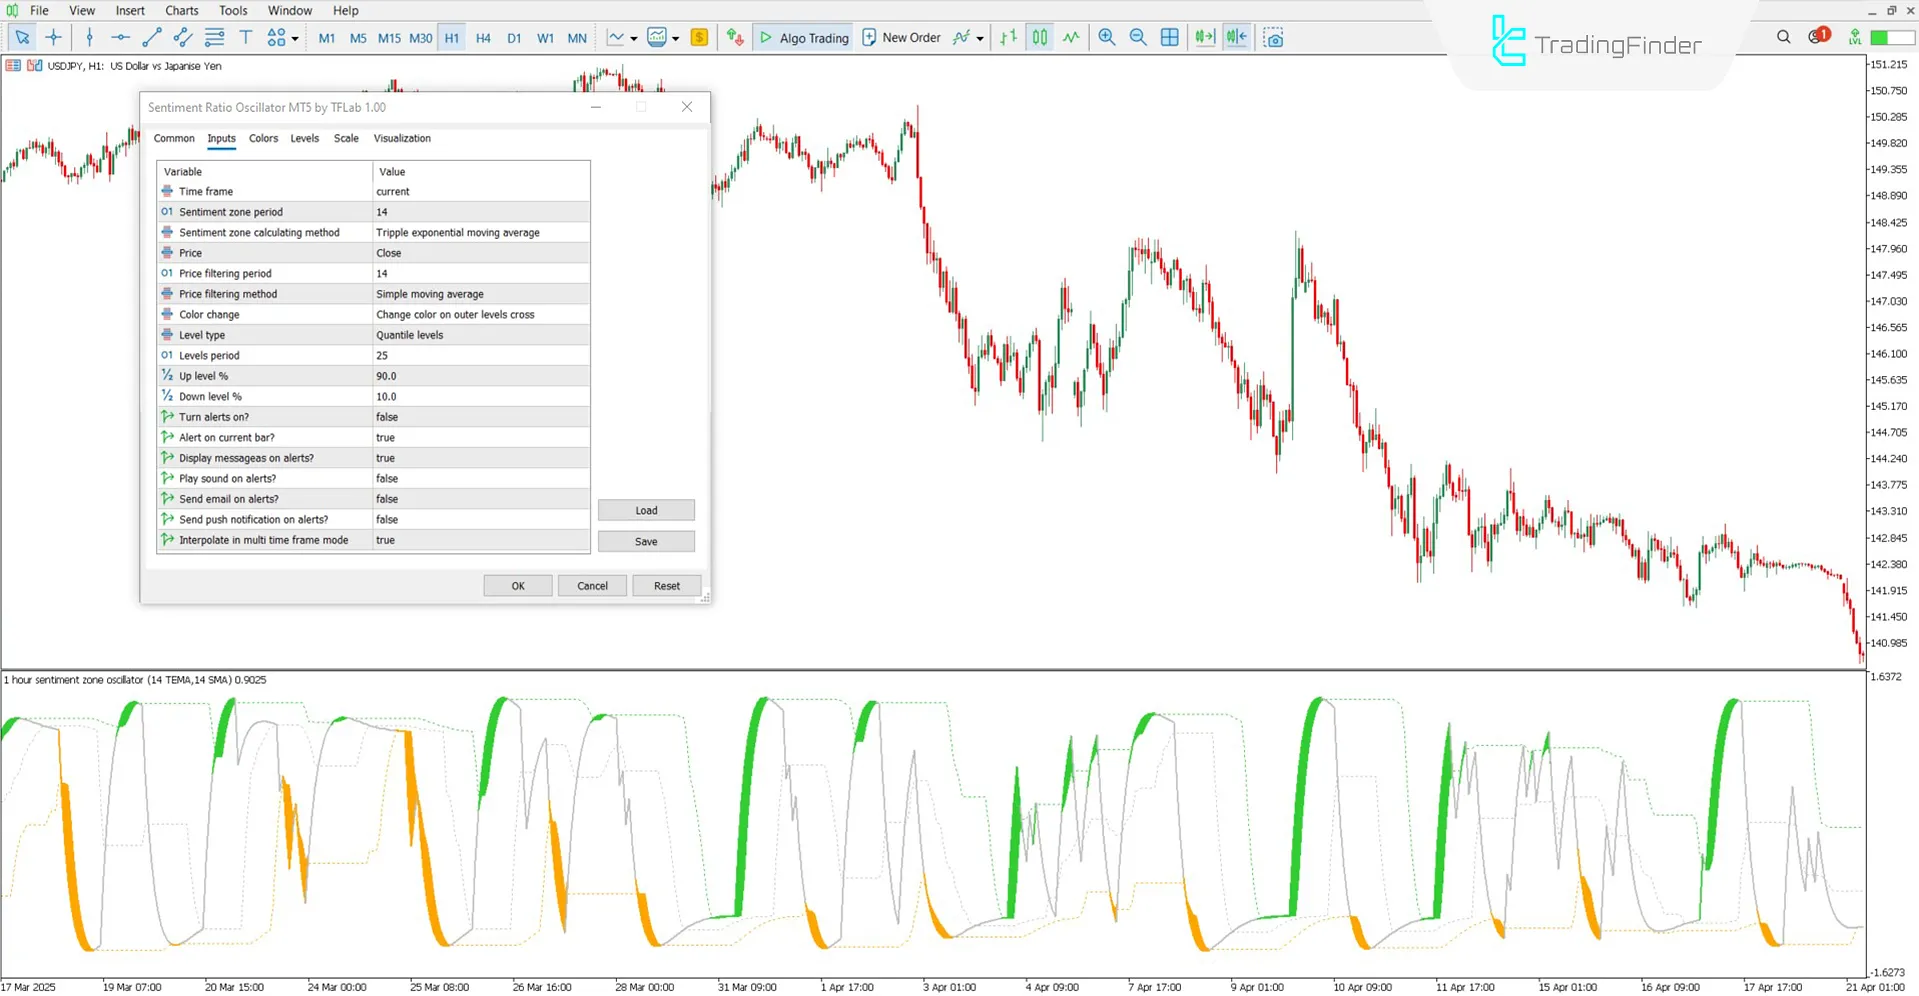
The settings of the Sentiment Ratio Oscillator are as follows:

- Time frame: Active chart timeframe for indicator calculation
- Sentiment zone period: Number of candles for sentiment zone formation
- Sentiment zone calculating method: Triple exponential moving average method
- Price: Type of base price
- Price filtering period: Number of candles for price movement filtering
- Price filtering method: Simple moving average (SMA) for price filtering
- Color change: Line color change on curve cross over levels
- Level type: Type of calculation levels
- Levels period: Number of candles for sensitive levels calculation
- Up level %: Upper level percentage for overbought zone calculation
- Down level %: Lower level percentage for oversold zone calculation
- Turn alerts on: Option for signal alert activation
- Alert on current bar: Option for alert on current candle
- Display messages on alerts: Message display on signal alert
- Play sound on alerts: Sound alert on signal
- Send email on alerts: Email alert option
- Send push notification on alerts: Push notification alert option
- Interpolate in multi time frame mode: Continuous curve display in multi-timeframe mode
Conclusion
The Sentiment Ratio Oscillator, using moving averages (MA) and percentage-based fluctuations, identifies overbought and oversold zones.
In addition, the contact or crossover of the main oscillator curve with the grey line [indicating the general market sentiment] is often interpreted as the right timing for entering trade positions.
Sentiment Ratio Oscillator for MT5 PDF
Sentiment Ratio Oscillator for MT5 PDF
Click to download Sentiment Ratio Oscillator for MT5 PDFWhat is the Sentiment Ratio Oscillator?
A tool to measure market psychological tendencies, displaying overbought and oversold zones.
Is the Sentiment Ratio Oscillator applicable on the daily time frame?
Yes, this indicator is multi-time frame and can be applied across all time frames.


