


The Swing Failure Pattern (SFP)Indicator is a practical tool in MetaTrader 5 for identifying fake breakouts and key reversal points. This indicator simultaneously displays points like Break of Structure (BOS), Change of Character (CHoCH), and Fake Breakout (SFP) on the chart. It helps traders in price action, ICT, and Smart Money styles effectively detect failed breakouts.
Indicator Specifications Table
Indicator Categories: | Smart Money MT5 Indicators Liquidity Indicators MT5 Indicators ICT MT5 Indicators |
Platforms: | MetaTrader 5 Indicators |
Trading Skills: | Advanced |
Indicator Types: | Reversal MT5 Indicators |
Timeframe: | Multi-Timeframe MT5 Indicators |
Trading Style: | Intraday MT5 Indicators |
Trading Instruments: | Forex MT5 Indicators Crypto MT5 Indicators Stock MT5 Indicators Commodity MT5 Indicators Forward MT5 Indicators Share Stock MT5 Indicators |
Overview of the Indicator
The Composite Failed Breakout Indicator (SFP) helps traders identify potential reversal or continuation points by accurately analyzing structural breaks (BOS), character changes (CHoCH), and fake breakouts (FSP). Compatible with various financial markets and timeframes, this indicator is a comprehensive tool for combining failed breakouts intended to trigger stop-losses and gather liquidity.
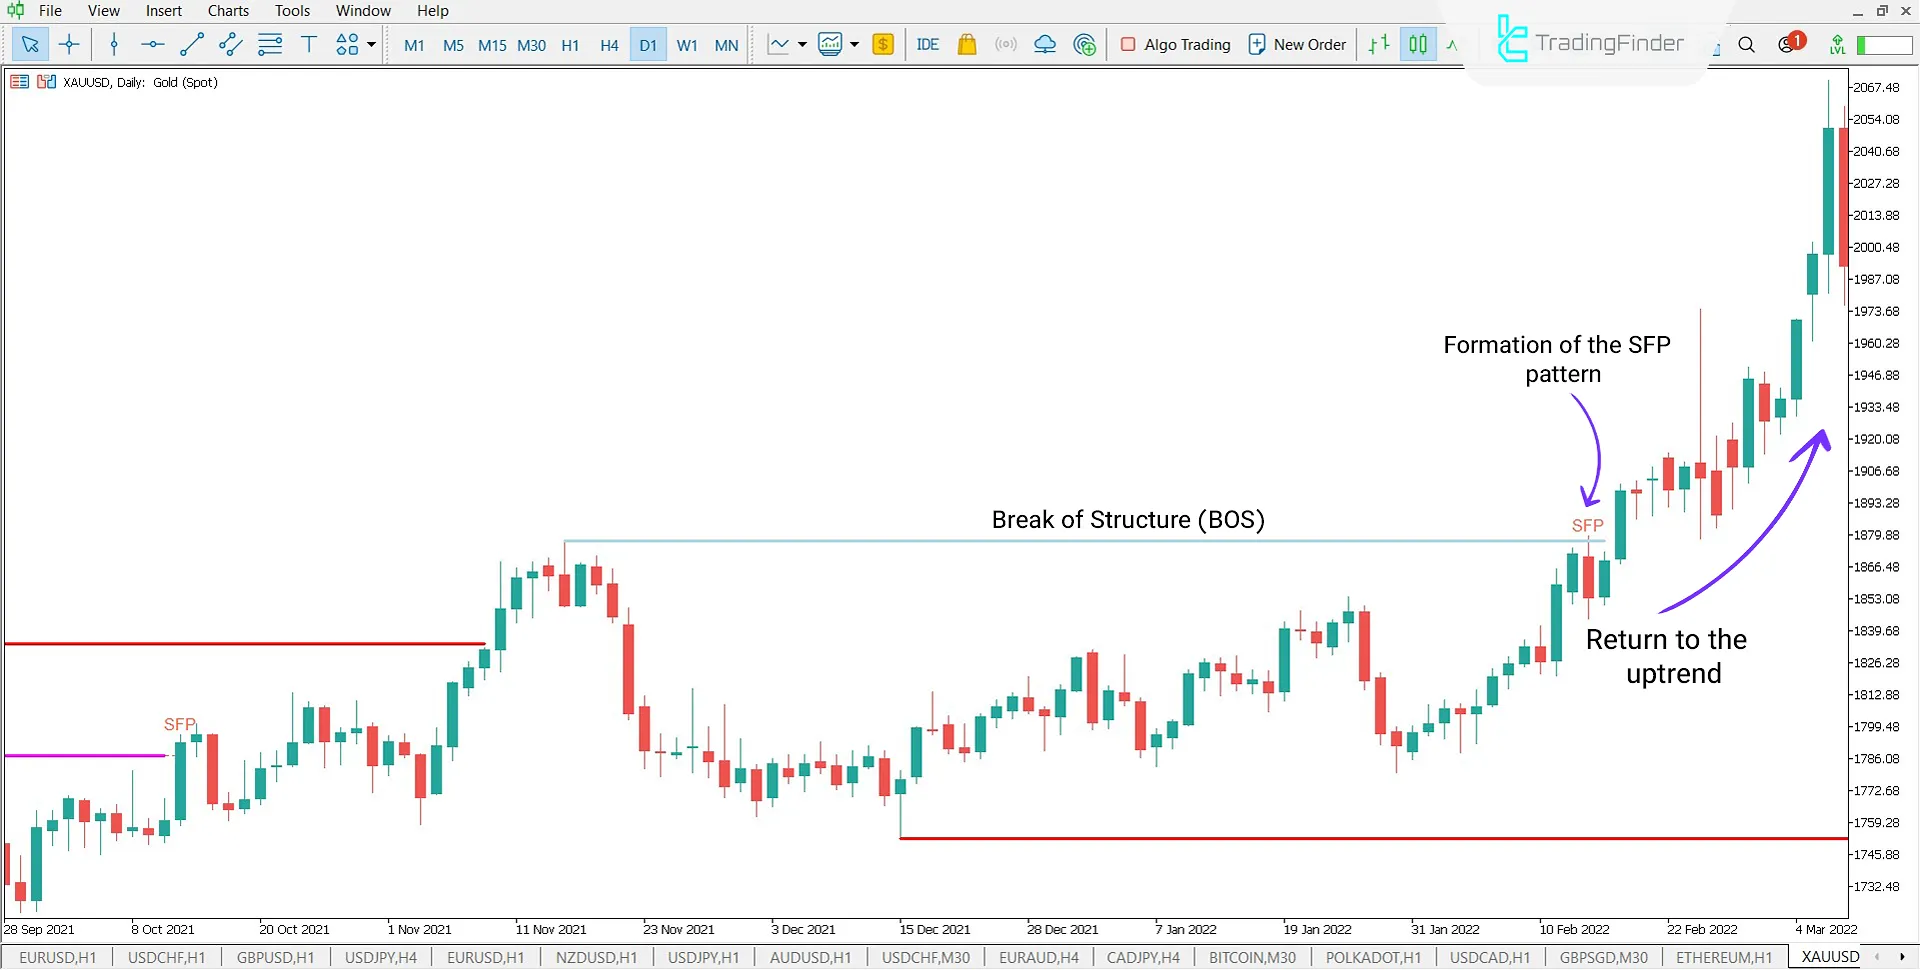
Composite Indicator in an Uptrend
In the following uptrend, the daily XAU/USD chart is shown. According to the image, the price is in an uptrend, and after a Break of Structure (BOS) in the direction of this trend, an SFP pattern forms. After this pattern forms, the price experiences a minor correction, creating an entry opportunity for a Long trade.
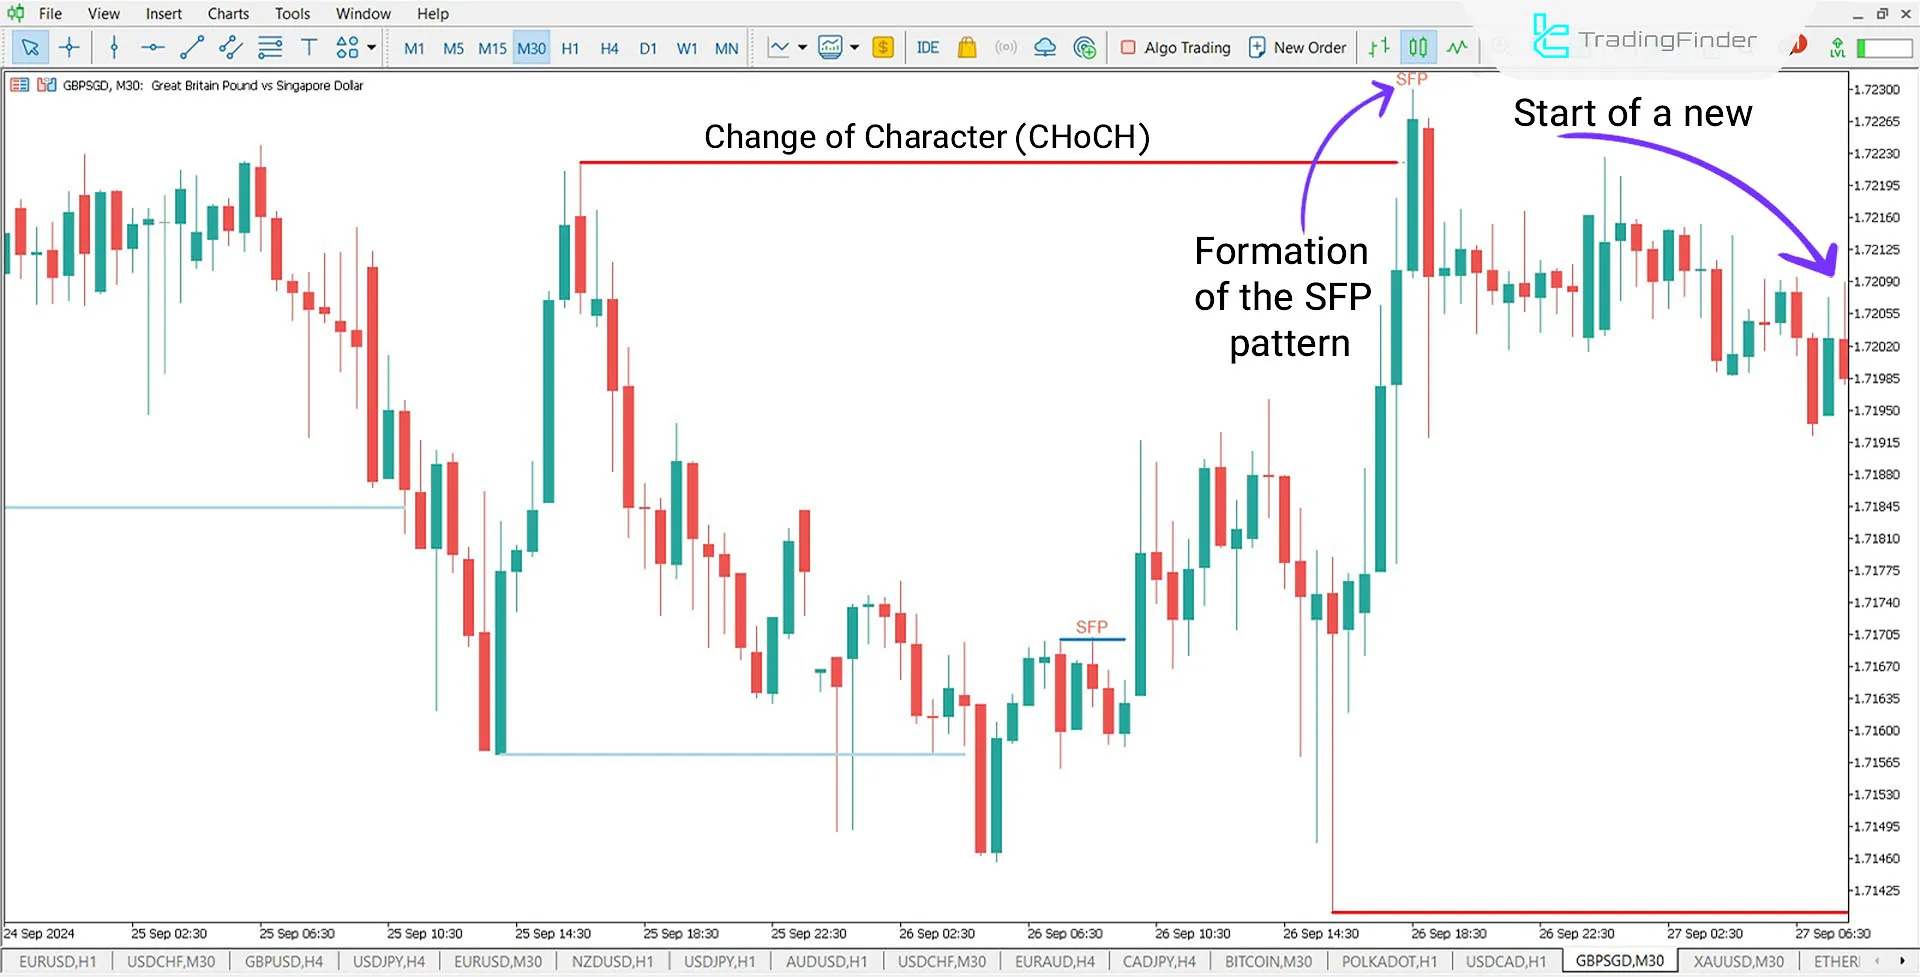
Composite Indicator in a Downtrend
The chart below shows the GBP/SGD currency pair in the 30-minute Timeframe. According to the image, the market's Change of Character (CHoCH) was fake, and after triggering stop-losses and gathering liquidity, the price formed the SFP pattern and continued its downtrend.
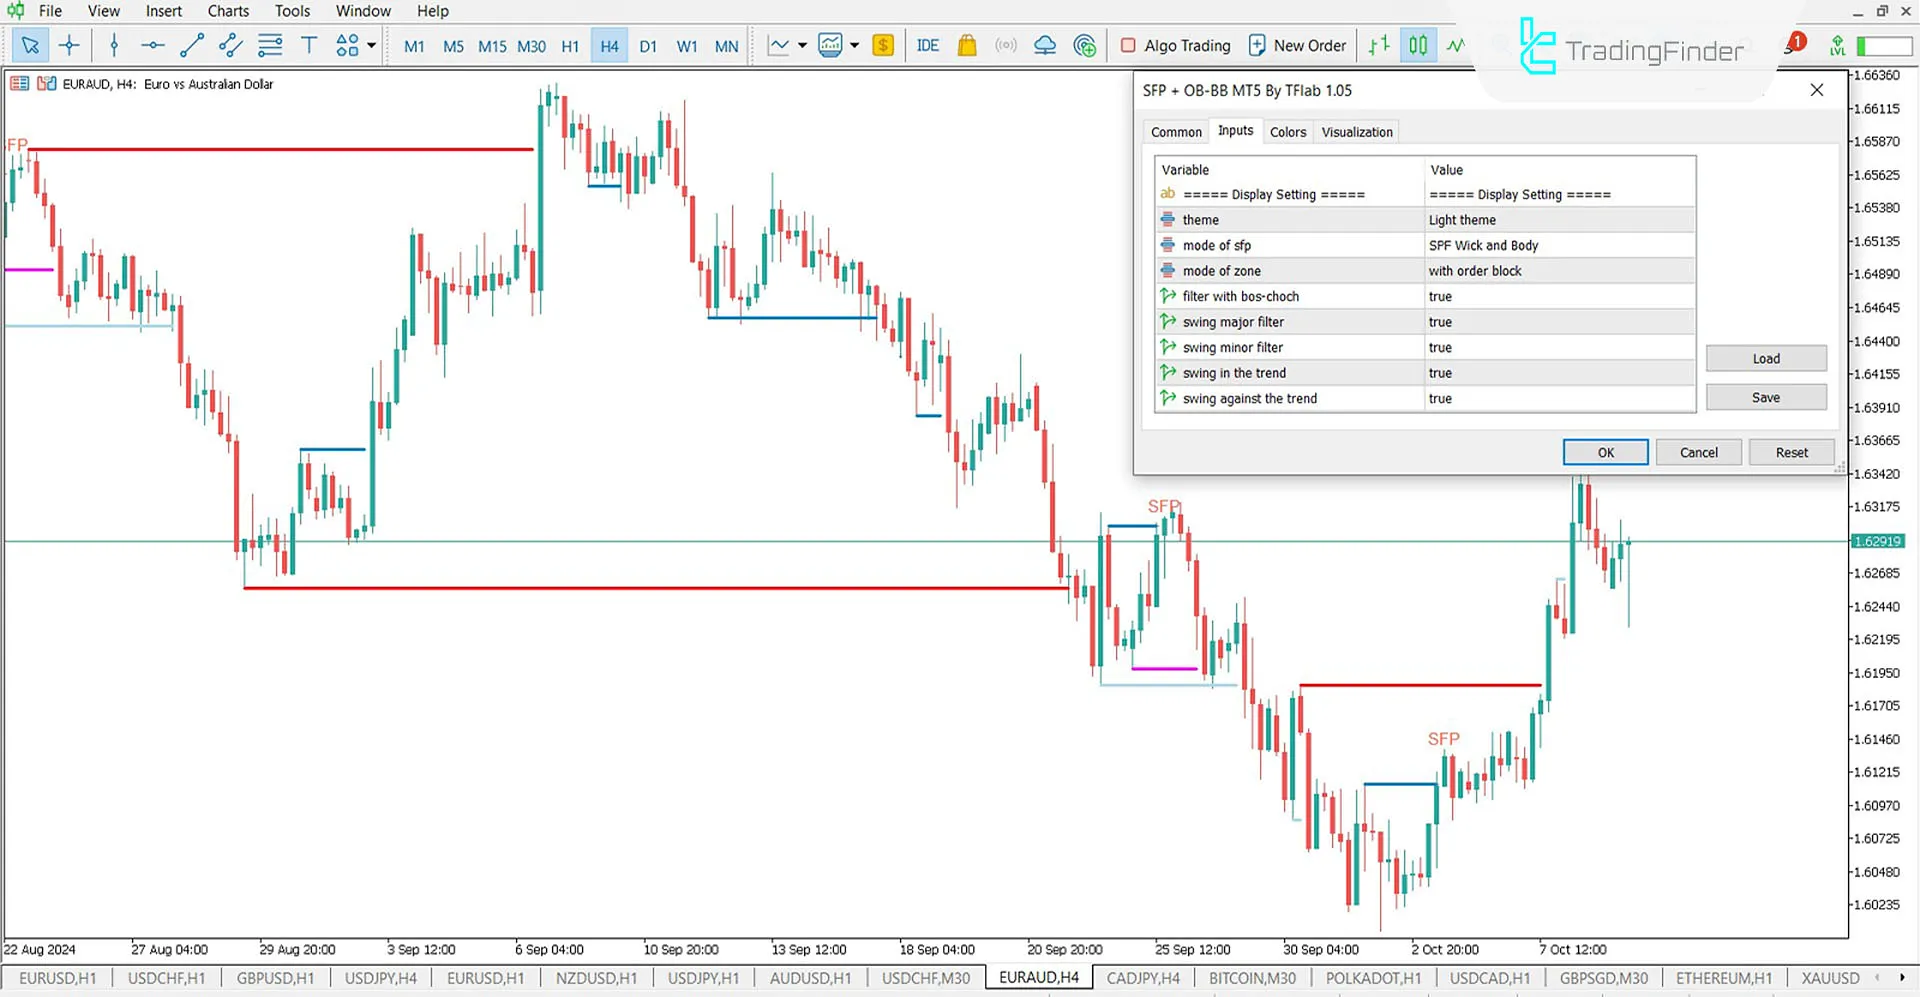
Indicator Settings
- Theme: Chart background color;
- Mode of SFP: Display SFP type with both candle body and wick;
- Mode of the zone: Display with Order Block;
- Filter with BOS-CHOCK: Filter with BOS CHOCK;
- Swing major filter: Display major swing;
- Swing minor filter: Display minor swing;
- Swing in the trend: Display swing in the trend;
- Swing against the trend: Display swing against the trend.
Conclusion
By combining the capabilities to detect structural breaks (BOS), character changes (CHoCH), and fake breakouts (SFP), this indicator is suitable for trading styles based on price action, ICT, and Smart Money. Traders can use this indicator to identify suitable Entry and Exit points and awareness of liquidity areas and stop-losses.
Swing Failure Pattern BB-OB MT5 PDF
Swing Failure Pattern BB-OB MT5 PDF
Click to download Swing Failure Pattern BB-OB MT5 PDFCan the SFP indicator be used alone for market analysis?
This indicator is used as a complementary tool and is best utilized alongside other analytical tools.
Which trading styles can benefit from this indicator?
This indicator is especially useful for traders in price action, ICT, and Smart Money styles.


