


![Show Current Candle (SCC) Indicator for MetaTrader 5 Download – Free – [Trading Finder]](https://cdn.tradingfinder.com/image/296431/11-13-en-show-current-candle-mt5-01.webp)
![Show Current Candle (SCC) Indicator for MetaTrader 5 Download – Free – [Trading Finder] 1](https://cdn.tradingfinder.com/image/296429/11-13-en-show-current-candle-mt5-02.webp)
![Show Current Candle (SCC) Indicator for MetaTrader 5 Download – Free – [Trading Finder] 2](https://cdn.tradingfinder.com/image/296418/11-13-en-show-current-candle-mt5-03.webp)
![Show Current Candle (SCC) Indicator for MetaTrader 5 Download – Free – [Trading Finder] 3](https://cdn.tradingfinder.com/image/296430/11-13-en-show-current-candle-mt5-04.webp)
The Show Current Candle (SCC) Indicator is a price action tool for MetaTrader 5 that calculates the price movement of the current candle, from its highest to lowest price, and displays this numerical value in blue on the top-left corner of the chart.
This tool allows traders to monitor the real-time price fluctuations of the current candle and analyze price strength within their selected timeframe.
Show Current Candle Indicator Table
The table below outlines the key specifications of the Show Current Candle (SCC) Indicator.
Indicator Categories: | Price Action MT5 Indicators Trading Assist MT5 Indicators Candle Sticks MT5 Indicators |
Platforms: | MetaTrader 5 Indicators |
Trading Skills: | Elementary |
Indicator Types: | Leading MT5 Indicators |
Timeframe: | Multi-Timeframe MT5 Indicators |
Trading Style: | Scalper MT5 Indicators Day Trading MT5 Indicators Fast Scalper MT5 Indicators |
Trading Instruments: | Forex MT5 Indicators Stock MT5 Indicators Commodity MT5 Indicators Forward MT5 Indicators Share Stock MT5 Indicators |
How the Indicator Works in a Bullish Candle
In the 30-minute Brent chart, the Show Current Candle Indicator displays a movement of 16 pips, representing the total price fluctuation within the bullish trend.
This movement is calculated from the lowest price to the highest price of the current candle.
Price action traders can use this data to perform detailed market analysis and evaluate the strength of price movement.
How the Indicator Works in a Bearish Candle
In the 30-minute USD/JPY chart, the Show Current Candle Indicator displays a movement of 150 pips, indicating the distance and price movement within this timeframe.
Traders can use this data to evaluate market volatility and perform detailed price action analysis.
Show Current Candle Indicator Settings
The following image displays the customizable settings of the Show Current Candle Indicator:
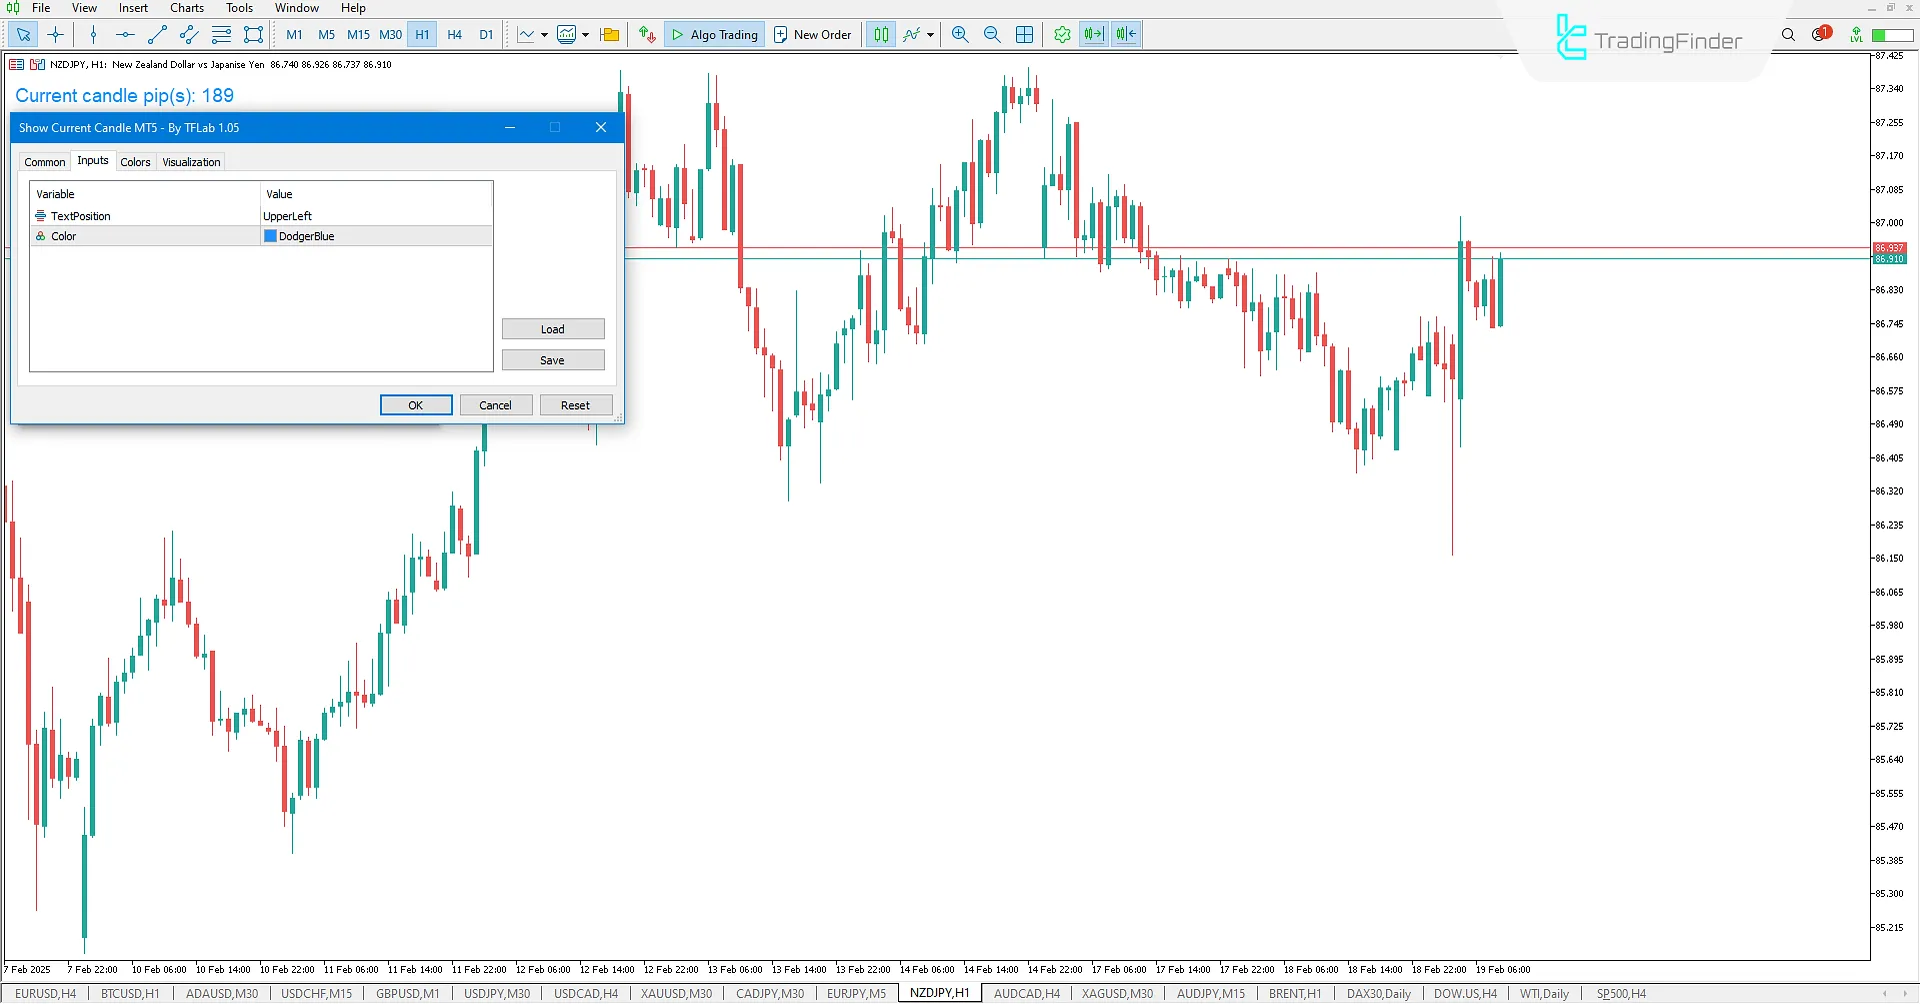
- TextPosition: Adjust the position of the indicator display on the chart
- Clr: Customize the indicator color
Conclusion
The Show Current Candle Indicator (SCC) is one of the candlestick indicators for MetaTrader 5 Technical analysis. It allows traders to measure the price movement of the current candle in pips (Pips).
The SCC Indicator is used to analyze price fluctuations in the current candle and displays the information accurately and in real-time on the chart.
This tool enables traders to evaluate the strength of price movements in real-time and make better trading decisions based on this data.
Show Current Candle SCC MT5 PDF
Show Current Candle SCC MT5 PDF
Click to download Show Current Candle SCC MT5 PDFWhat is the Show Current Candle (SCC) Indicator?
The SCC Indicator is a price action tool for MetaTrader 5 (MT5) that calculates the current candle's price movement from its highest to lowest price and displays it numerically in the top-left corner of the chart.
What data does the Show Current Candle (SCC) Indicator display?
This indicator shows the current candle’s price movement in pips (Pipettes), enabling traders to analyze price volatility in real time.


