![Sideway Trend Indicator for MetaTrader 5 Download - Free - [TradingFinder]](https://cdn.tradingfinder.com/image/163843/4-28-en-sideway-trend-mt5-1.webp)
![Sideway Trend Indicator for MetaTrader 5 Download - Free - [TradingFinder] 0](https://cdn.tradingfinder.com/image/163843/4-28-en-sideway-trend-mt5-1.webp)
![Sideway Trend Indicator for MetaTrader 5 Download - Free - [TradingFinder] 1](https://cdn.tradingfinder.com/image/163822/4-28-en-sideway-trend-mt5-2.webp)
![Sideway Trend Indicator for MetaTrader 5 Download - Free - [TradingFinder] 2](https://cdn.tradingfinder.com/image/163837/4-28-en-sideway-trend-mt5-3.webp)
![Sideway Trend Indicator for MetaTrader 5 Download - Free - [TradingFinder] 3](https://cdn.tradingfinder.com/image/163826/4-28-en-sideway-trend-mt5-4.webp)
The Sideway Trend Indicator is designed for traders who struggle during neutral or non-trending market periods.
This Trading Assist indicator that, by identifying range areas and analyzing price movements precisely, enables users in MetaTrader 5 indicators to recognize trendless market periods and avoid entering unsuitable or high-risk trades under these conditions.
Sideway Trend Indicator Specifications
The complete specifications of this indicator are visible in the table below:
Indicator Categories: | Oscillators MT5 Indicators Signal & Forecast MT5 Indicators Trading Assist MT5 Indicators |
Platforms: | MetaTrader 5 Indicators |
Trading Skills: | Intermediate |
Indicator Types: | Range MT5 Indicators Leading MT5 Indicators |
Timeframe: | Multi-Timeframe MT5 Indicators |
Trading Style: | Day Trading MT5 Indicators |
Trading Instruments: | Forex MT5 Indicators Crypto MT5 Indicators Stock MT5 Indicators Share Stock MT5 Indicators |
Indicator Overview
The Sideway Trend Indicator utilizes precise price movement analysis to highlight non-trending zones in green, helping traders avoid making incorrect trades during these periods.
When the indicator line moves out of the neutral zone, it generates specific trading signals.A blue line signifies the beginning of an uptrend, while a red line indicates the onset of a downtrend.
Indicator in an Uptrend
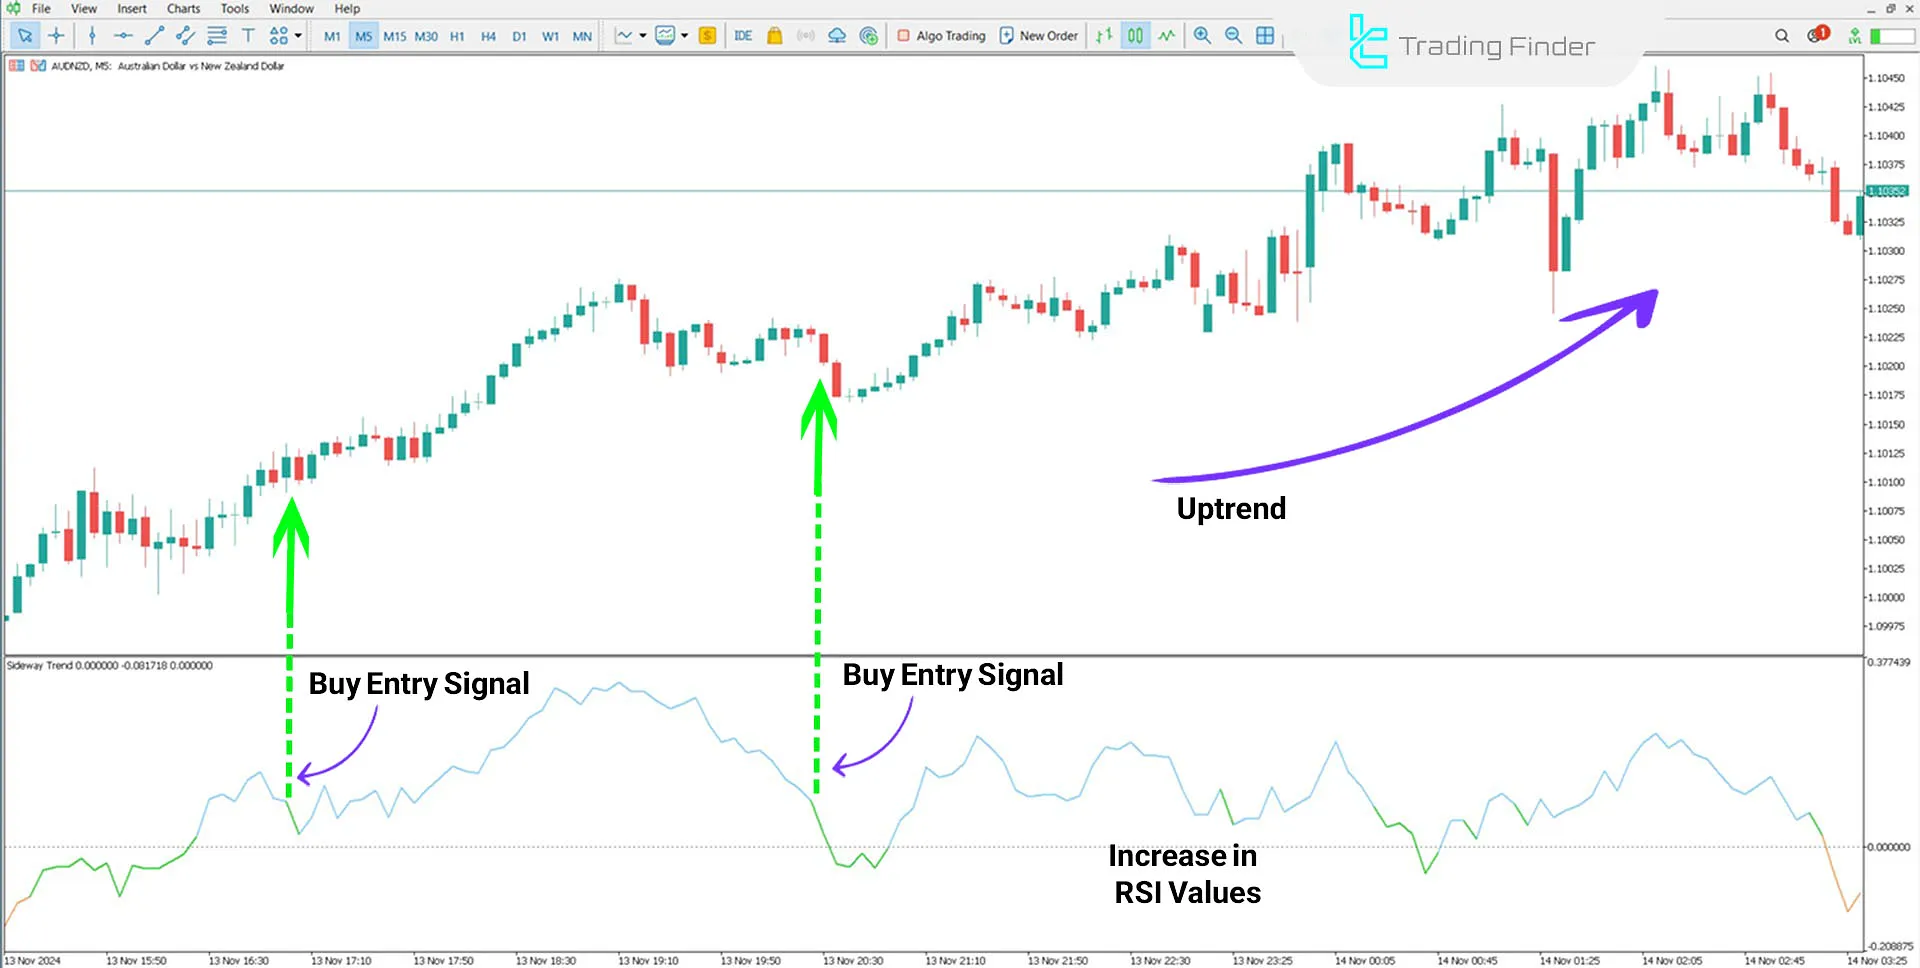
In the AUD/NZD currency pair on the 5-minute timeframe, when the indicator line exits the neutral zone and moves upwards, it turns blue.
This change signals the beginning of an uptrend. In such conditions, traders can enter buy trades, as buying pressure increases, suggesting a higher probability of price growth.

Indicator in a Downtrend
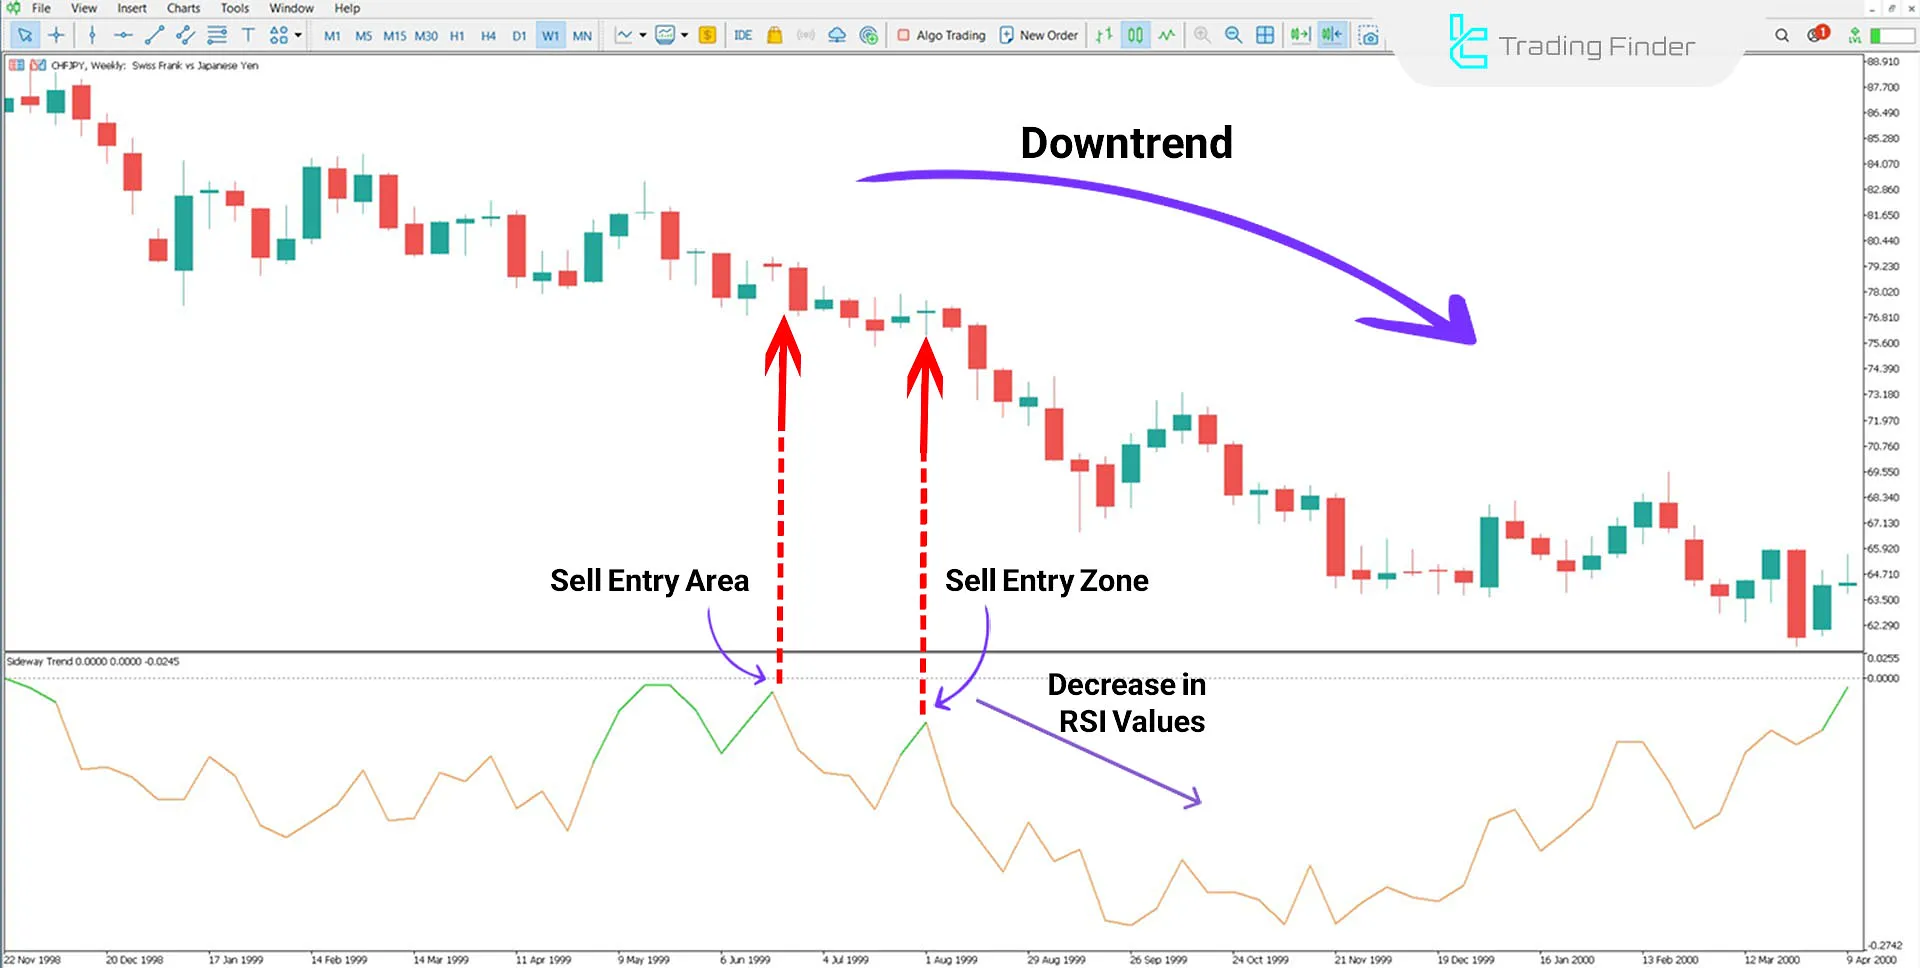
On the CHF/JPY price chart in the weekly timeframe, the indicator line exits the neutral zone and turns red, marking the start of a downtrend.
This scenario reflects increased selling pressure and a potential price decline. Traders can take advantage of this downtrend to generate profits.

Sideway Trend Indicator Settings
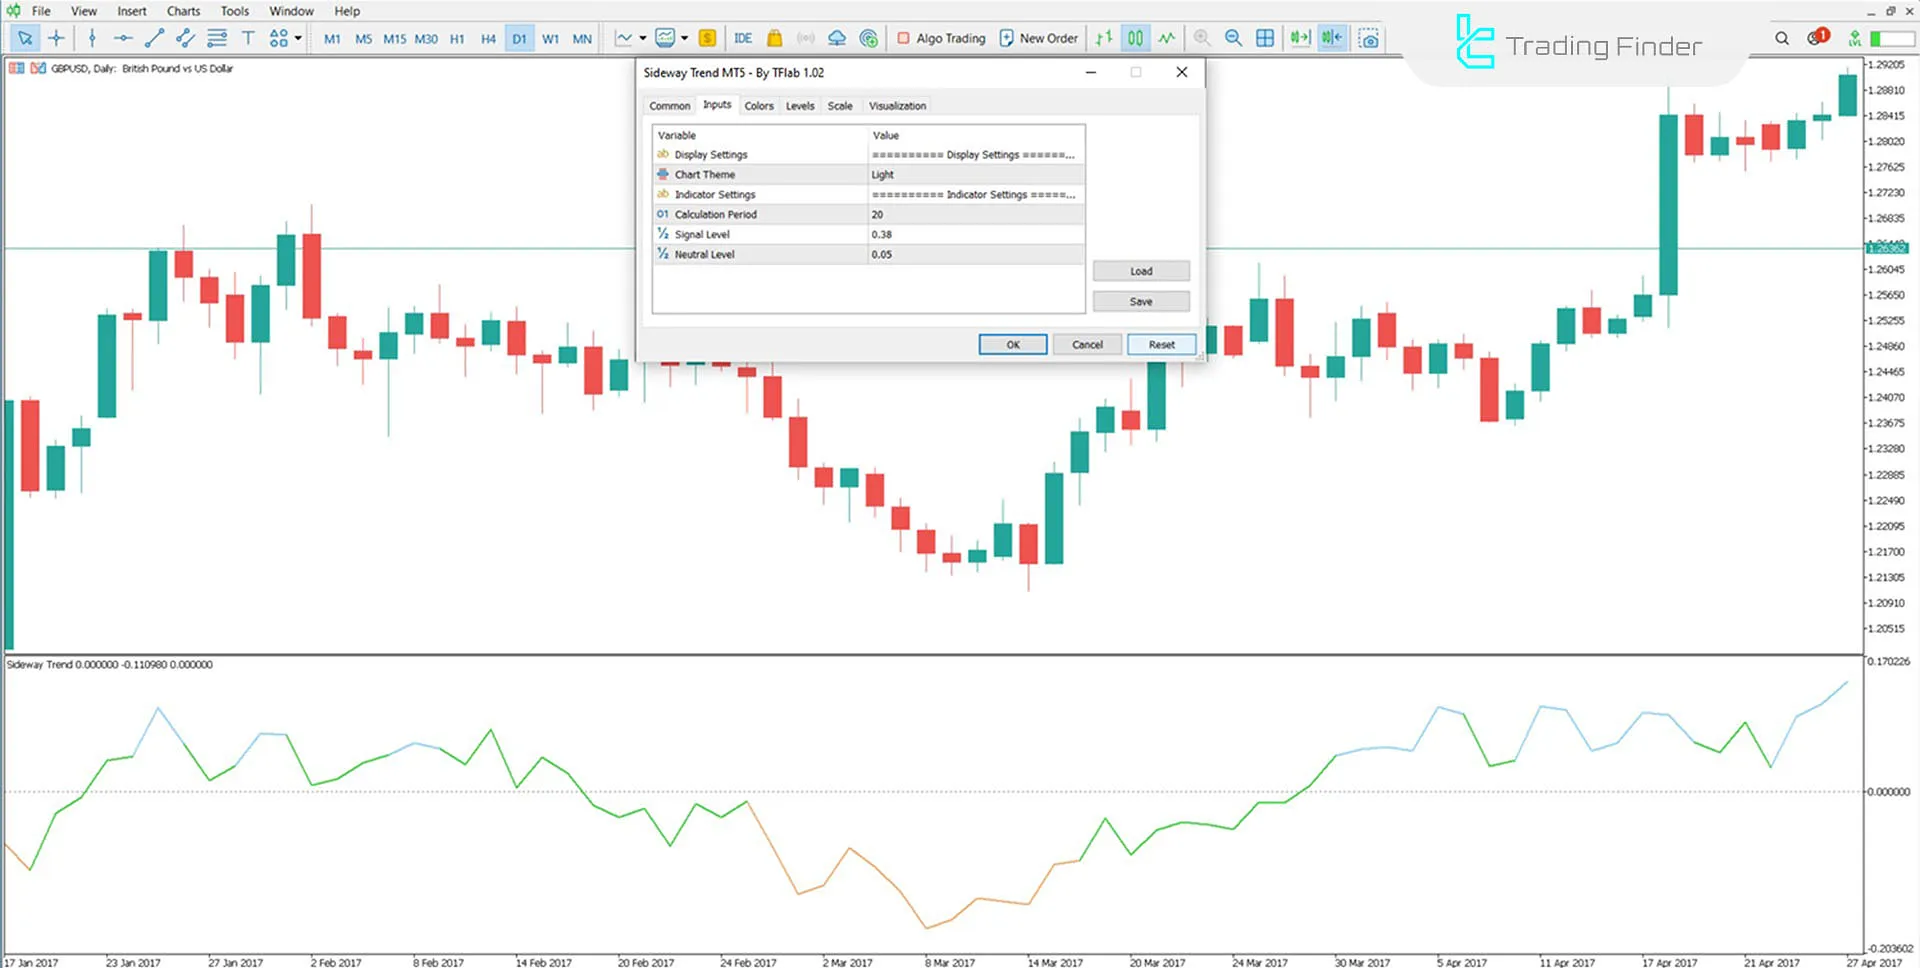
You can view the indicator settings in the image below:

- Chart Theme: Indicator background image;
- RSI Period: The calculation period of the indicator; the default value is 20;
- Signal Level: Customizable level on the chart; the default value is 0.38;
- Neutral Level: Displays the neutral zone; the default value is 0.05.
Conclusion
The Sideway Trend Indicator (Sideway Trend) is not just an analytical tool but also a smart filter for eliminating errors during non-trending periods.
Its ability to swiftly detect market changes and distinguish neutral zones from actual trends is among its standout features.
Sideway Trend MT5 PDF
Sideway Trend MT5 PDF
Click to download Sideway Trend MT5 PDFIs this indicator suitable for beginner traders?
Yes, thanks to its simple interface and clear signals, this indicator is also suitable for beginners.
Can this indicator be combined with other tools?
Yes, the Neutral Trend Indicator can be combined with other analytical tools, such as Moving Averages or the Relative Strength Index (RSI), to enhance analysis accuracy.


