


![Sideways Detector indicator for MT5 - Download - [TradingFinder]](https://cdn.tradingfinder.com/image/292549/2-37-en-sideways-detector-mt5-1.webp)
![Sideways Detector indicator for MT5 - Download - [TradingFinder] 1](https://cdn.tradingfinder.com/image/292514/2-37-en-sideways-detector-mt5-2.webp)
![Sideways Detector indicator for MT5 - Download - [TradingFinder] 2](https://cdn.tradingfinder.com/image/292547/2-37-en-sideways-detector-mt5-3.webp)
![Sideways Detector indicator for MT5 - Download - [TradingFinder] 3](https://cdn.tradingfinder.com/image/292551/2-37-en-sideways-detector-mt5-4.webp)
The Sideways Detector Indicator is a technical analysis tool in the MetaTrader 5 platform, designed to identify non-trending zones. This tool draws a navy blue box to display price equilibrium ranges and determine market conditions.
This MetaTrader 5 indicator analyzes price movements using internal algorithms to determine whether the market is in a neutral phase or forming a new trend.
Sideways Detector Indicator Specifications Table
The features of the Sideways Detector Indicator are displayed in the table below.
Indicator Categories: | Price Action MT5 Indicators Trading Assist MT5 Indicators Cycles MT5 Indicators |
Platforms: | MetaTrader 5 Indicators |
Trading Skills: | Intermediate |
Indicator Types: | Range MT5 Indicators Breakout MT5 Indicators |
Timeframe: | Multi-Timeframe MT5 Indicators |
Trading Style: | Intraday MT5 Indicators |
Trading Instruments: | Forex MT5 Indicators Crypto MT5 Indicators Stock MT5 Indicators |
Indicator Overview
The Sideways Detector Indicator identifies trendless price movement ranges by drawing a navy blue box. This zone serves as a key level for managing trades, exiting positions, or an entry opportunity for fast scalpers.
Uptrend Conditions
The image below displays the Dow Jones (DJI) price chart in a 4-hour timeframe. Trendless candles within a price range indicate market indecision.
If the price breaks above the navy blue area, this confirms strong buyer activity and signals an exit from the range cycle. As a result, many traders consider this breakout as a buy entry signal.
Downtrend Conditions
The Nikkei Stock Index (NIKKEI) price chart is displayed in a 15-minute timeframe. The Sideways Detector Indicator highlights trendless zones in navy blue to facilitate range market identification.
If a candle stabilizes below this level, it confirms price exiting the range phase and increases the probability of a new downward movement.
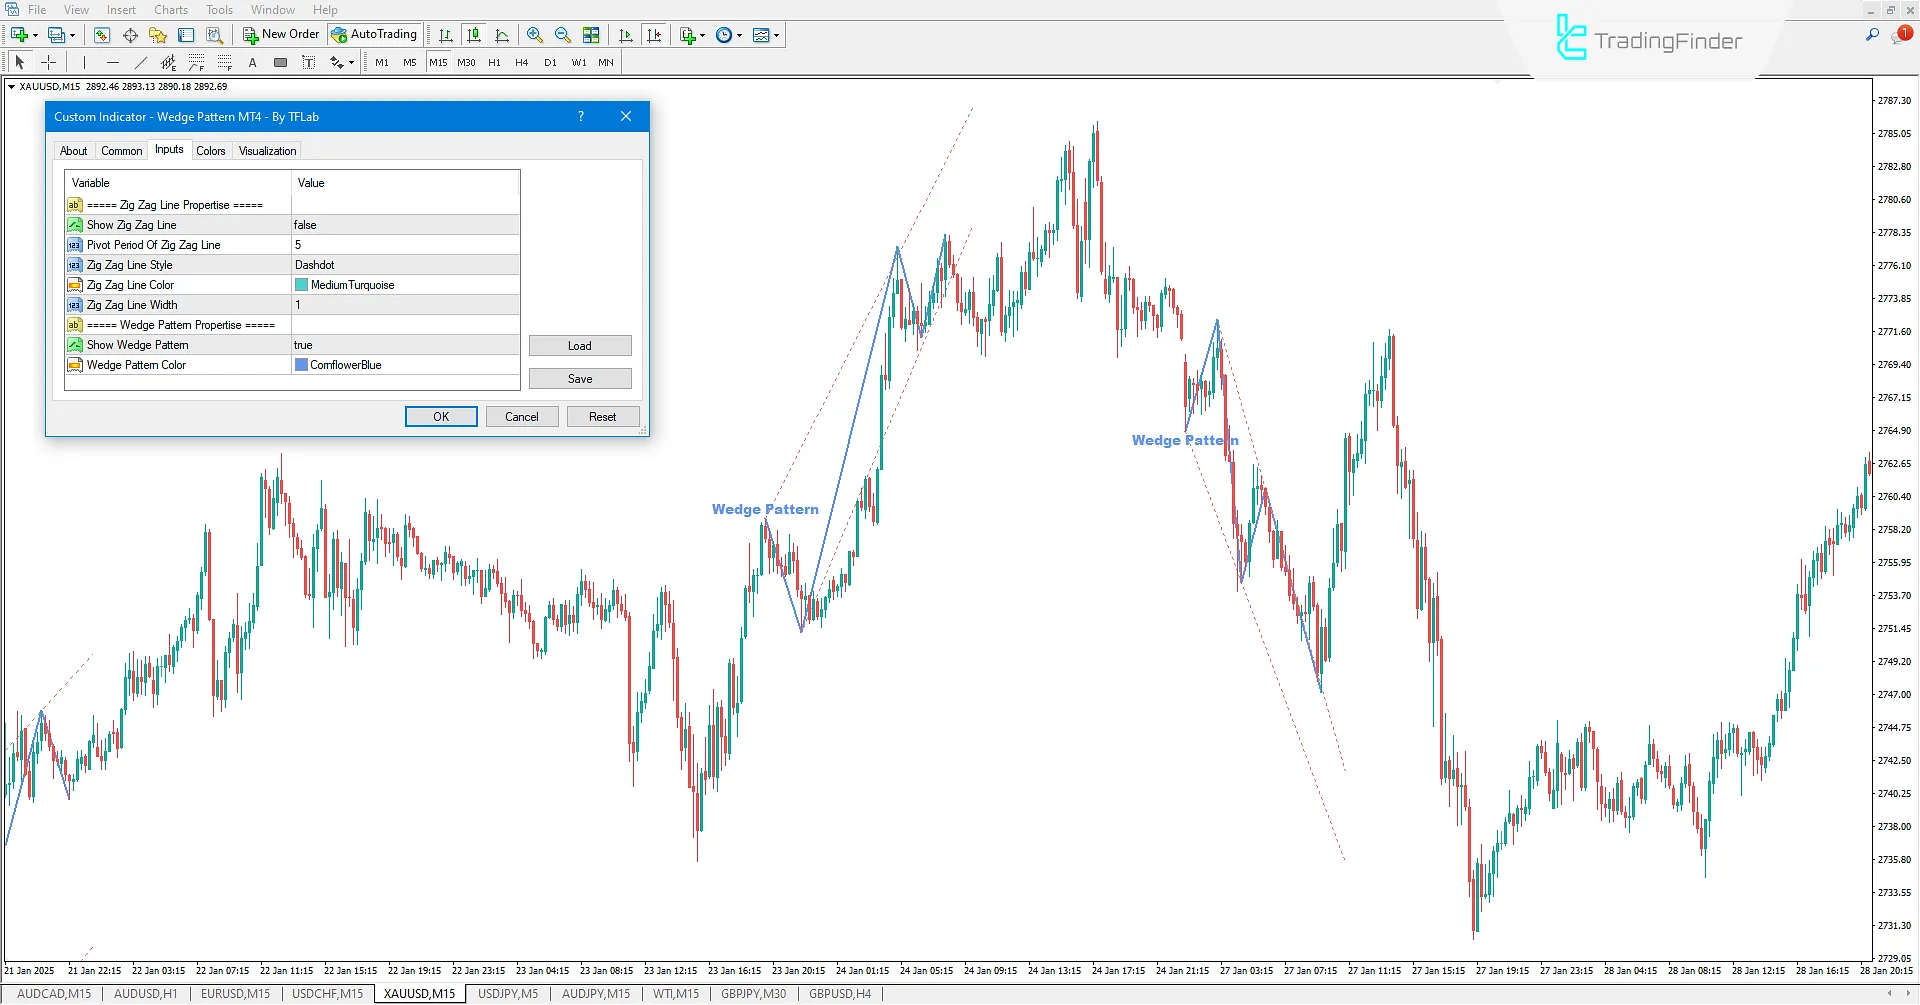
Indicator Settings
Image below displays the adjustable parameters in the Sideways Detector Indicator settings panel:
- Average Weight Factor: Weighted average coefficient
- Min Width: Minimum range width
- Tolerance: Tolerance or sensitivity level
- Zone Color: Zone color
- Show Last N Zones: Display the last N zones
- Lookback: Number of examined candles
Conclusion
The Sideways Detector Indicator automatically detects neutral or non-trending market conditions (sideways markets). This MetaTrader 5 Trading Assisthelps identify range-bound zones, preventing traders from entering choppy and trendless markets.
Sideways Detector indicator MT5 PDF
Sideways Detector indicator MT5 PDF
Click to download Sideways Detector indicator MT5 PDFUnder what conditions does the Sideways Detector Indicator generate entry and exit points?
This trading tool defines entry and exit levels when a candle stabilizes above or below the navy blue box.
Is the Sideways Detector Indicator only applicable to short-term timeframes?
No, this indicator is multi-timeframe and can be used across all timeframes.


