![SMT Divergence Indices Indicator (ICT) for MT5 Download – Free – [TFlab]](https://cdn.tradingfinder.com/image/261472/11-67-en-smt-divergene-dow-sp500-nd100-mt5-01.webp)
![SMT Divergence Indices Indicator (ICT) for MT5 Download – Free – [TFlab] 0](https://cdn.tradingfinder.com/image/261472/11-67-en-smt-divergene-dow-sp500-nd100-mt5-01.webp)
![SMT Divergence Indices Indicator (ICT) for MT5 Download – Free – [TFlab] 1](https://cdn.tradingfinder.com/image/261480/11-67-en-smt-divergene-dow-sp500-nd100-mt5-02.webp)
![SMT Divergence Indices Indicator (ICT) for MT5 Download – Free – [TFlab] 2](https://cdn.tradingfinder.com/image/261475/11-67-en-smt-divergene-dow-sp500-nd100-mt5-03.webp)
![SMT Divergence Indices Indicator (ICT) for MT5 Download – Free – [TFlab] 3](https://cdn.tradingfinder.com/image/261469/11-67-en-smt-divergene-dow-sp500-nd100-mt5-04.webp)
The SMT Divergence Indices ICT indicator is one of the indicators in the ICT MetaTrader 5 style, allowing traders to identify three types of divergences across three key financial market indices.
This indicator can detect trendline divergence, higher-low divergences, and smart money divergence.
Designed for three indices: Dow Jones (DJI), NASDAQ, and S&P 500, traders can use it to spot critical divergence levels and enhance their trading decisions.
This tool enables analysts to uncover hidden market trends and determine optimal entry and exit points based on specialized analysis.
SMT Divergence Indices Indicator Overview Table
The table below provides the general specifications for the SMT Divergence Indices Indicator (ICT).
Indicator Categories: | Smart Money MT5 Indicators Trading Assist MT5 Indicators ICT MT5 Indicators |
Platforms: | MetaTrader 5 Indicators |
Trading Skills: | Advanced |
Indicator Types: | Breakout MT5 Indicators Entry & Exit MT5 Indicators Reversal MT5 Indicators |
Timeframe: | Multi-Timeframe MT5 Indicators |
Trading Style: | Intraday MT5 Indicators Day Trading MT5 Indicators Fast Scalper MT5 Indicators |
Trading Instruments: | Forex MT5 Indicators Stock MT5 Indicators Indices MT5 Indicators |
Trend Line Divergence
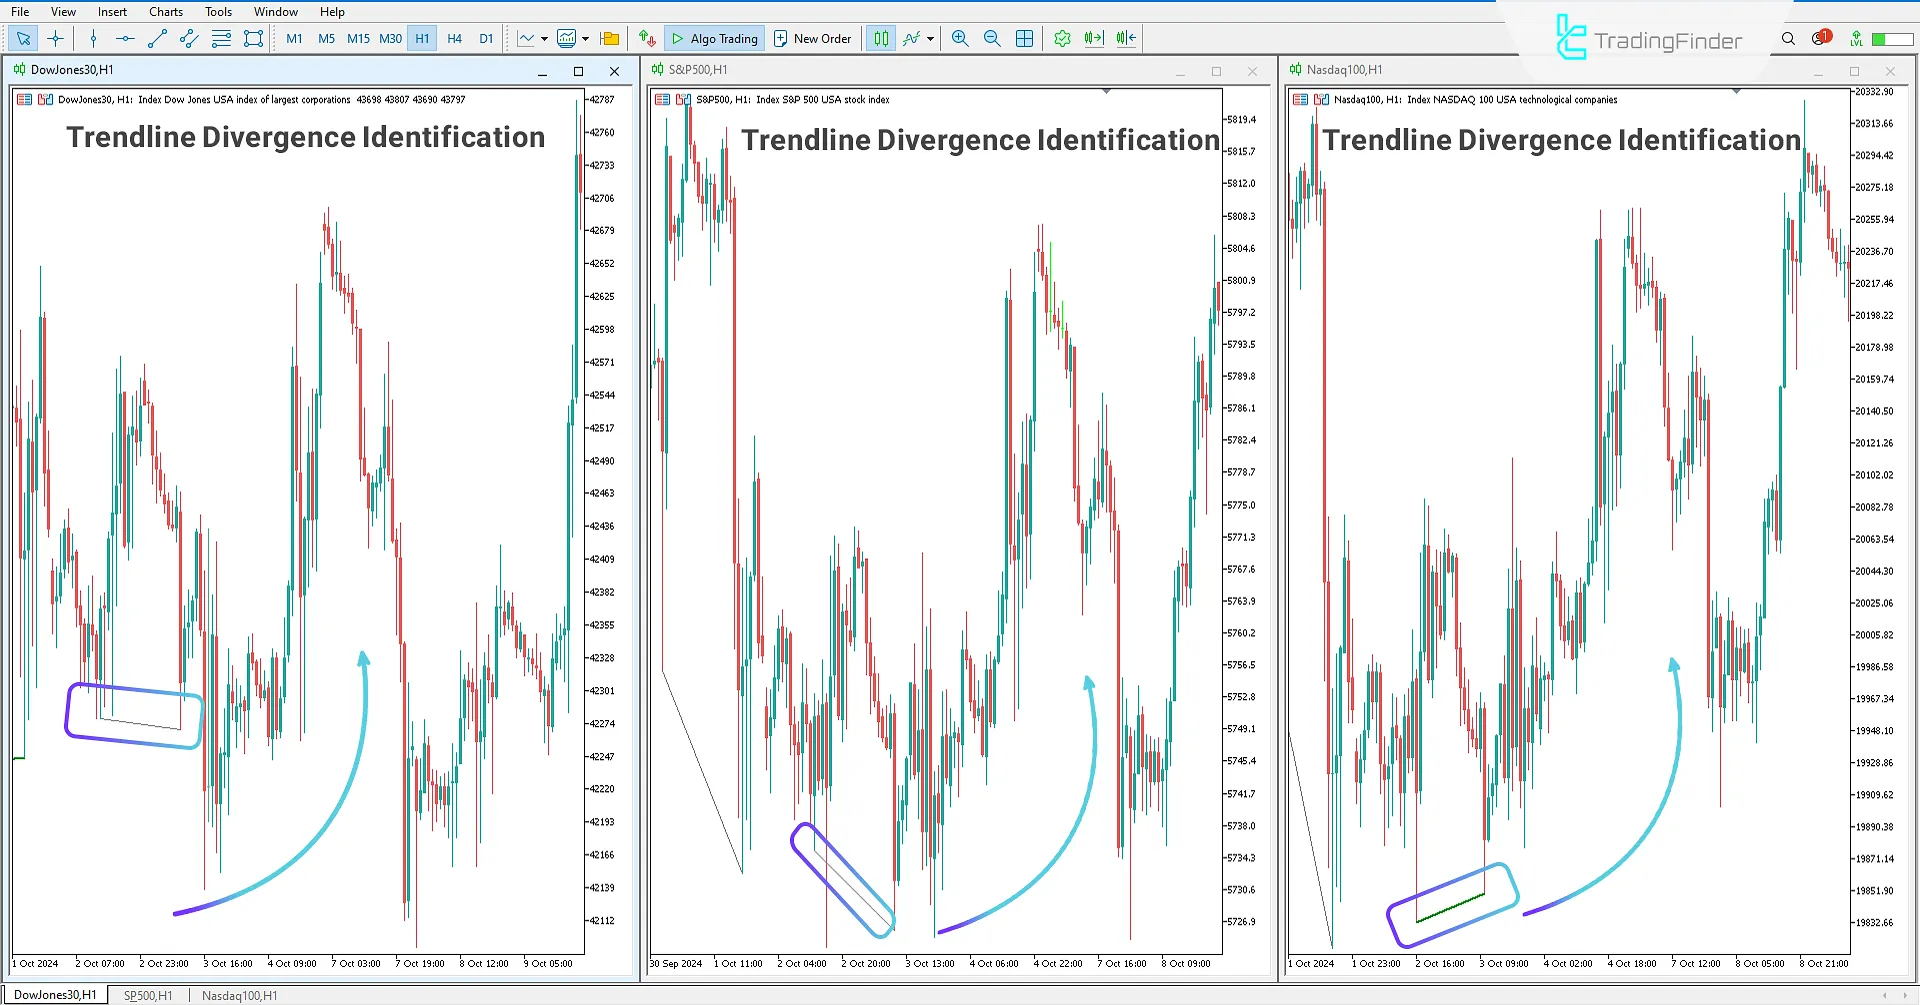
In the charts below, the Dow Jones, NASDAQ, and S&P 500 indices show how the SMT Divergence Indices Indicator identifies a trend line divergence. In the Dow Jones and S&P 500 symbols, a downtrend line is identified, while in the NASDAQ, an uptrend line is detected.
This divergence indicates a potential change in market trend, with price starting to form higher highs and initiating an uptrend after the divergence is identified.

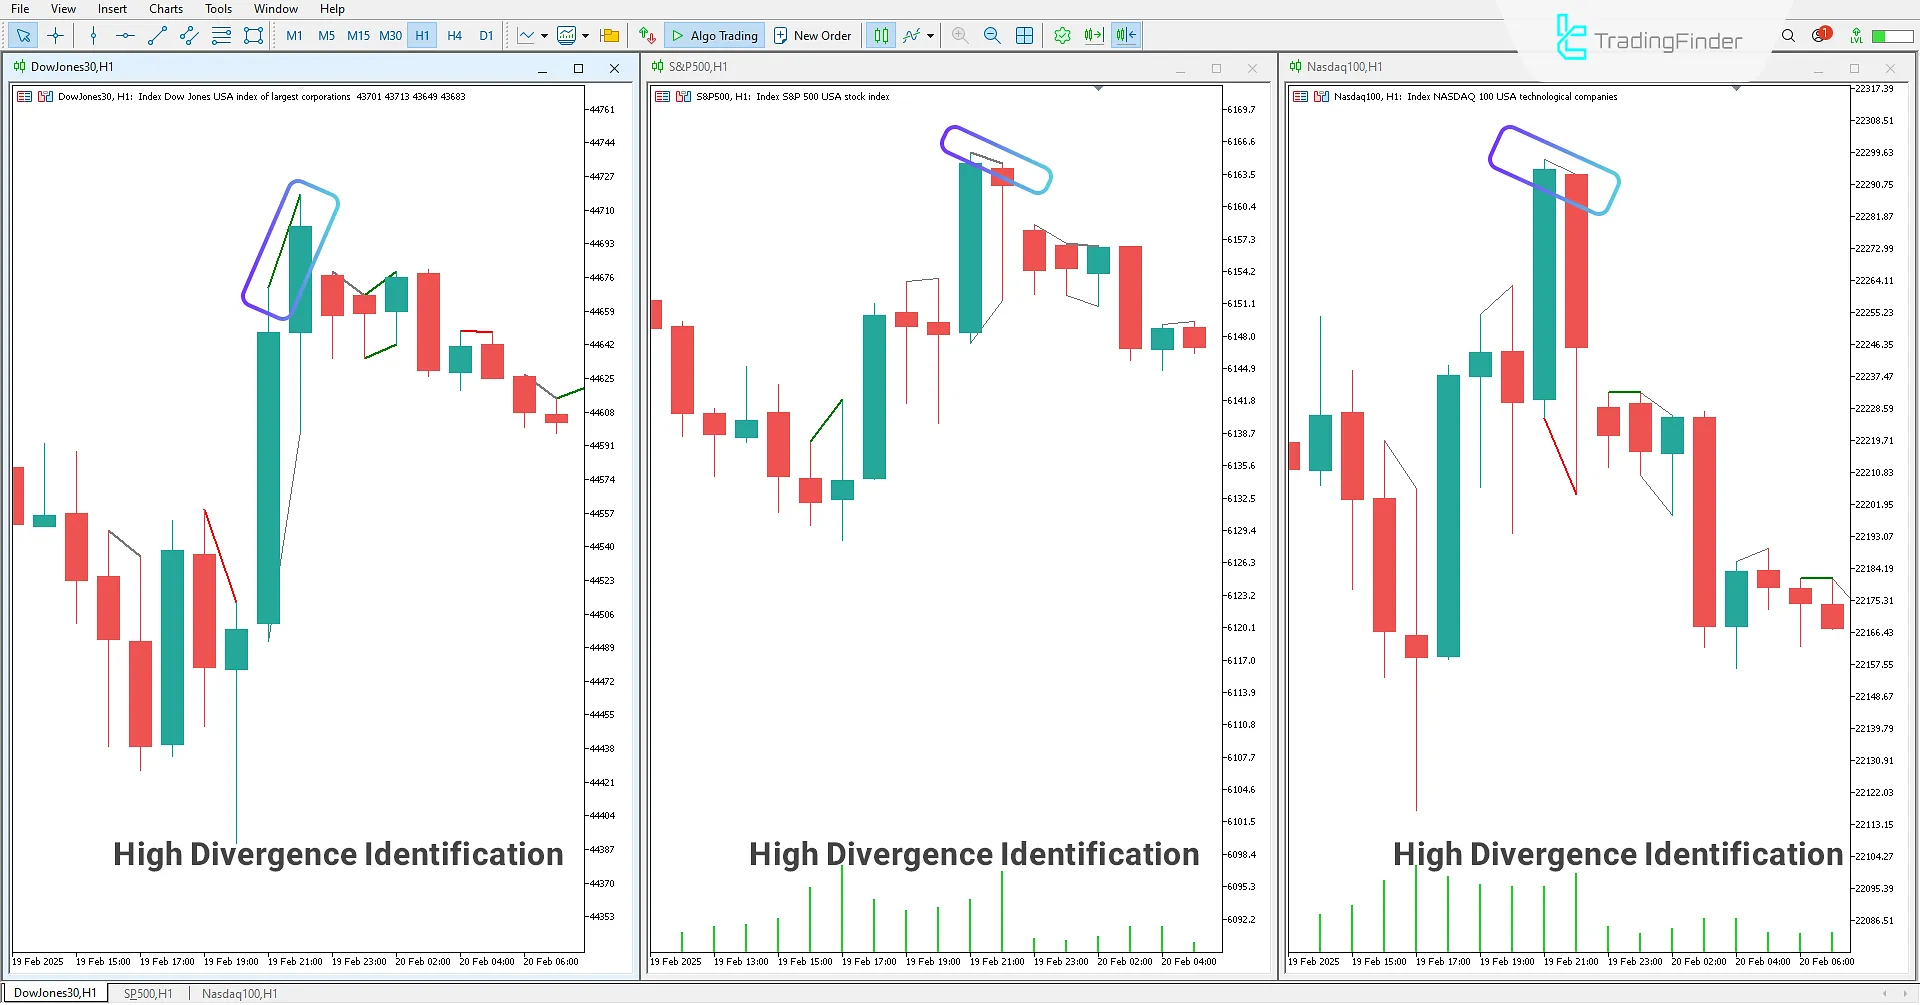
High Divergence in a Downtrend
In the charts below, the Dow Jones, NASDAQ, and S&P 500 symbols show how ICT stil traders using the SMT Divergence Indices Indicator can detect high-low divergences and make more accurate chart analysis based on this specialized tool.

Indicator Settings for SMT Divergence Indices
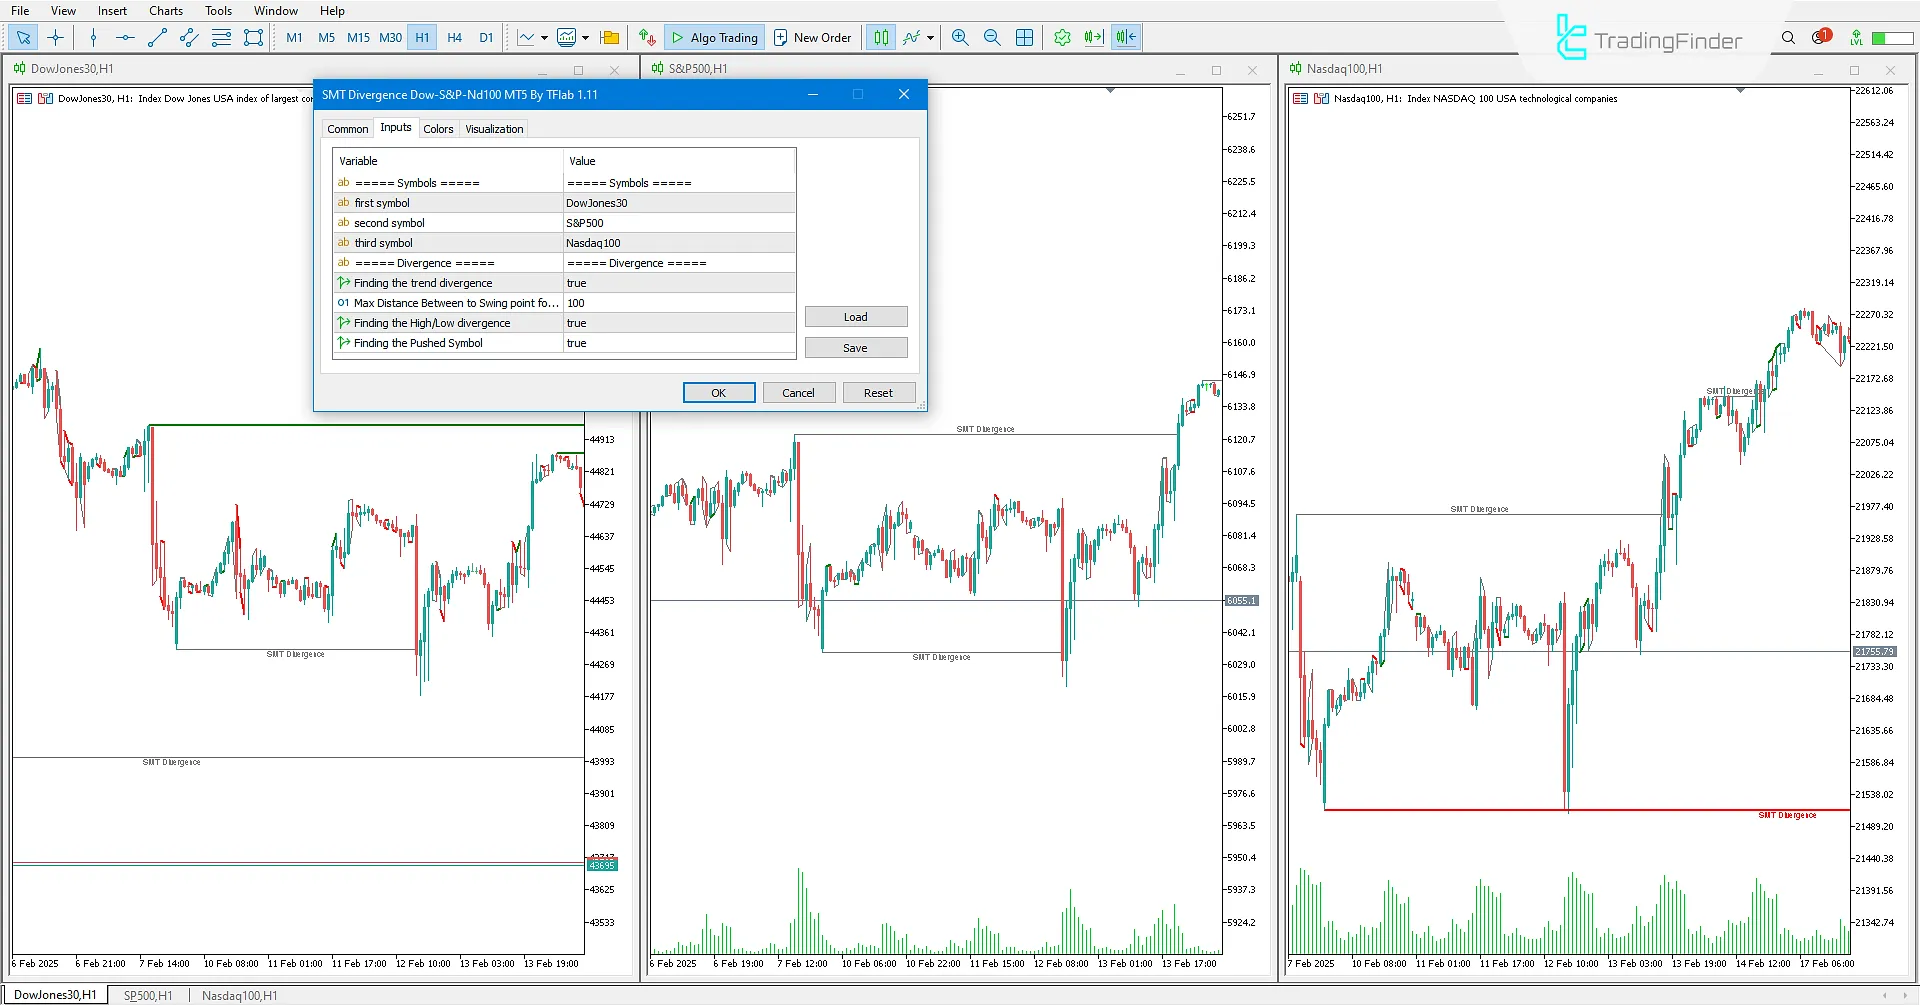
The settings for the SMT Divergence Indices Indicator (ICT) are listed below:

Symbols
- First symbol: Settings for the first symbol;
- Second symbol: Settings for the second symbol;
- Third symbol: Settings for the third symbol.
Divergence
- Finding the trend divergence: Show/Hide trend line divergence settings;
- Max Distance Between Two Swing Points: Maximum number of swings between two points;
- Finding the High/Low Divergence: Show/Hide high-low divergence settings;
- Finding the Pushed Symbol: Show/Hide SMT settings.
Conclusion
The SMT Divergence Indices ICT is one of the MetaTrader 5 indicators. This Smart Money tool allows ICT traders to identify divergences, enabling them to easily spot divergences on three symbols and identify optimal entry and exit points.
SMT Divergence Indices ICT MT5 PDF
SMT Divergence Indices ICT MT5 PDF
Click to download SMT Divergence Indices ICT MT5 PDFWhat is the SMT Divergence Indices Indicator?
The SMT Divergence Indices Indicator (ICT) is a technical analysis tool in MetaTrader 5 that helps traders identify three types of divergences in the Dow Jones, NASDAQ, and S&P 500 indices. It assists in better identifying entry and exit points.
What types of divergences does this indicator identify?
This indicator can identify three types of divergences:
- Trend line divergence
- High-low divergences
- Smart money divergence


