![SonicR VSA Indicator for MetaTrader 5 Download - Free - [TradingFinder]](https://cdn.tradingfinder.com/image/317519/11-77-en-sonicr-vsa-mt5-01.webp)
![SonicR VSA Indicator for MetaTrader 5 Download - Free - [TradingFinder] 0](https://cdn.tradingfinder.com/image/317519/11-77-en-sonicr-vsa-mt5-01.webp)
![SonicR VSA Indicator for MetaTrader 5 Download - Free - [TradingFinder] 1](https://cdn.tradingfinder.com/image/317525/11-77-en-sonicr-vsa-mt5-02.webp)
![SonicR VSA Indicator for MetaTrader 5 Download - Free - [TradingFinder] 2](https://cdn.tradingfinder.com/image/317526/11-77-en-sonicr-vsa-mt5-03.webp)
![SonicR VSA Indicator for MetaTrader 5 Download - Free - [TradingFinder] 3](https://cdn.tradingfinder.com/image/317510/11-77-en-sonicr-vsa-mt5-04.webp)
The SonicR VSA Indicator is one of the Volume Trading Indicators for MetaTrader 5 that enables traders to analyze volume changes in the market.
This indicator uses a histogram to display volume changes in four colors: green, red, blue, and gray. As such, it is a unique tool for traders who base their trading strategies on market volume.
SonicR VSA Indicator Table
The table below outlines the general specifications of the indicator:
Indicator Categories: | Volume MT5 Indicators Price Action MT5 Indicators Volatility MT5 Indicators Currency Strength MT5 Indicators |
Platforms: | MetaTrader 5 Indicators |
Trading Skills: | Elementary |
Indicator Types: | Entry & Exit MT5 Indicators Reversal MT5 Indicators |
Timeframe: | Multi-Timeframe MT5 Indicators |
Trading Style: | Intraday MT5 Indicators Scalper MT5 Indicators Day Trading MT5 Indicators |
Trading Instruments: | Forex MT5 Indicators Stock MT5 Indicators Indices MT5 Indicators Share Stock MT5 Indicators |
The Indicator at a Glance
The SonicR VSA Indicator is a specialized tool designed for traders who adjust their trading strategies based on market volume changes, identify market trends, and execute trades accordingly.
Using its unique algorithm, this indicator allows traders to conduct a deeper analysis of market volume and price trends, while also detecting volume divergences. These features enhance decision-making accuracy and provide a deeper understanding of market behavior.
Uptrend
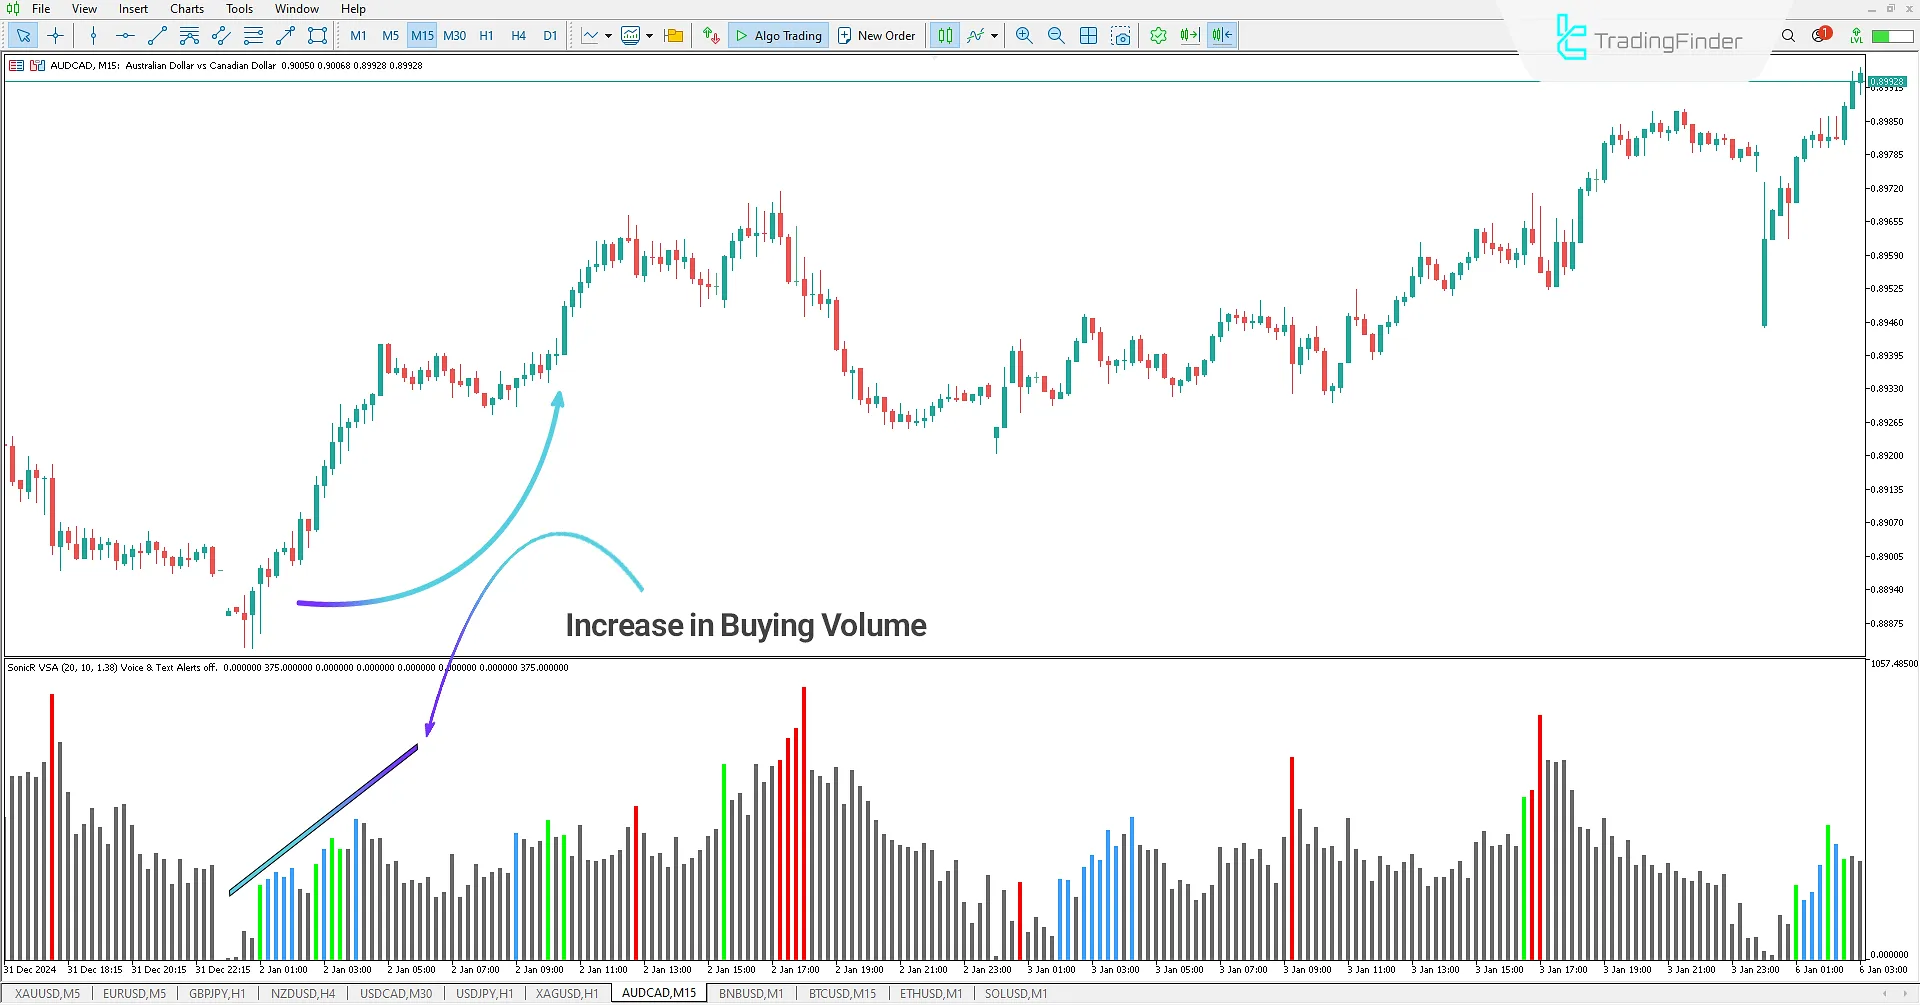
In the 15-minute chart of AUD/CAD, the price shows increasing volume, which traders can analyze using the SonicR VSA Indicator to identify the uptrend.
The indicator displays rising volume relative to the last 20 candles with green bars, indicating increased buying volume and demand pressure in the market.
Additionally, blue bars appear, representing above-average volume. This feature simplifies and enhances the identification of bullish trading opportunities.

Downtrend
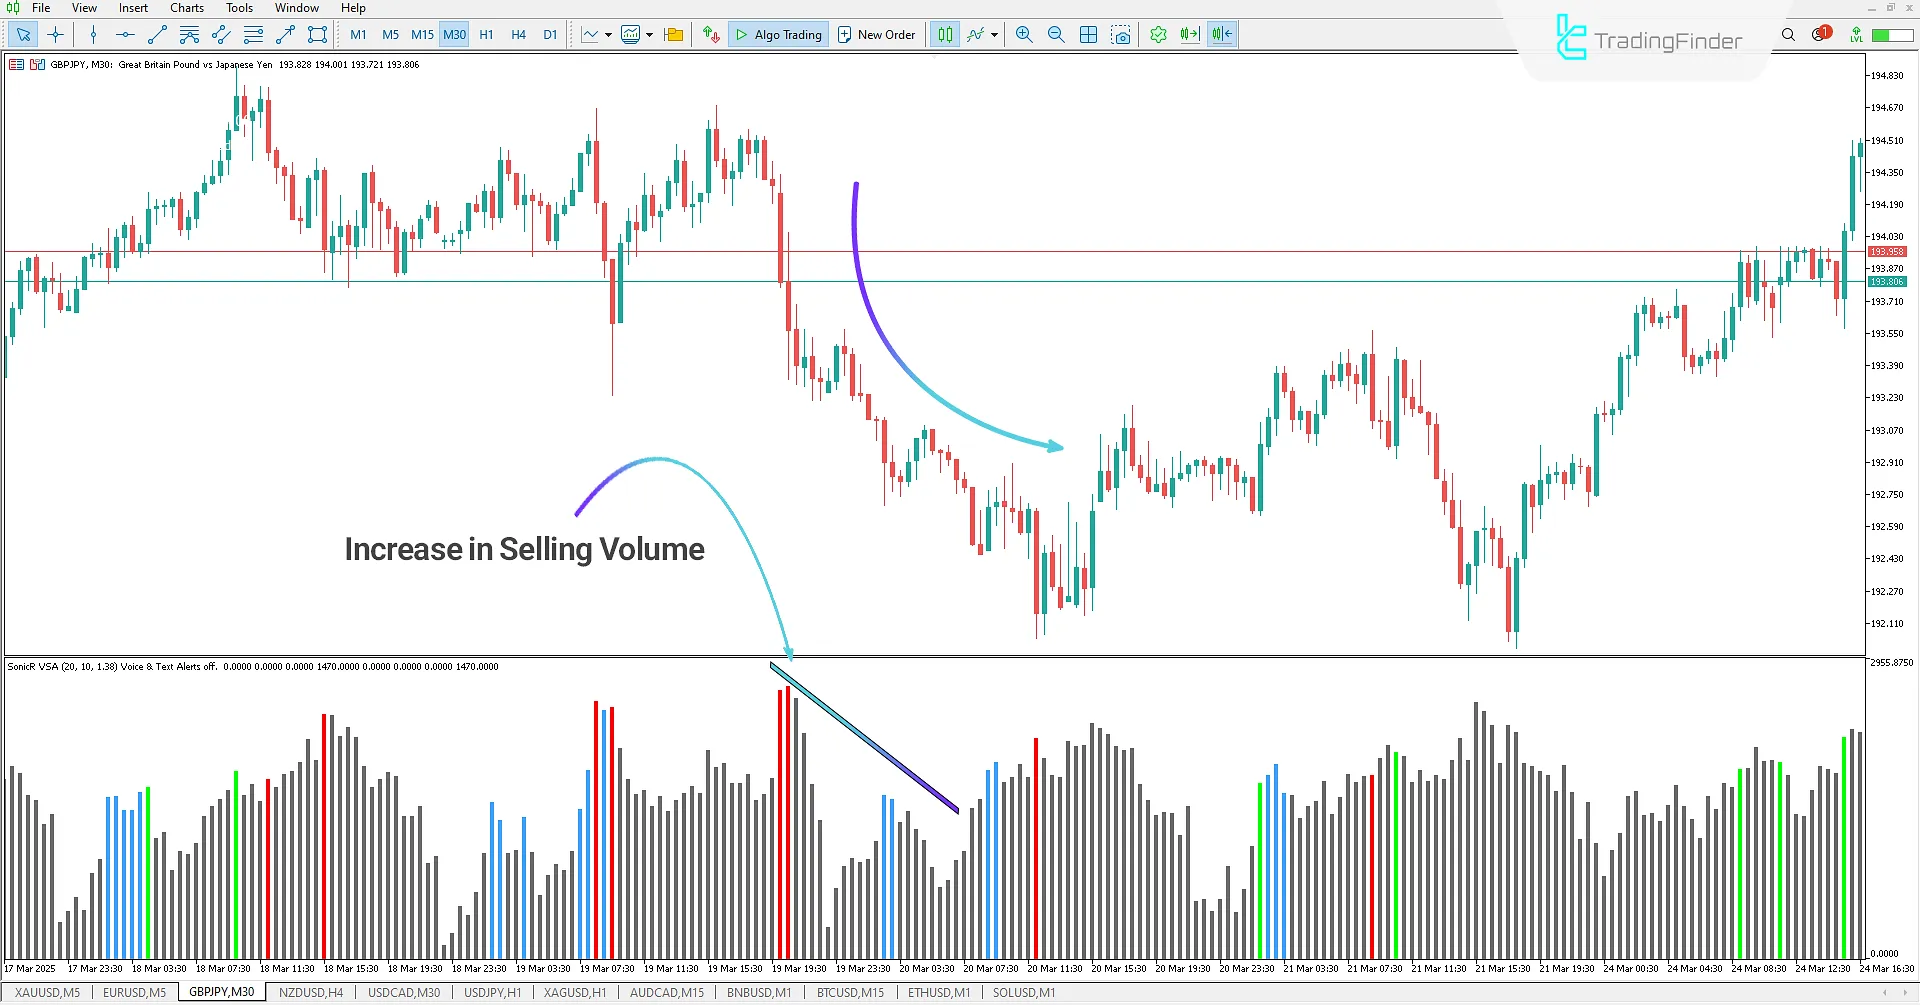
In the 30-minute chart of GBP/JPY, the SonicR VSA Indicator displays red bars, indicating selling pressure in the market.
Red bars appear when selling volume exceeds the last 20 candles and the candle is bearish. Gray bars are also shown, representing candles with moderate volume.

SonicR VSA Indicator Settings
Below are the settings for the SonicR VSA Indicator:

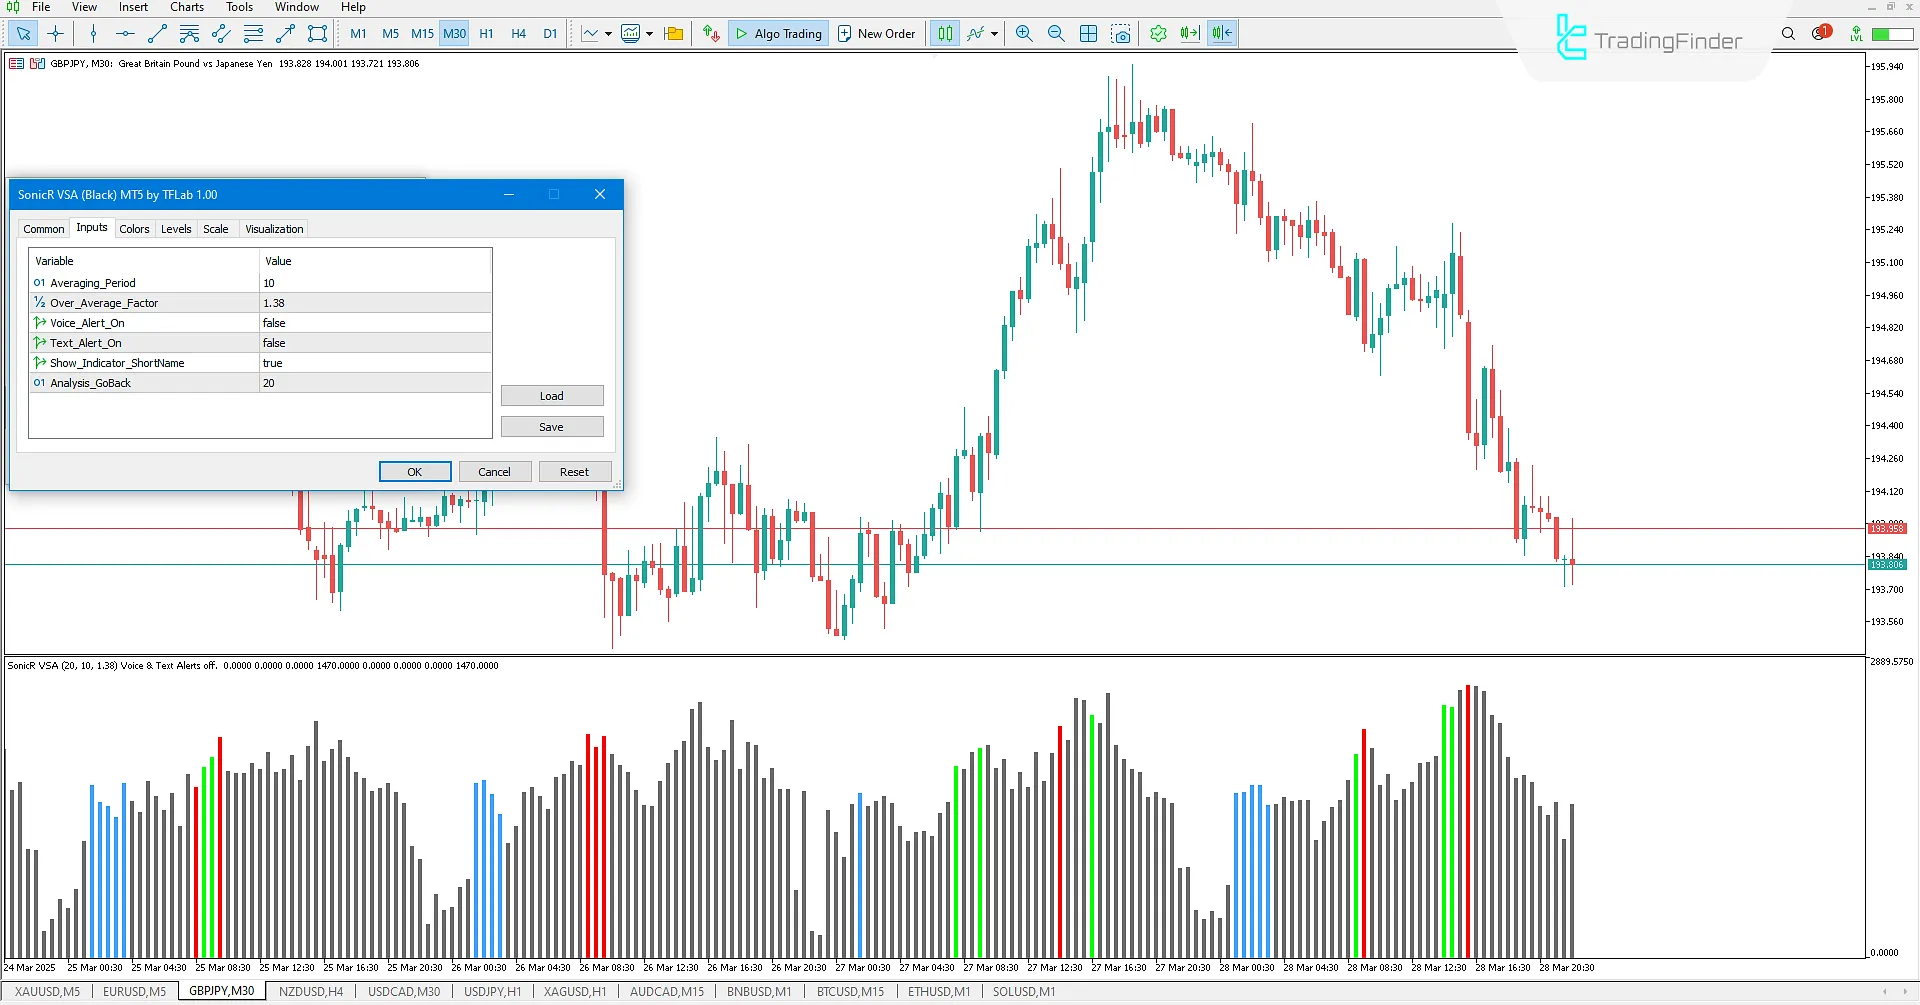
- Averaging Period: Select the number of candles for calculating the average;
- Over Average Factor: Select the factor for higher volume detection;
- Voice Alert On: Enable/disable voice alerts;
- Text Alert On: Enable/disable text alerts;
- Show Indicator Short Name: Enable/disable volume parameters in the oscillator window;
- Analysis Go Back: Select the period for identifying historical peak volume.
Conclusion
The SonicR VSA Indicator is one of the MetaTrader 5 Indicators that uses a histogram to display volume changes in the market. This oscillator simplifies volume analysis with colored bars in Technical analysis:
- Green bars: indicate increased buying volume relative to the last 20 candles;
- Red bars: represent increased selling volume in the same period;
- Blue bars: signify volume above average;
- Gray bars: denote normal candles without significant changes.
SonicR VSA MT5 PDF
SonicR VSA MT5 PDF
Click to download SonicR VSA MT5 PDFWhat are the applications of the SonicR VSA Indicator?
- Identifying market trends through volume changes
- Conducting in-depth price action analysis based on volume
- Predicting future market behavior by understanding buying/selling volume
Who is the SonicR VSA Indicator suitable for?
This tool is highly useful for price action traders, scalpers, and traders focused on market volume analysis.


