![Squeeze Break Indicator for MT5 Download - Free - [TradingFinder]](https://cdn.tradingfinder.com/image/285491/13-83-en-squeeze-break-mt5-01.webp)
![Squeeze Break Indicator for MT5 Download - Free - [TradingFinder] 0](https://cdn.tradingfinder.com/image/285491/13-83-en-squeeze-break-mt5-01.webp)
![Squeeze Break Indicator for MT5 Download - Free - [TradingFinder] 1](https://cdn.tradingfinder.com/image/285490/13-83-en-squeeze-break-mt5-02.webp)
![Squeeze Break Indicator for MT5 Download - Free - [TradingFinder] 2](https://cdn.tradingfinder.com/image/285492/13-83-en-squeeze-break-mt5-03.webp)
![Squeeze Break Indicator for MT5 Download - Free - [TradingFinder] 3](https://cdn.tradingfinder.com/image/285493/13-83-en-squeeze-break-mt5-04.webp)
The Squeeze Break Indicator is designed to detect periods of market compression. This MT5 oscillator issues entry and exit signals for all markets, including the Forex market, based on the position of the blue dashed line relative to the middle line (zero line).
Additionally, the Squeeze Break Indicator displays key trading data such as "Daily ATR" and "Today's Range" in the upper-left corner of the chart.
Squeeze Break Indicator Specifications Table
The following table outlines the key features and settings of the Squeeze Break Oscillator.
Indicator Categories: | Oscillators MT5 Indicators Signal & Forecast MT5 Indicators Currency Strength MT5 Indicators |
Platforms: | MetaTrader 5 Indicators |
Trading Skills: | Intermediate |
Indicator Types: | Range MT5 Indicators Reversal MT5 Indicators |
Timeframe: | Multi-Timeframe MT5 Indicators |
Trading Style: | Intraday MT5 Indicators Scalper MT5 Indicators |
Trading Instruments: | Forex MT5 Indicators Crypto MT5 Indicators Stock MT5 Indicators Forward MT5 Indicators |
Squeeze Break Indicator at a Glance
The Squeeze Break Oscillator provides trade entry signals based on fluctuations above and below the zero line. When the dashed blue line moves below zero, it signals a bearish trend, whereas when it moves above zero, it indicates a bullish trend.
Buy Signal
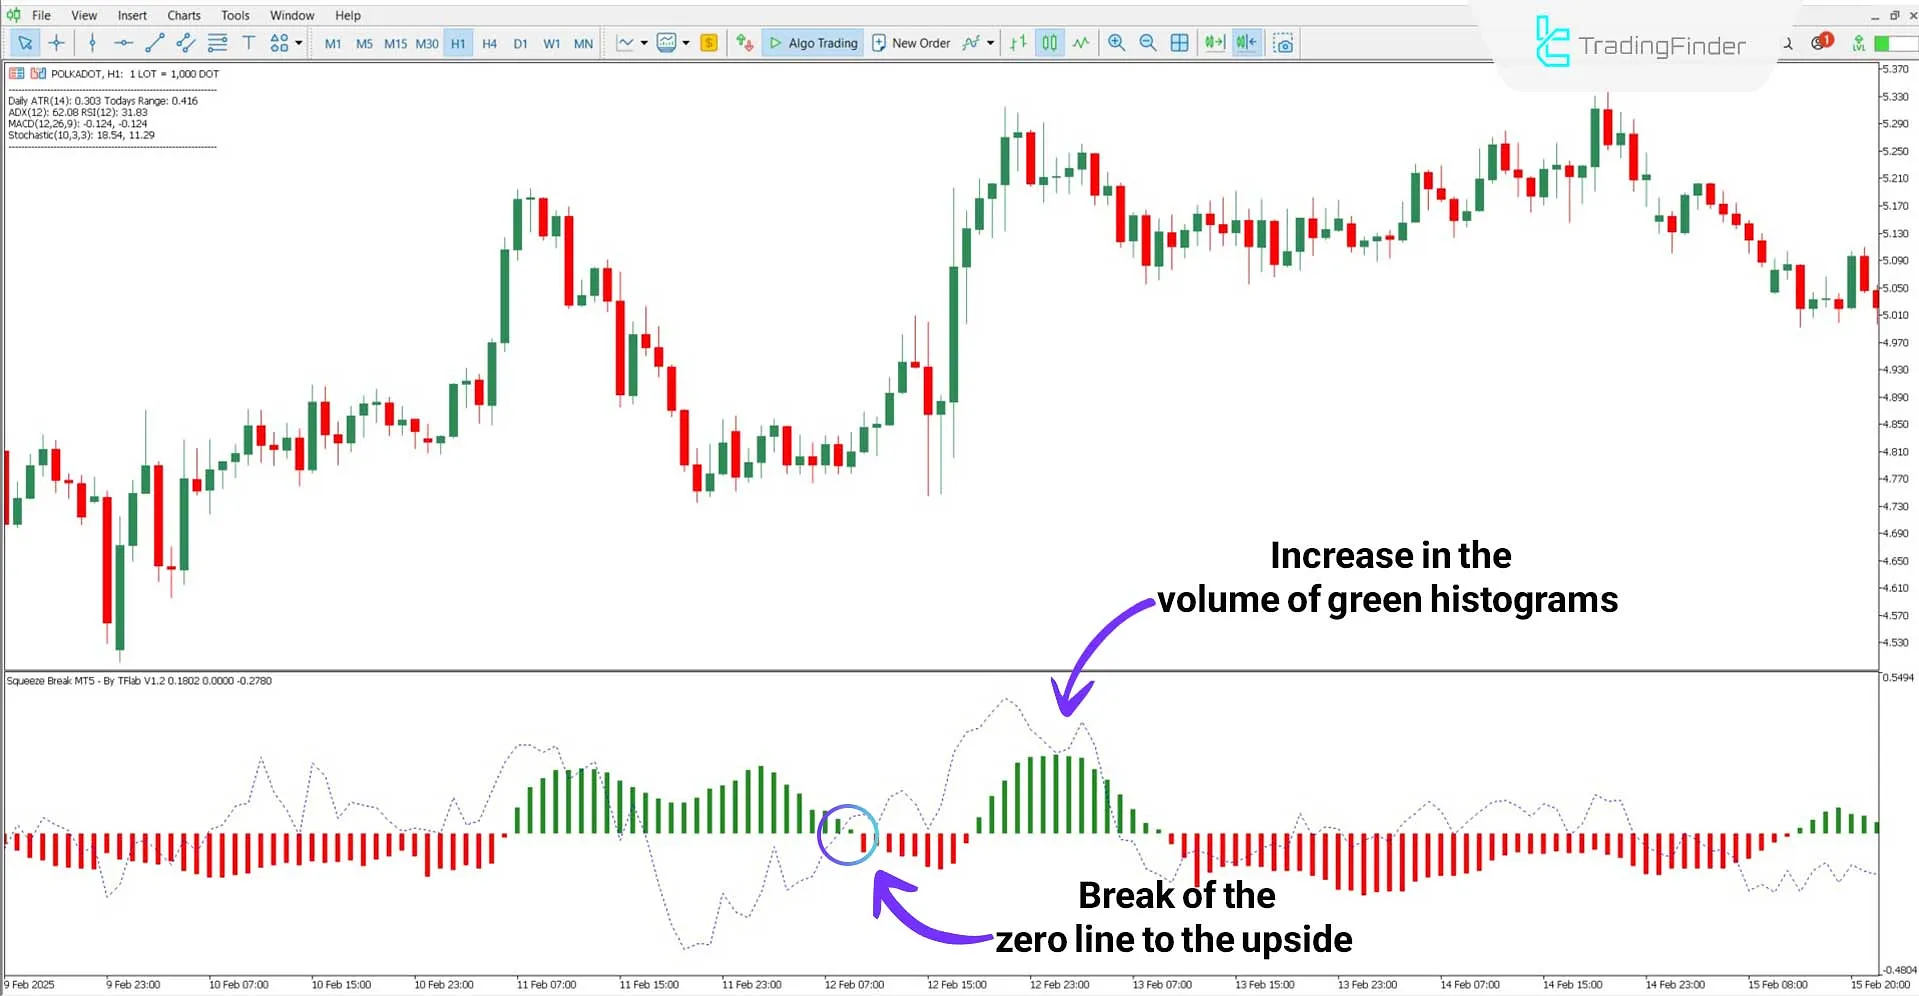
On the 1-hour Polkadot (DOT) chart, this trading tool signals a breakout from compression by forming increasing green histogram bars.
Shortly after, the dashed blue line crosses above the zero line, shifting into the positive region. This phase transition is considered a buy entry signal.

Sell Signal
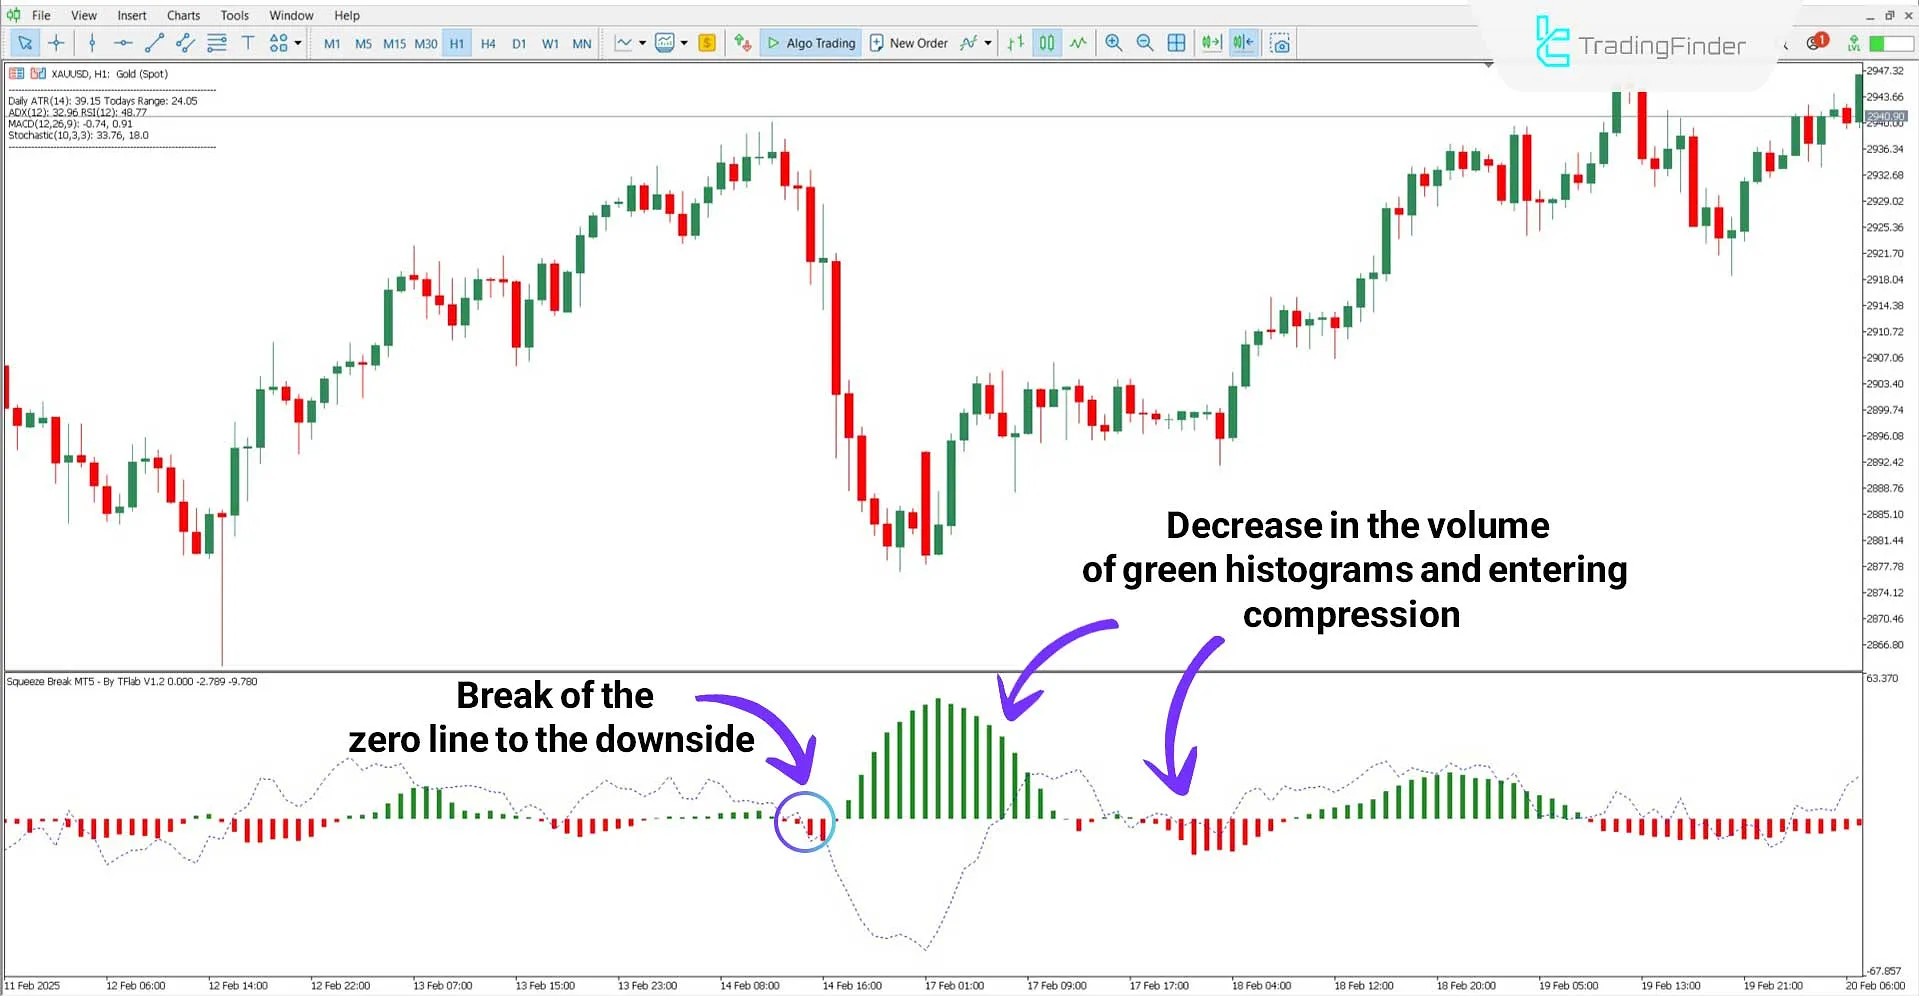
On the 1-hour Gold vs. USD (XAU/USD) chart, a decline in green histogram volume signals the beginning of a bearish trend.
When the dashed blue line breaks below zero, it confirms a trend reversal and signals selling pressure.

Squeeze Break Indicator Settings
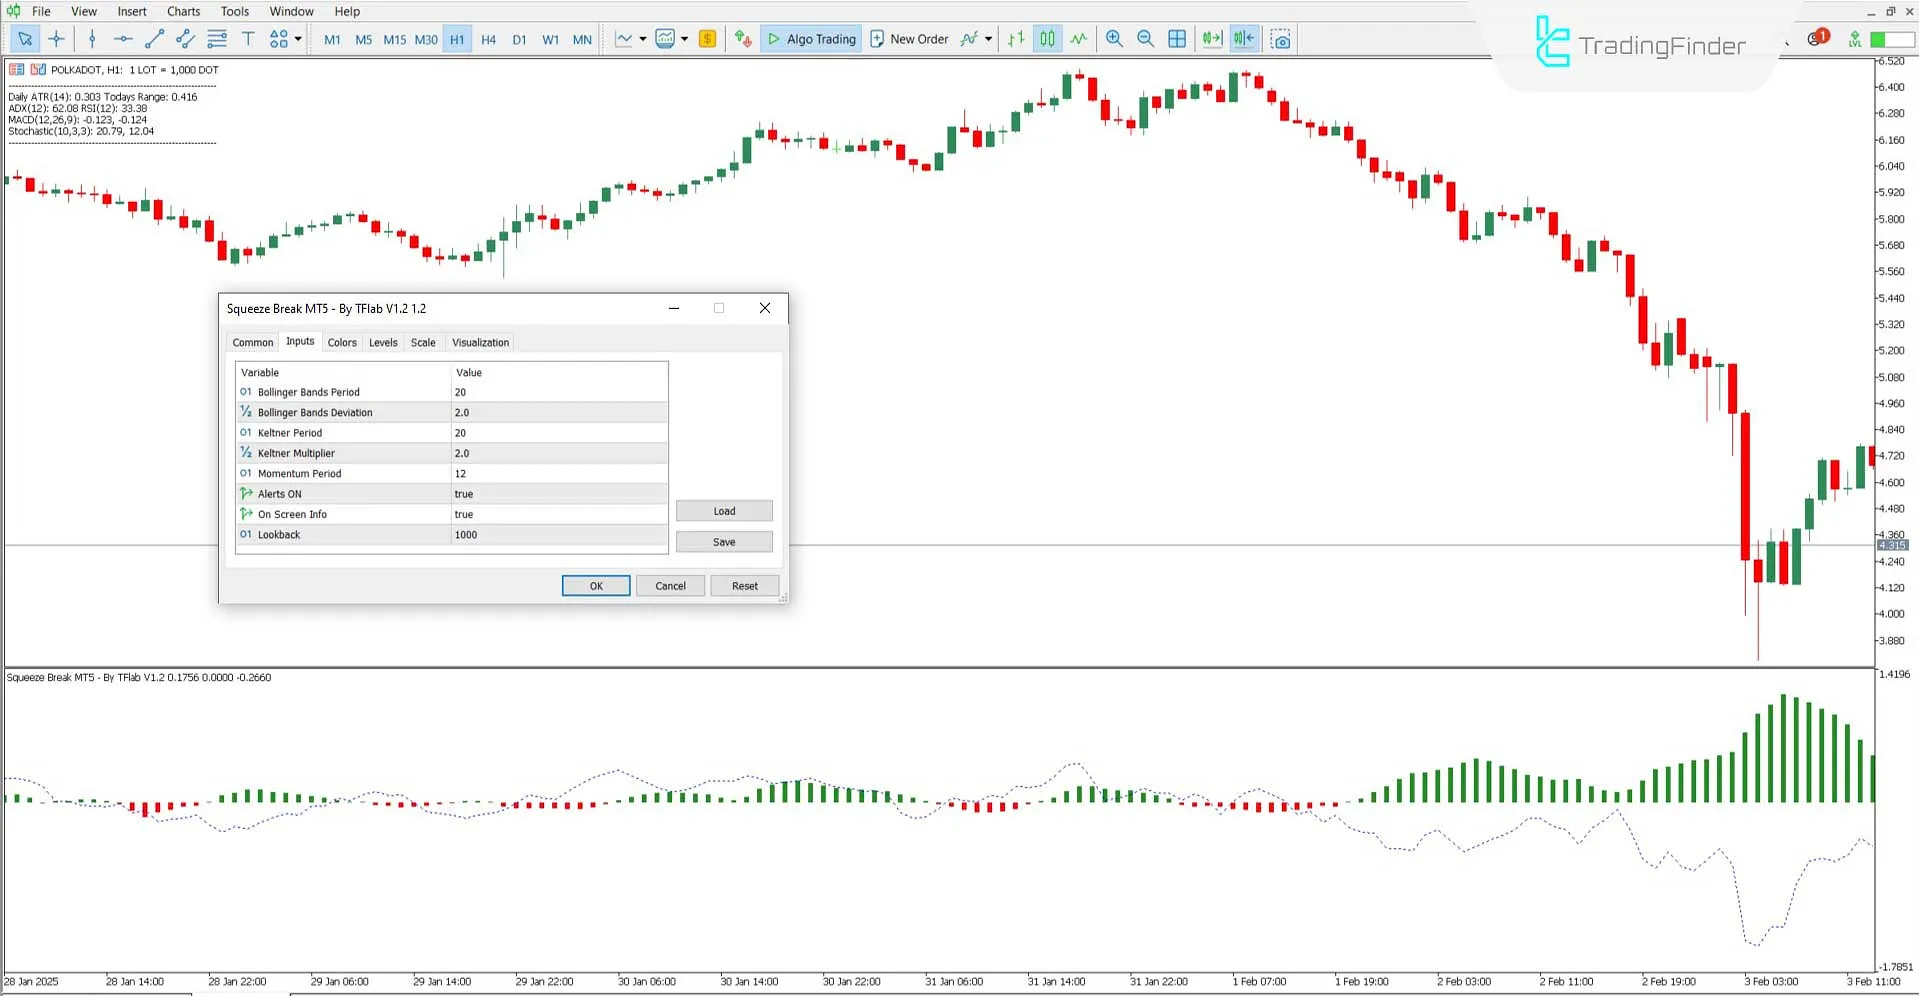
The following image shows the customizable settings of the Squeeze Break Indicator:

- Bollinger Bands Period: Defines the calculation period for Bollinger Bands.
- Bollinger Bands Deviation: Adjusts the distance of Bollinger Bands from the moving average.
- Keltner Period: Determines the period count for Keltner Channel calculations
- Keltner Multiplier: Sets the Keltner Channel width
- Momentum Period: Number of candles used for momentum calculation
- Alerts on: Enables notifications for breakout signals
- On-Screen Info: Displays key trading data on the chart
- Lookback: Defines the number of candles for historical analysis
Conclusion
The Squeeze Break Indicator uses histograms to determine when price movements break out of compression phases.
As one of the key indicators for MT5, it analyzes the signal line's position relative to the zero line to generate trade entry points.
Squeeze Break MT5 PDF
Squeeze Break MT5 PDF
Click to download Squeeze Break MT5 PDFWhat is the Squeeze Break Indicator?
The Squeeze Break Oscillator is a technical analysis tool that utilizes color-coded histograms and an oscillating signal line to detect breakouts from price compression and trend reversals.
Is this indicator suitable for short-term trading?
Yes, the Squeeze Break Indicator applies to all timeframes, including 30-minute, 1-hour, and daily charts.


