![STL & ITL & LTL Indicator for MetaTrader 5 Download (ICT) - Free - [TFlab]](https://cdn.tradingfinder.com/image/154645/4-18-en-stl-itl-ltl-mt5-1.webp)
![STL & ITL & LTL Indicator for MetaTrader 5 Download (ICT) - Free - [TFlab] 0](https://cdn.tradingfinder.com/image/154645/4-18-en-stl-itl-ltl-mt5-1.webp)
![STL & ITL & LTL Indicator for MetaTrader 5 Download (ICT) - Free - [TFlab] 1](https://cdn.tradingfinder.com/image/154613/4-18-en-stl-itl-ltl-mt5-2.webp)
![STL & ITL & LTL Indicator for MetaTrader 5 Download (ICT) - Free - [TFlab] 2](https://cdn.tradingfinder.com/image/154612/4-18-en-stl-itl-ltl-mt5-3.webp)
![STL & ITL & LTL Indicator for MetaTrader 5 Download (ICT) - Free - [TFlab] 3](https://cdn.tradingfinder.com/image/154629/4-18-en-stl-itl-ltl-mt5-4.webp)
The STL, ITL, and LTL Indicator in MetaTrader 5 indicators is designed to identify Short-Term Lows (STL), Intermediate-Term Lows (ITL), and Long-Term Lows (LTL). Detecting and visualizing all these lows is not always easy for traders.
With this indicator, key lows that impact trend analysis are clearly displayed, allowing traders to gain a comprehensive view of price movements.
Indicator Table
Indicator Categories: | Currency Strength MT5 Indicators Liquidity Indicators MT5 Indicators ICT MT5 Indicators |
Platforms: | MetaTrader 5 Indicators |
Trading Skills: | Intermediate |
Indicator Types: | Reversal MT5 Indicators |
Timeframe: | Multi-Timeframe MT5 Indicators |
Trading Style: | Intraday MT5 Indicators |
Trading Instruments: | Forex MT5 Indicators Crypto MT5 Indicators Stock MT5 Indicators Forward MT5 Indicators Share Stock MT5 Indicators |
Overview of the Indicator
This indicator considers three consecutive candles and the middle candle with the lowest low is identified as the Short-Term Low (STL). The Intermediate-Term Lows (ITL) are also displayed after significant price reactions in higher time frames.
Traders can identify these areas to gain insight into price trends and execute their trades with reduced risk.
Indicator in an Uptrend
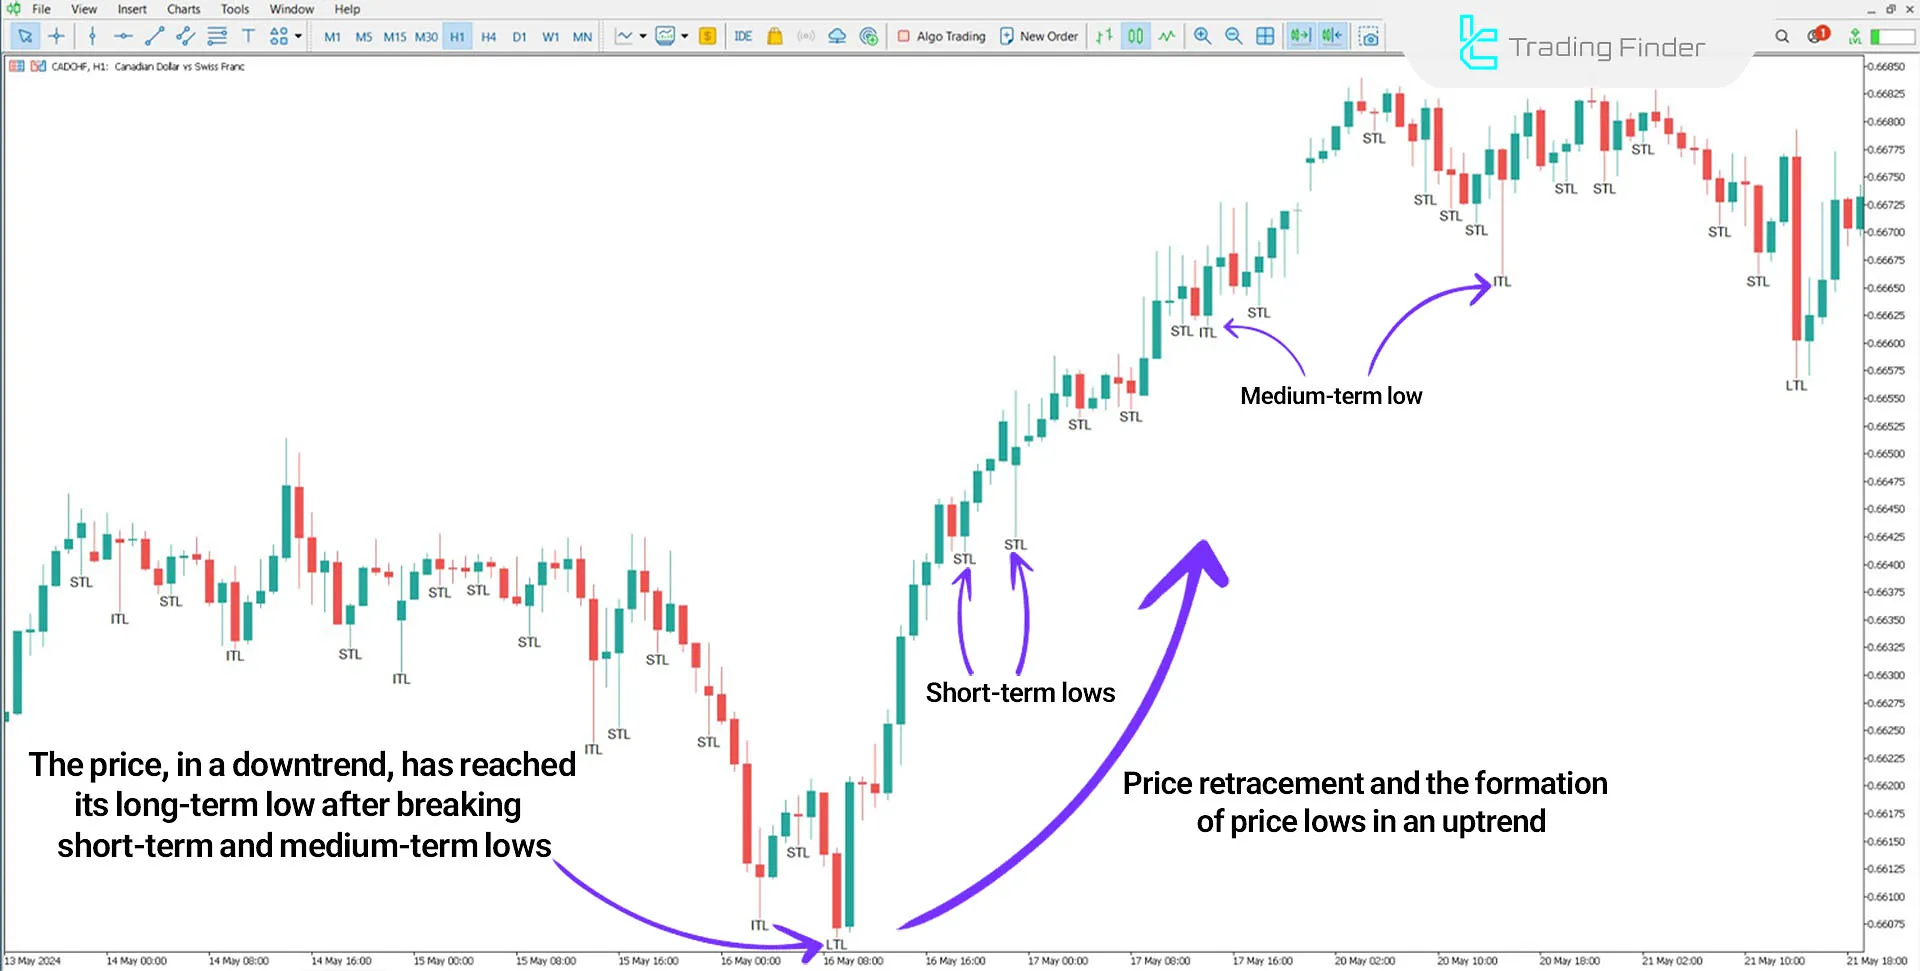
The chart below represents the CAD/CHF currency pair in a 1-hour time frame.
After breaking Short-Term Lows (STL) and Intermediate-Term Lows (ITL), the price in a downtrend reached its Long-Term Low (LTL) and then reversed upwards.
Traders can place stop-loss orders below the Long-Term Low (LTL) to enter buy trades.

Indicator in a Downtrend
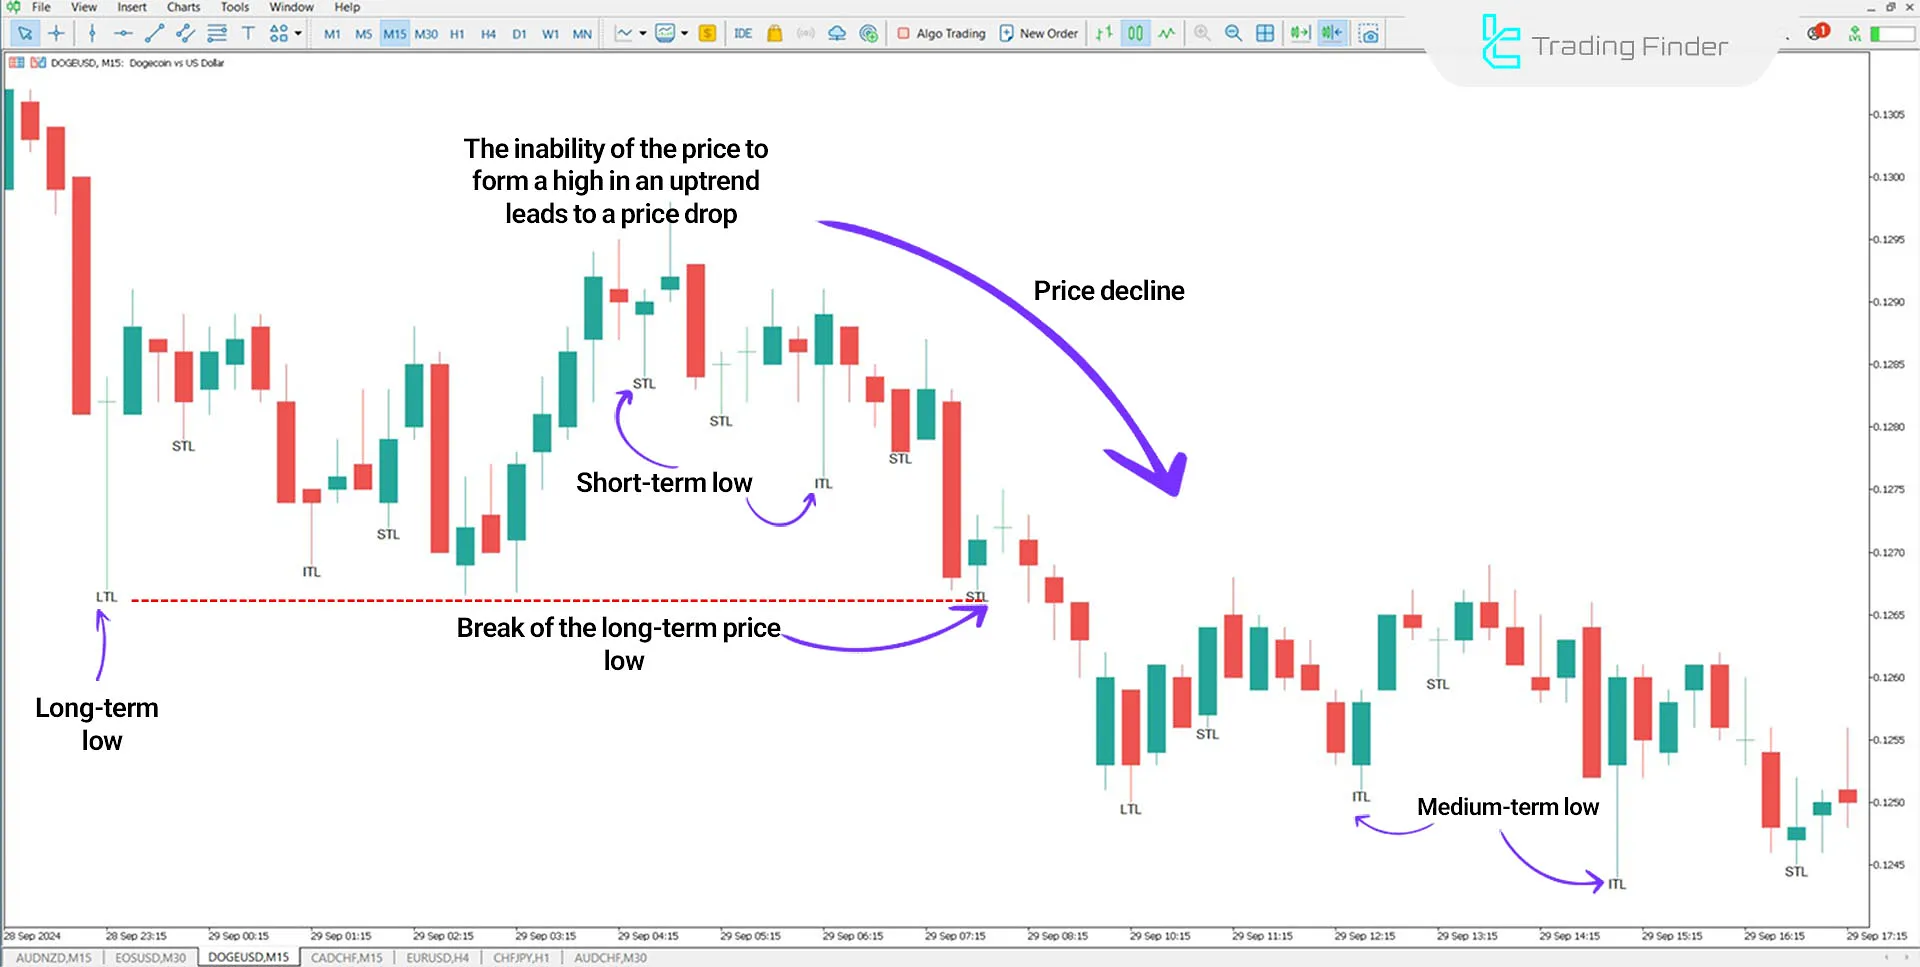
In the DOGE/USD currency pair chart with a 15-minute time frame, after breaking price lows and reaching the Long-Term Low, the price experienced weak growth and failed to form higher highs.
Consequently, breaking the Long-Term Low extended the downtrend.
Traders can use this indicator to enter SHORT trades and validate their trading strategies.

Indicator Settings

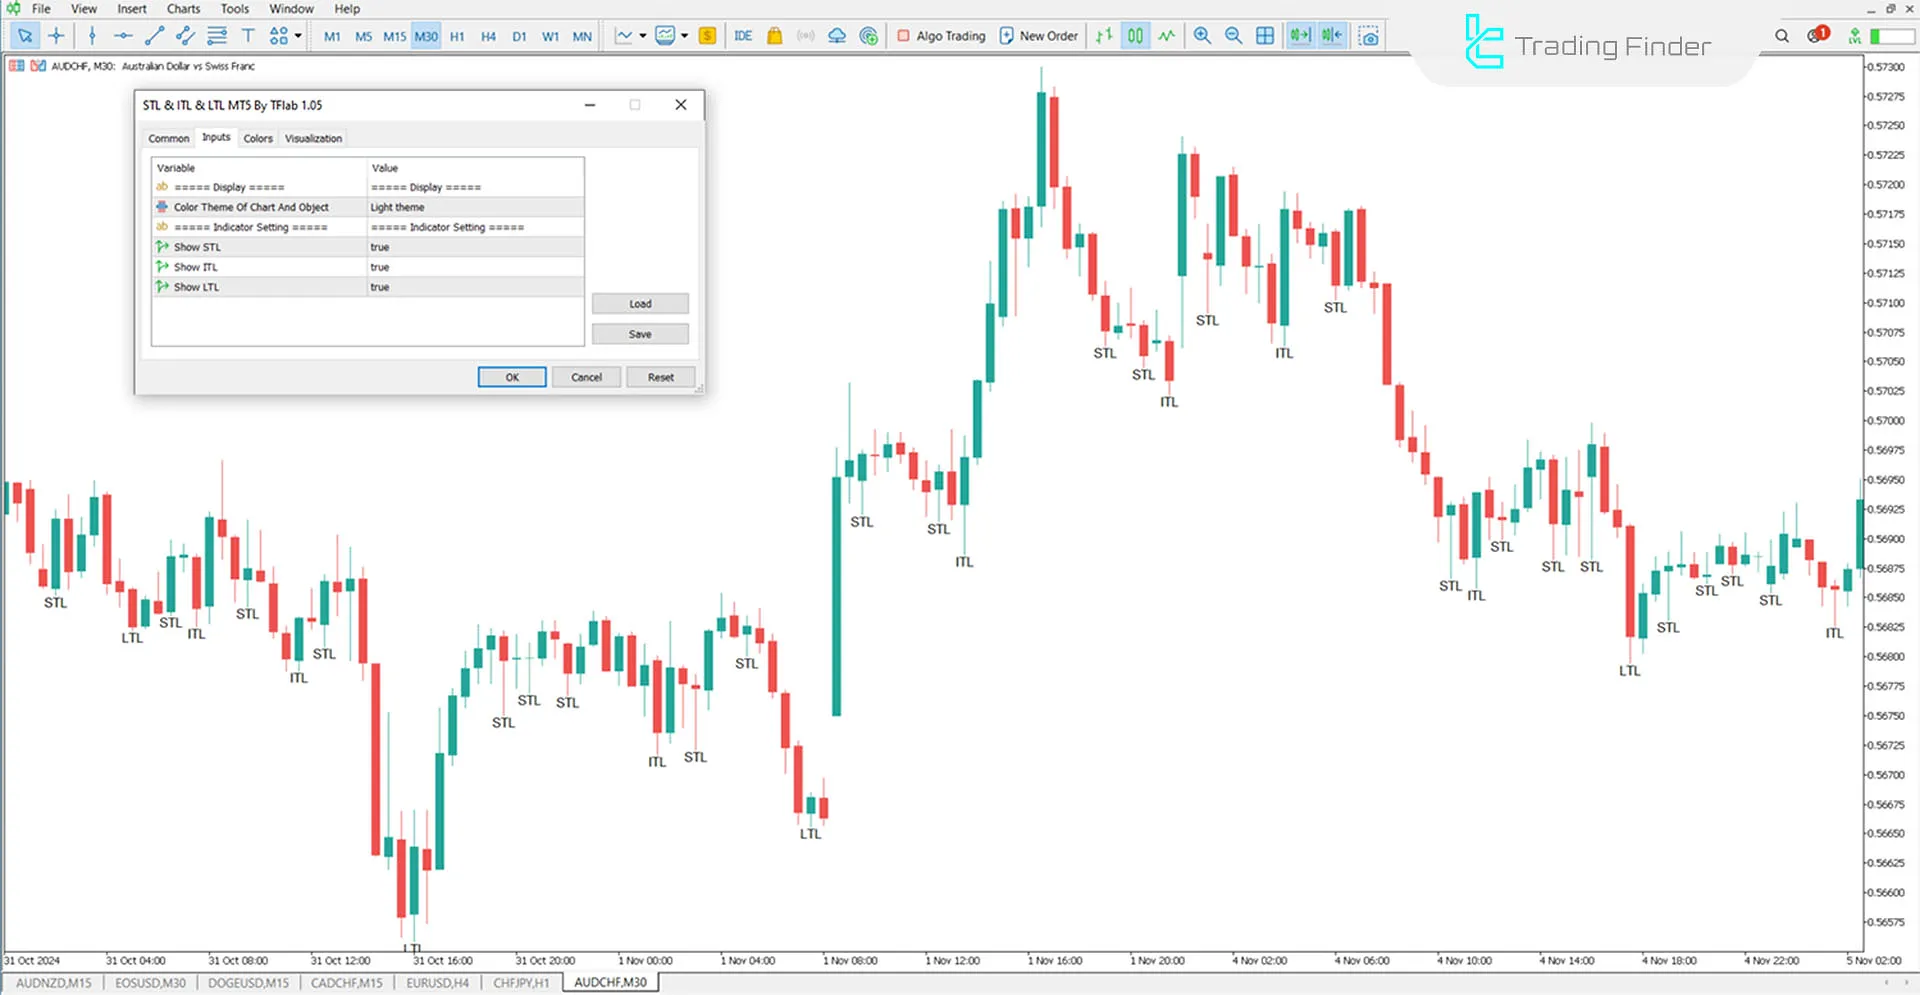
- Color Theme of Chart and Object: Background color of the chart;
- Show STL: Displays short-term lows;
- Show ITL: Displays mid-term lows;
- Show LTL: Displays long-term lows.
Conclusion
The STL, ITL, and LTL Indicator is designed to identify key levels based on market structure analysis within the ICT trading style.
STL is identified as the Short-Term Low, ITL as the Intermediate-Term Low, and LTL as the Long-Term Low.
These indicators assist traders in identifying trend reversal points and refining their trading strategies.
STL ITL LTL ICT MT5 PDF
STL ITL LTL ICT MT5 PDF
Click to download STL ITL LTL ICT MT5 PDFHow does this indicator help with trend analysis?
This indicator helps traders recognize reversal points and support/resistance levels by identifying key levels like lows.
What types of strategies can be used with this indicator?
Traders can use this indicator to confirm trends and enter buy or sell trades with lower risk.


