![Stochastic Divergence Indicator for MetaTrader 5 Download - [TradingFinder]](https://cdn.tradingfinder.com/image/325855/2-45-en-stochastic-divergence-mt5-1.webp)
![Stochastic Divergence Indicator for MetaTrader 5 Download - [TradingFinder] 0](https://cdn.tradingfinder.com/image/325855/2-45-en-stochastic-divergence-mt5-1.webp)
![Stochastic Divergence Indicator for MetaTrader 5 Download - [TradingFinder] 1](https://cdn.tradingfinder.com/image/325856/2-45-en-stochastic-divergence-mt5-2-png.webp)
![Stochastic Divergence Indicator for MetaTrader 5 Download - [TradingFinder] 2](https://cdn.tradingfinder.com/image/325854/2-45-en-stochastic-divergence-mt5-3.webp)
![Stochastic Divergence Indicator for MetaTrader 5 Download - [TradingFinder] 3](https://cdn.tradingfinder.com/image/325857/2-45-en-stochastic-divergence-mt5-4.webp)
On June 22, 2025, in version 2, alert/notification functionality was added to this indicator
The Stochastic Divergence Indicator is a tool for detecting trend divergences between the price and the Stochastic Oscillator in Technical analysis.
This MetaTrader 5 indicator automatically identifies and marks divergence areas with blue and pink lines. It also signals entry and exit points by displaying the words Buy and Sell on the lines.
Stochastic Divergence Specifications Table
The table below shows the specifications of the Stochastic Divergence Indicator:
Indicator Categories: | Price Action MT5 Indicators Oscillators MT5 Indicators Trading Assist MT5 Indicators |
Platforms: | MetaTrader 5 Indicators |
Trading Skills: | Intermediate |
Indicator Types: | Overbought & Oversold MT5 Indicators Reversal MT5 Indicators |
Timeframe: | Multi-Timeframe MT5 Indicators |
Trading Style: | Intraday MT5 Indicators |
Trading Instruments: | Forex MT5 Indicators Crypto MT5 Indicators Stock MT5 Indicators Indices MT5 Indicators Share Stock MT5 Indicators |
Stochastic Divergence Indicator Overview
Stochastic Divergence indicates a weakening of the current market trend and occurs when the price direction does not align with the direction of the Stochastic Oscillator.
This MetaTrader 5 oscillator evaluates the acceleration and strength of price movements and can identify potential trend reversals. It can also determine overbought and oversold areas.
Uptrend Conditions
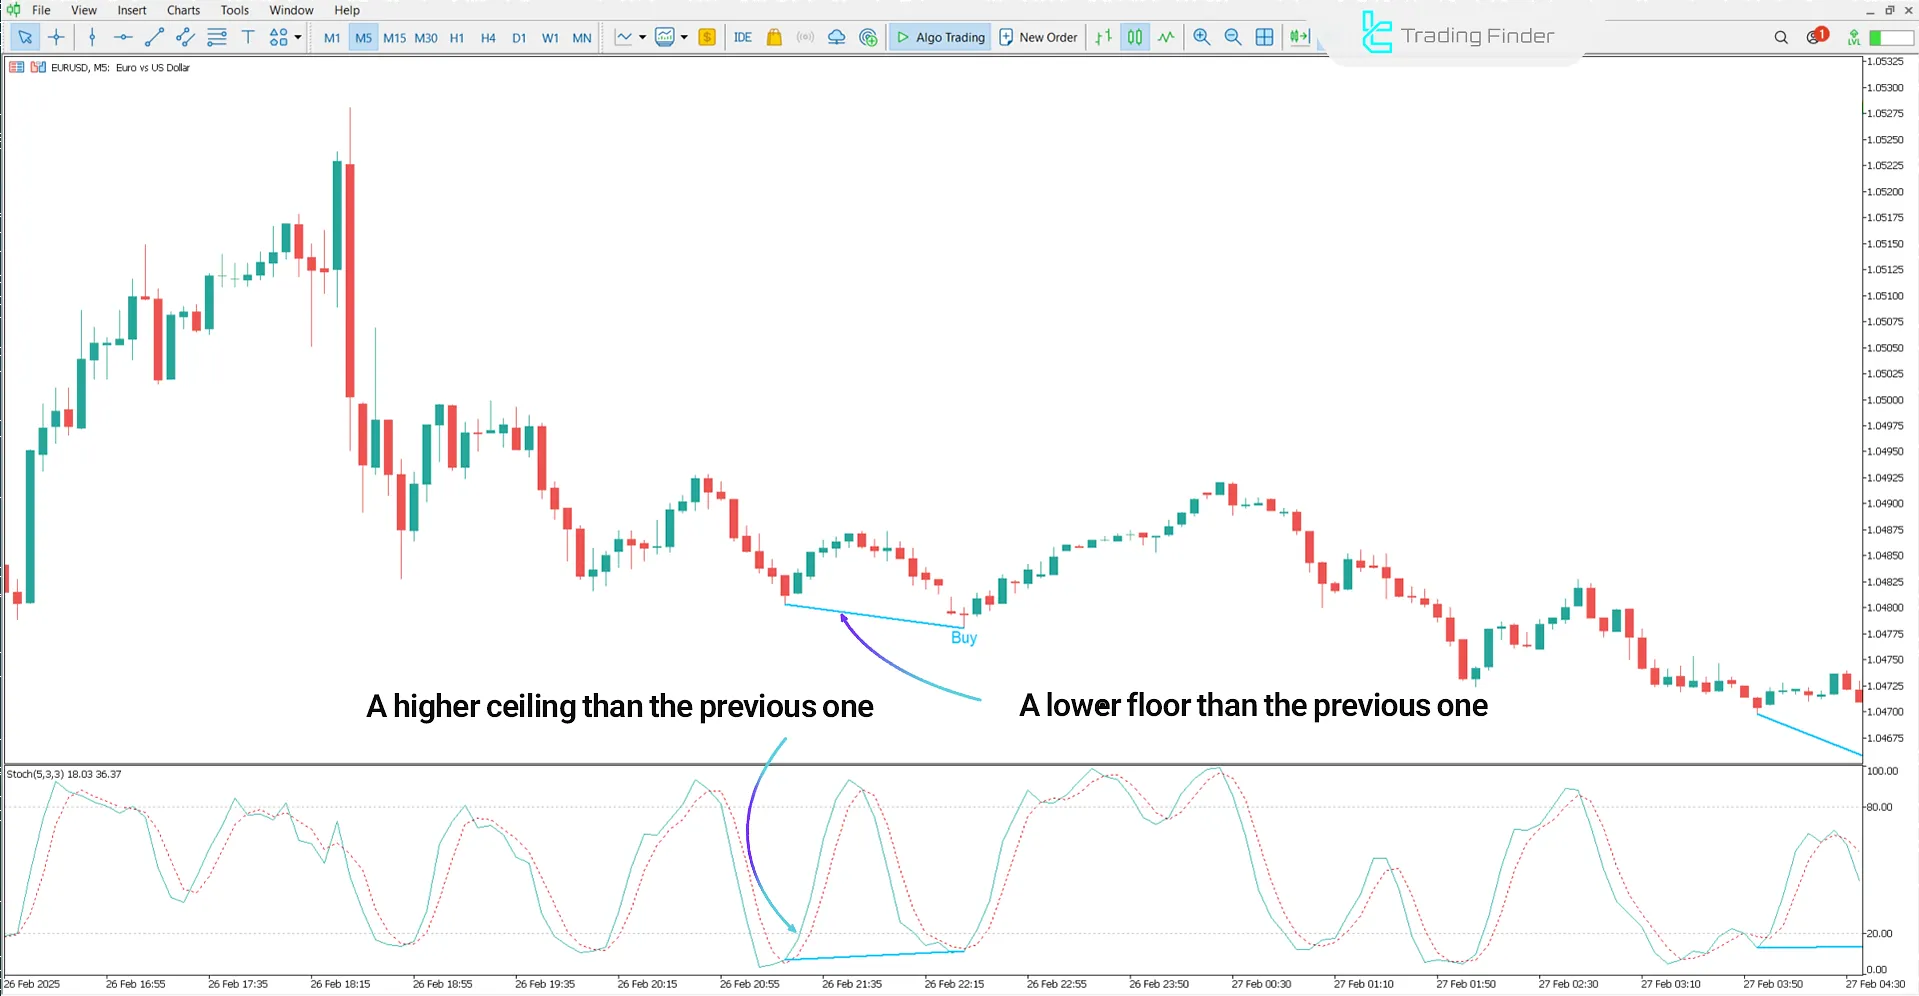
The following chart shows the EUR/USD currency pair in a 5-minute timeframe. When the price forms a new lower low, but the Stochastic Oscillator shows a higher low, a bullish (positive) divergence occurs.
This indicates weakness among sellers and the possibility of a trend reversal to the upside. As a result, a Buy signal is issued on the chart.

Downtrend Conditions
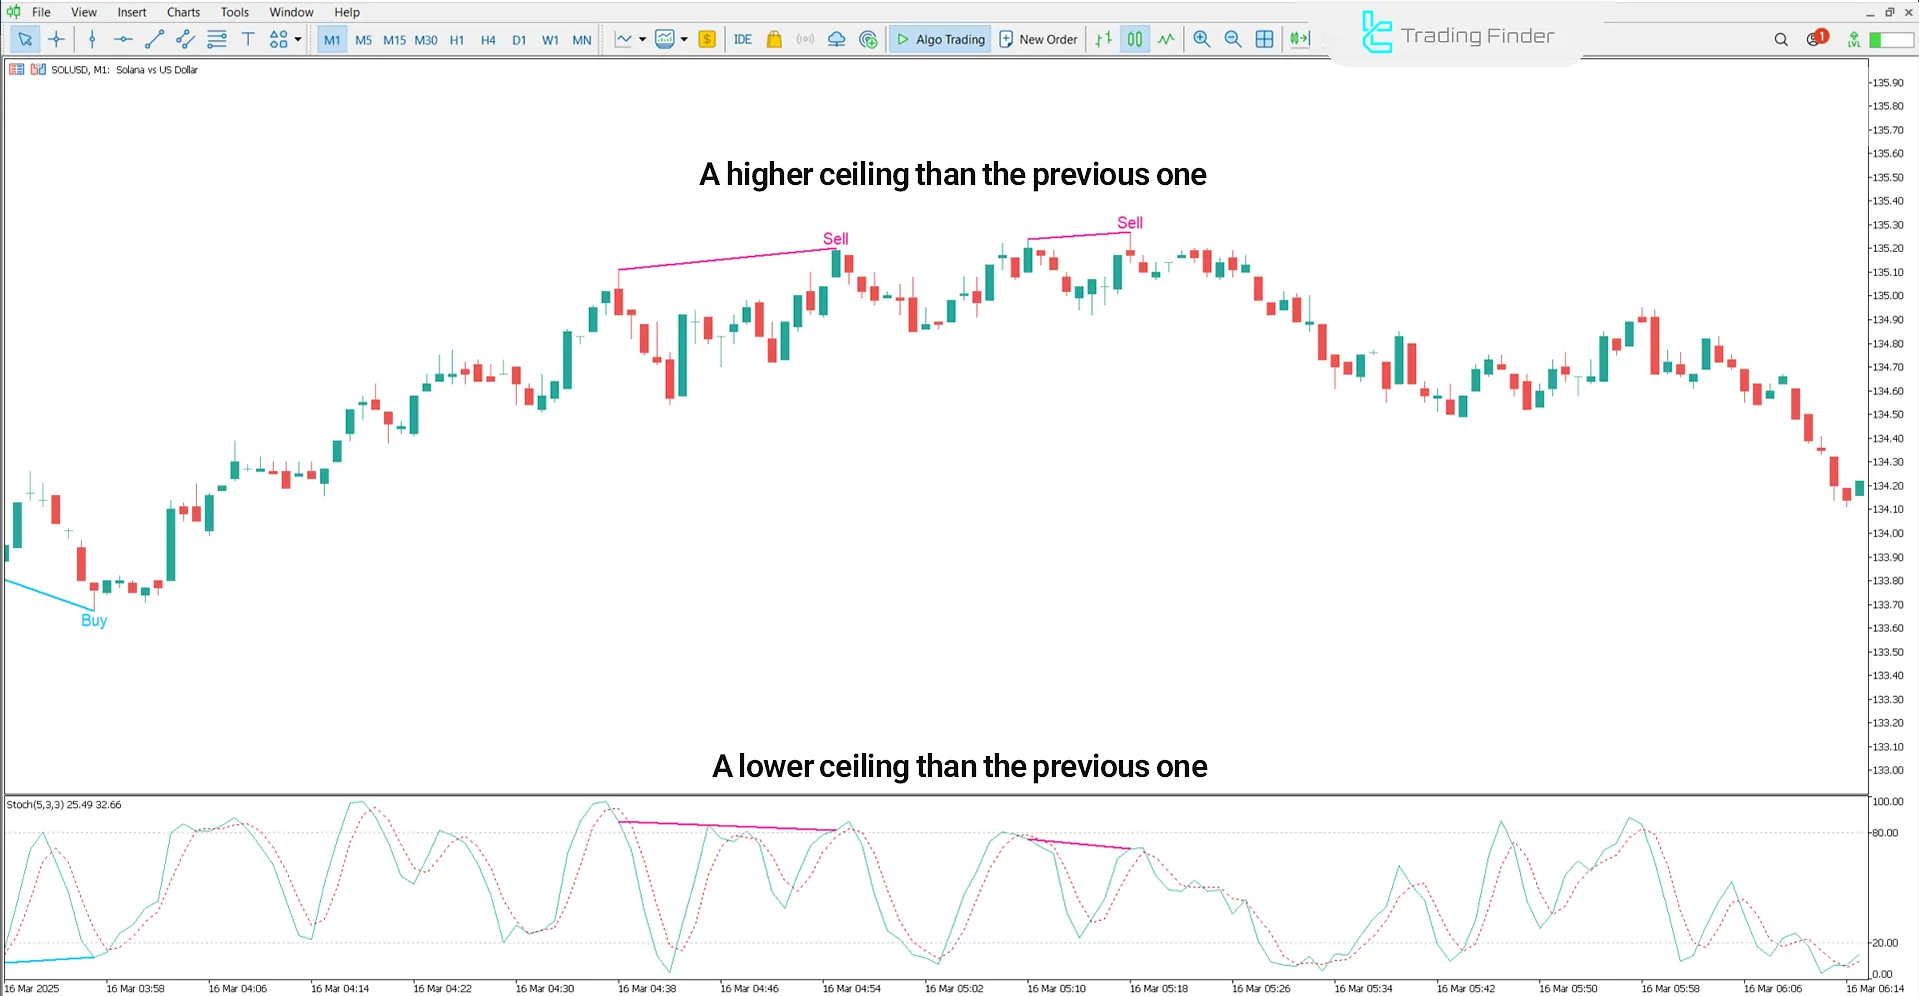
On the 1-minute timeframe of Solana (SOL/USD), if the price creates a new higher high but the oscillator shows a lower high, it signals a weakening of the bullish trend and a possible trend reversal toward the downside.
This Divergence between the price and oscillator indicates a decrease in buying power and presents an opportunity for Sell trades.

Indicator Settings
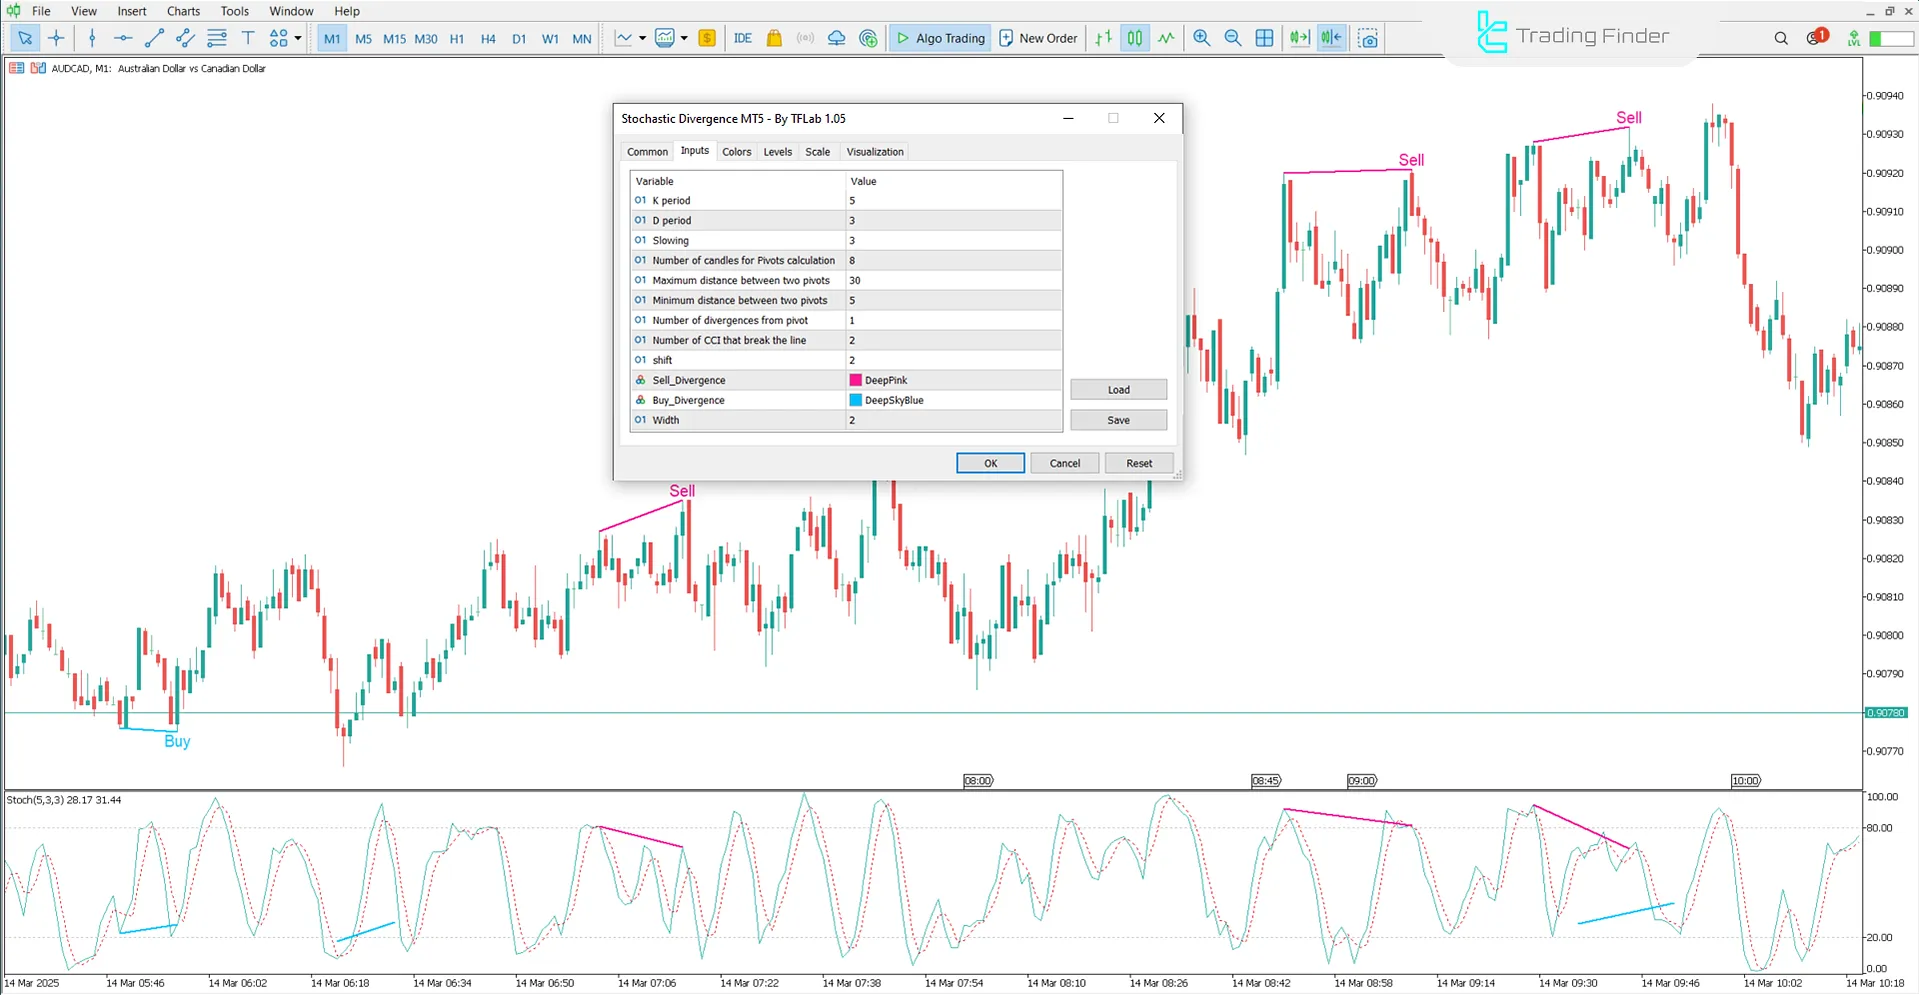
The image below shows the adjustable parameters of the Stochastic Divergence Indicator:

- K Period: K Length
- D Period: D Length
- Slowing: Deceleration
- Number of Candles for Pivots Calculation: Candle Count for Pivots
- Maximum Distance Between Two Pivots: Max Pivot Distance
- Minimum Distance Between Two Pivots: Min Pivot Distance
- Number of Divergences from Pivot: Divergence Count
- Number of Main Stochastic Breaks: Main Stochastic Breaks Count
- Shift: Shift or displacement
- Sell Divergence: Sell divergence color
- Buy Divergence: Buy divergence color
- Width: Line thicknessConclusion
Conclusion
The Stochastic Divergence Indicator automatically identifies divergences between price movements and the Stochastic Oscillator.
This MetaTrader 5 price actionIndicator tool provides entry signals through blue and pink lines.
Stochastic Divergence MT5 PDF
Stochastic Divergence MT5 PDF
Click to download Stochastic Divergence MT5 PDFCan this indicator be used in shorter timeframes?
The Stochastic Divergence Indicator is multi-timeframe and can be used across all timeframes.
Does the Stochastic Divergence Indicator issue buy and sell signals?
This trading tool specifies buy and sell signals on the price chart.


