![Stochastic Momentum indicator for MT5 Download - Free - [TradingFinder]](https://cdn.tradingfinder.com/image/128397/11-45-en-stochastic-momentum-oscillator-mt5-01.webp)
![Stochastic Momentum indicator for MT5 Download - Free - [TradingFinder] 0](https://cdn.tradingfinder.com/image/128397/11-45-en-stochastic-momentum-oscillator-mt5-01.webp)
![Stochastic Momentum indicator for MT5 Download - Free - [TradingFinder] 1](https://cdn.tradingfinder.com/image/128387/11-45-en-stochastic-momentum-oscillator-mt5-02.webp)
![Stochastic Momentum indicator for MT5 Download - Free - [TradingFinder] 2](https://cdn.tradingfinder.com/image/128399/11-45-en-stochastic-momentum-oscillator-mt5-03.webp)
![Stochastic Momentum indicator for MT5 Download - Free - [TradingFinder] 3](https://cdn.tradingfinder.com/image/128400/11-45-en-stochastic-momentum-oscillator-mt5-04.webp)
The Stochastic Momentum Oscillator is an enhanced version of the Stochastic Oscillator that improves trend recognition accuracy through moving averages and its advanced algorithm. This indicator is designed for the MetaTrader 5 platform and provides better trend identification and price reversal predictions.
This Metatrader5 Trading Assist indicator includes two oscillating lines: the signal line in orange and the oscillator line in blue. When the oscillator line (blue) crosses above the signal line (orange), it indicates an upward trend signal. A downward trend signal is issued when the oscillator line crosses below the signal.
Traders can also use divergences between two peaks or two troughs in the oscillator as a warning for trend reversal, aiding in entry and exit decisions.
Stochastic Momentum Oscillator Table
Indicator Categories: | Oscillators MT5 Indicators Signal & Forecast MT5 Indicators Currency Strength MT5 Indicators Trading Assist MT5 Indicators |
Platforms: | MetaTrader 5 Indicators |
Trading Skills: | Elementary |
Indicator Types: | Lagging MT5 Indicators Leading MT5 Indicators |
Timeframe: | Multi-Timeframe MT5 Indicators |
Trading Style: | Intraday MT5 Indicators Scalper MT5 Indicators Day Trading MT5 Indicators |
Trading Instruments: | Forex MT5 Indicators Crypto MT5 Indicators Indices MT5 Indicators |
Indicator at a Glance
The Stochastic Momentum Oscillator is an improved version of the Stochastic indicator that uses a moving average to display trends more accurately and reduce price noise. This indicator helps traders identify positive and negative divergences.
When the oscillator line crosses the signal line upward, it generates a buy signal, and when it crosses downward, it produces a sell signal.
Buy Signal in Oscillator

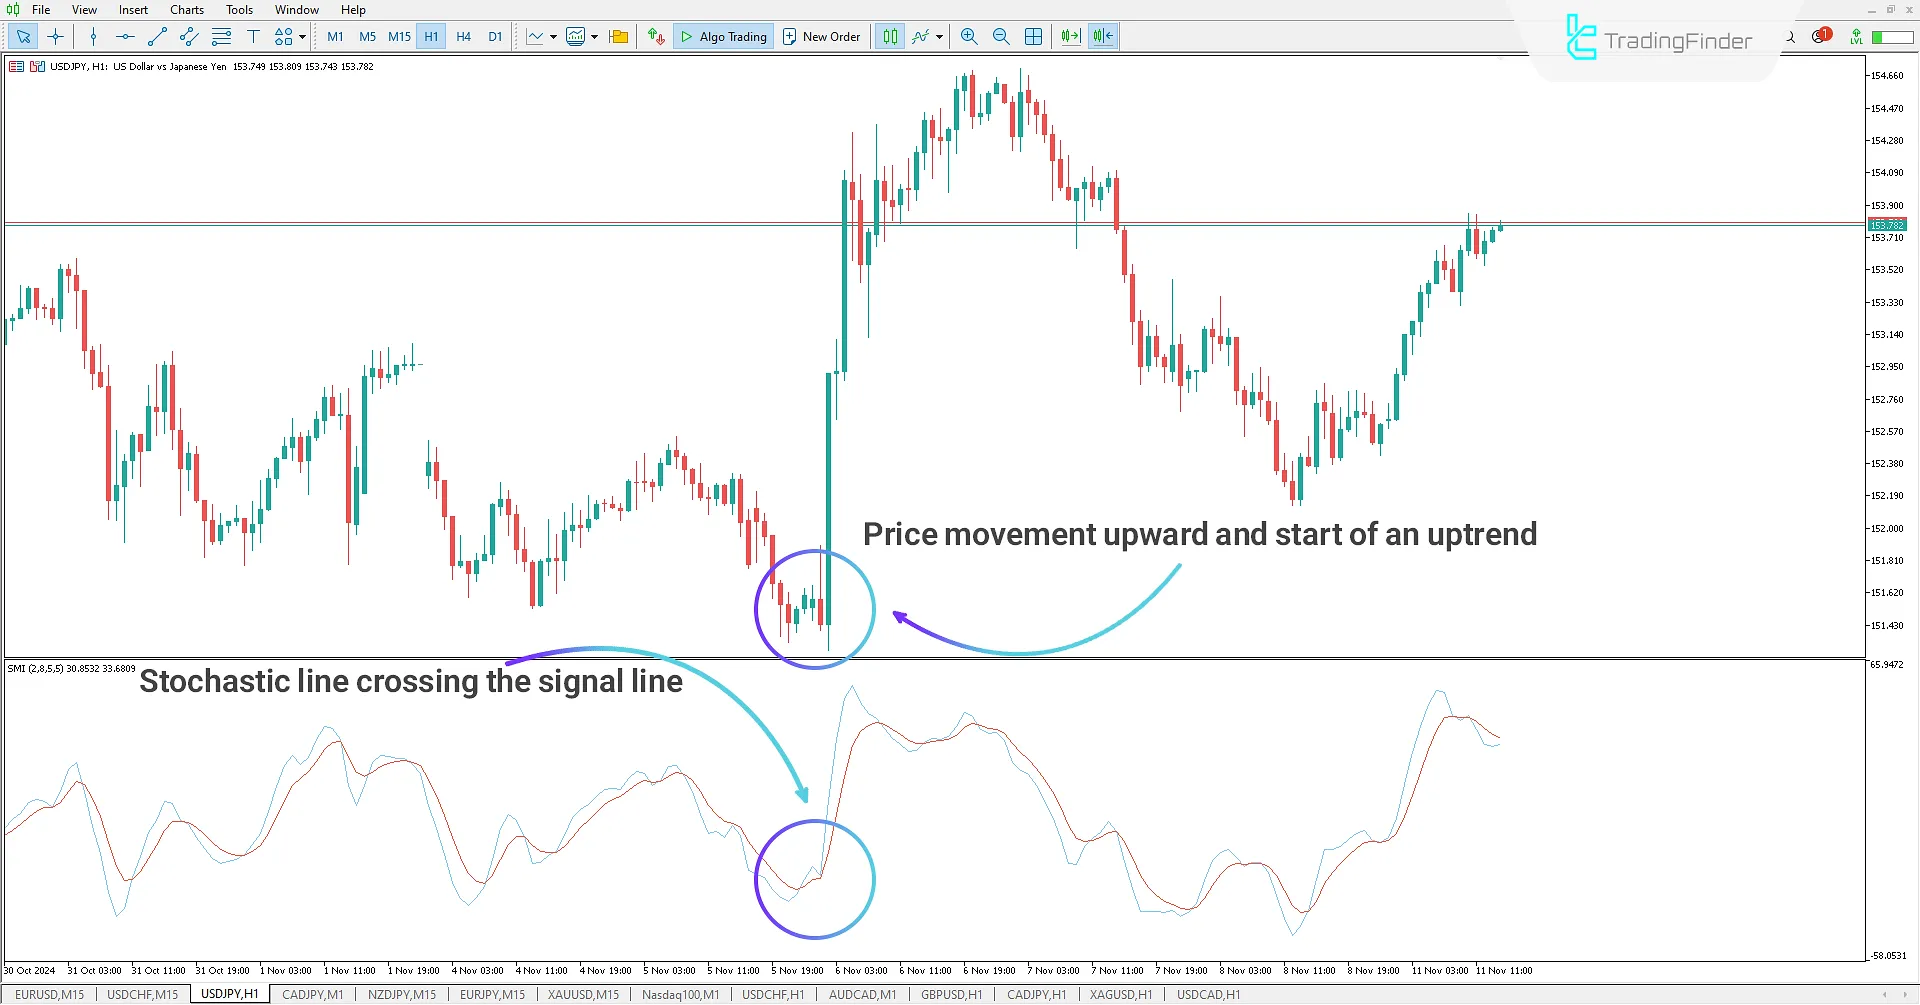
In the USD/JPY 1-hour chart, the Stochastic Momentum Oscillator signals the start of an uptrend. When the MetaTrader5 oscillator line crosses above the signal line, this is interpreted as an uptrend signal. In this Chart, after crossing the signal line, the price sharply moves upward, confirming the potential for a price increase in this time frame.
Sell Signal in Oscillator

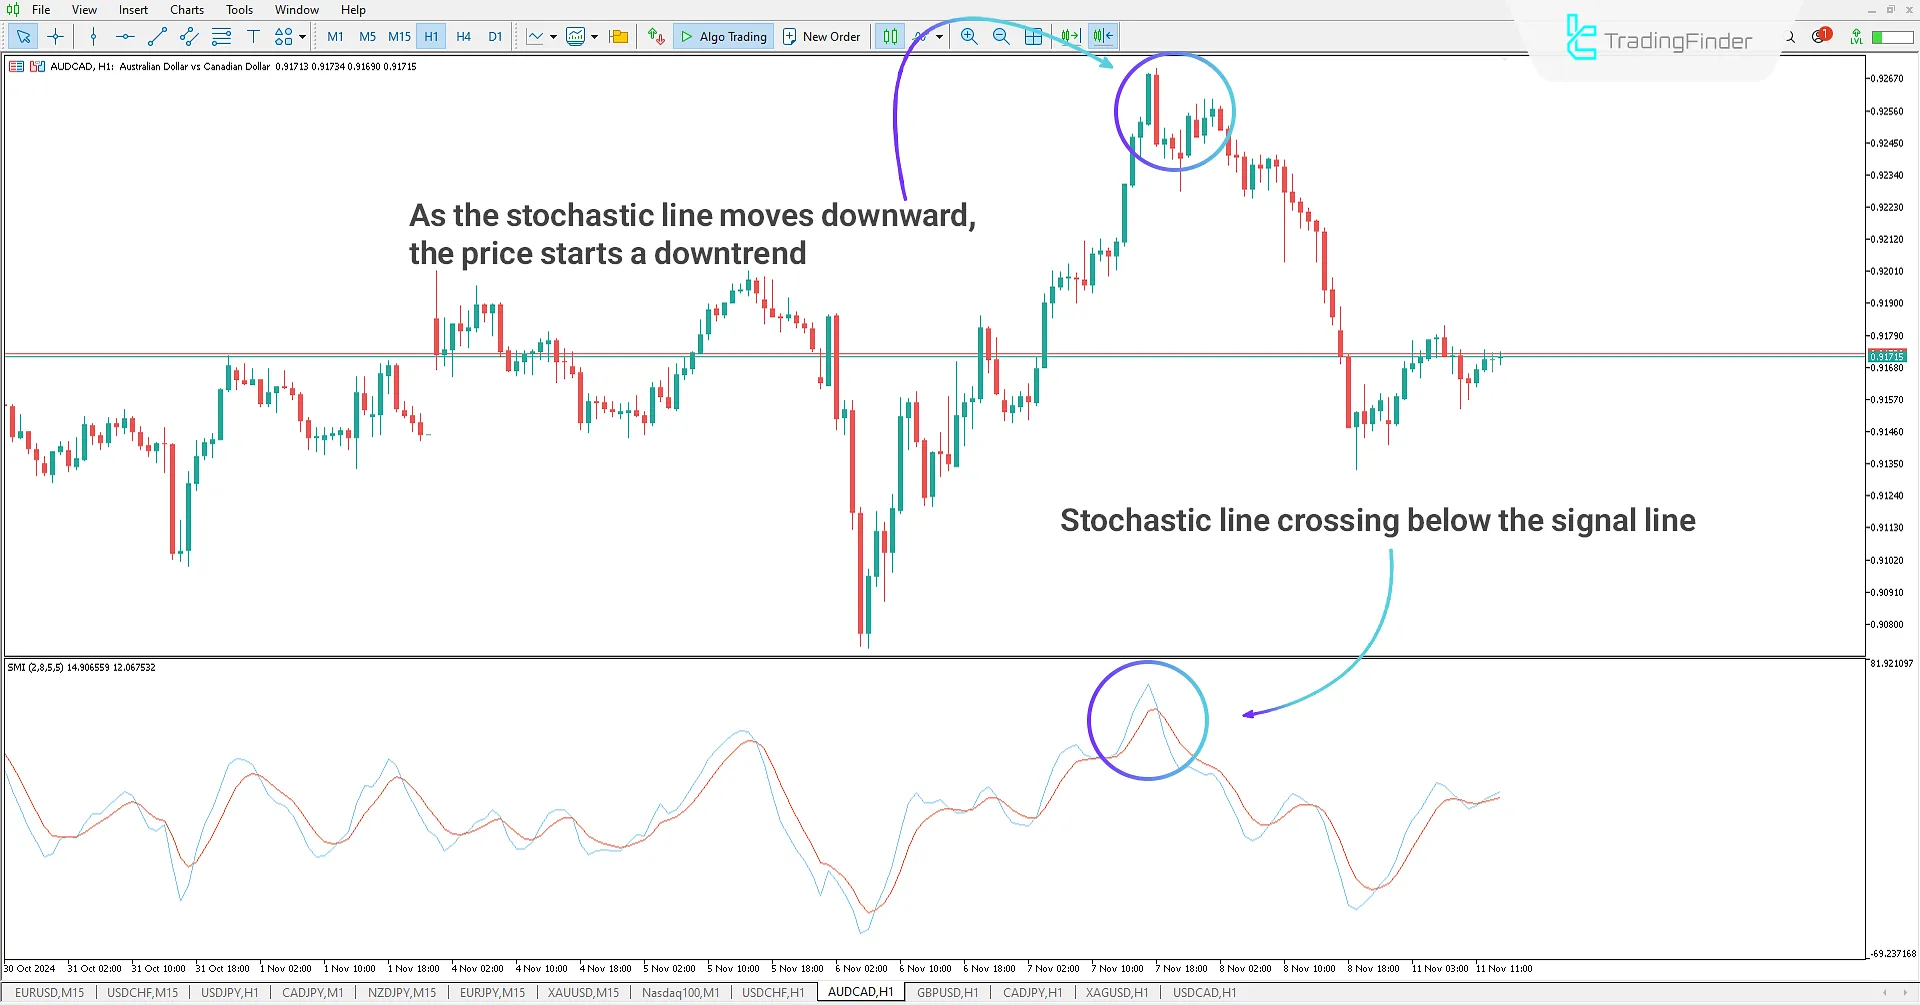
In the AUD/CAD 1-hour chart, the Stochastic Momentum Oscillator signals the beginning of a downtrend. When the oscillator line crosses below the signal line, this is interpreted as a downtrend signal. In this Chart, the price sharply declines after crossing the signal line, confirming the potential for a price decrease in this time frame.
Stochastic Momentum Oscillator Settings

Display Settings:
- Chart Theme: Select a custom theme for the indicator
Indicator Settings
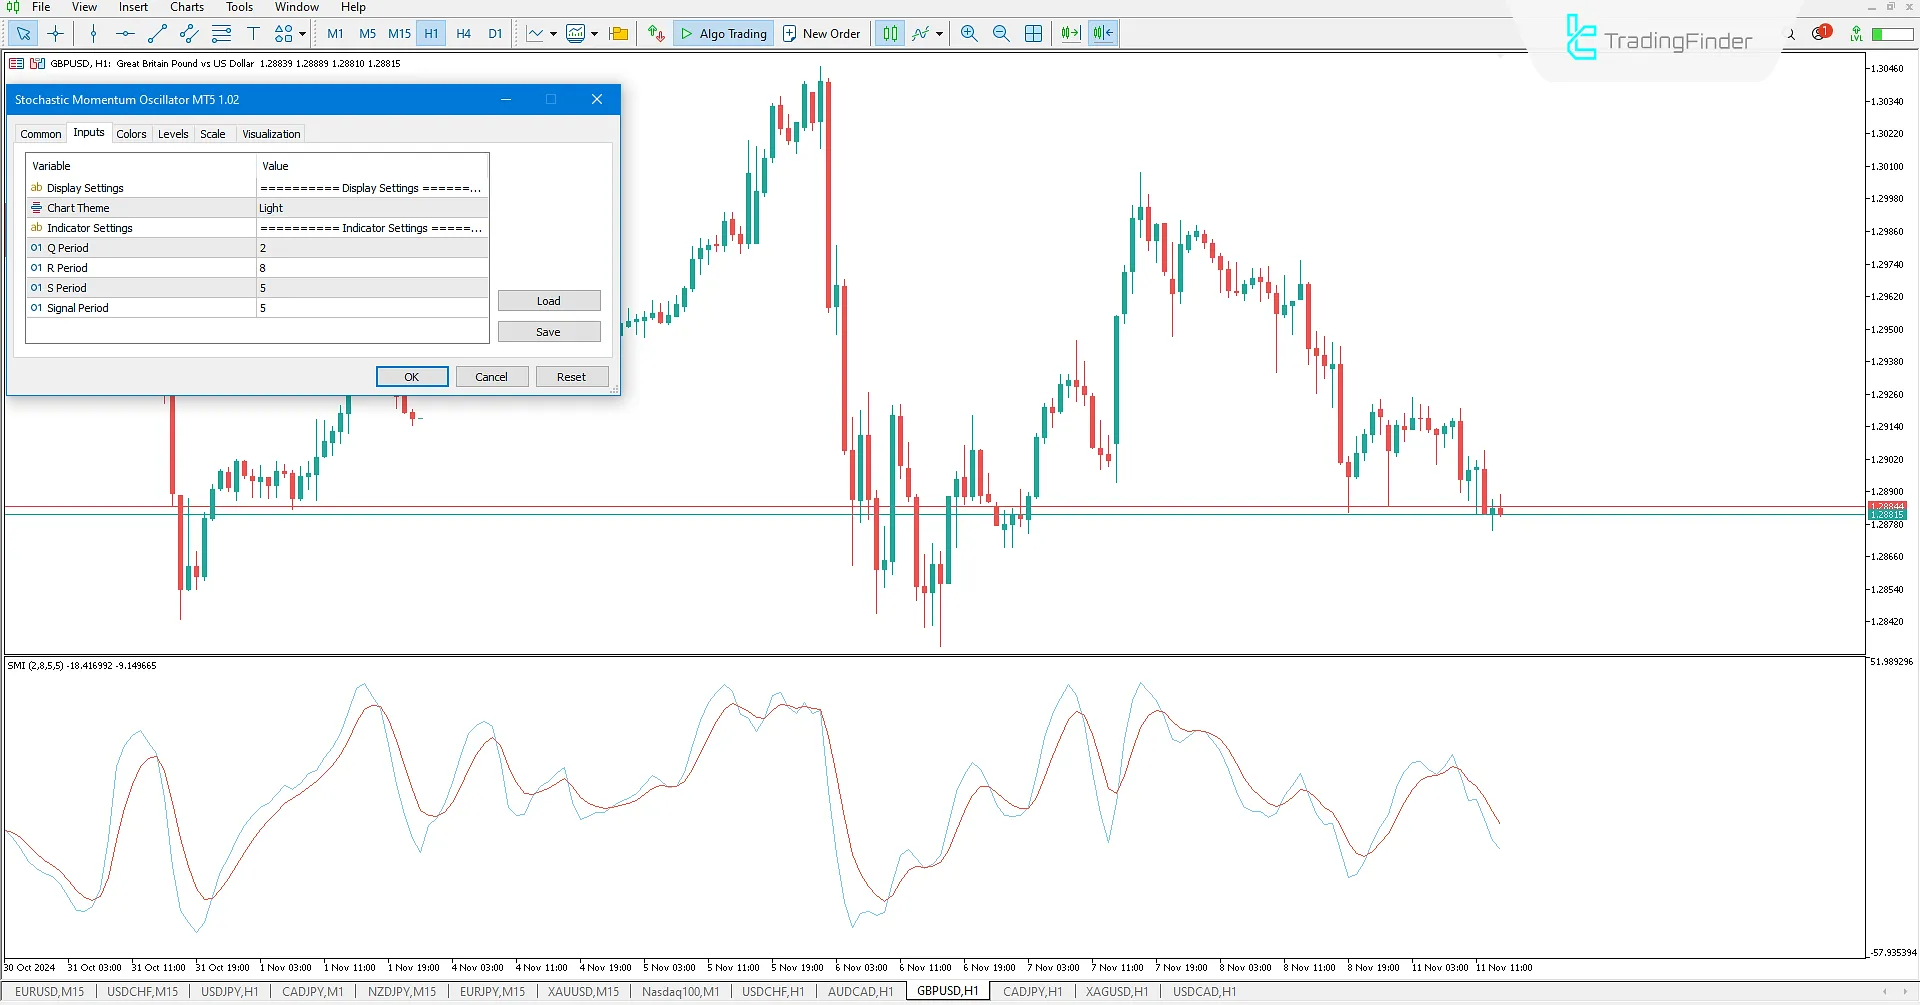
- Q Period: Oscillator line period setting;
- R Period: Moving average period 1 setting (affects calculation algorithm);
- S Period: Moving average period 2 setting (affects calculation algorithm);
- Signal Period: Signal line period setting.
Conclusion
The Stochastic Momentum Oscillator is a valuable and practical tool for trend detection and price reversal. With its unique algorithm as an improved version of the Stochastic Indicator, this indicator offers greater accuracy in detecting price trends.
Additionally, displaying divergences more clearly through two peaks and troughs assists traders in identifying trend directions and price reversal points. This trading tool allows traders to make trading decisions and capitalize on trading opportunities quickly.
Stochastic Momentum indicator MT5 PDF
Stochastic Momentum indicator MT5 PDF
Click to download Stochastic Momentum indicator MT5 PDFHow are the lines of this indicator displayed?
This indicator shows the signal line in orange and the oscillator line in blue. These lines help traders identify uptrends and downtrends.
What features does the Stochastic Momentum Oscillator have for detecting divergence?
Traders can use positive and negative divergences between two peaks or two troughs in the oscillator as a warning for potential trend reversal. This feature can help make entry or exit decisions in trades.


