


The Stochastic on Chart Indicator is a professional and advanced tool designed for MetaTrader 5.
By displaying the Stochastic directly on the chart, it enables Forex traders to identify overbought and oversold zones based on %K and %D lines.
Stochastic on Chart Indicator Table
Below, the information related to the Stochastic on Chart Indicator is provided.
Indicator Categories: | Oscillators MT5 Indicators Signal & Forecast MT5 Indicators Trading Assist MT5 Indicators |
Platforms: | MetaTrader 5 Indicators |
Trading Skills: | Intermediate |
Indicator Types: | Trend MT5 Indicators Overbought & Oversold MT5 Indicators Reversal MT5 Indicators |
Timeframe: | Multi-Timeframe MT5 Indicators |
Trading Style: | Intraday MT5 Indicators Scalper MT5 Indicators Day Trading MT5 Indicators |
Trading Instruments: | Forex MT5 Indicators Crypto MT5 Indicators Stock MT5 Indicators Indices MT5 Indicators |
Stochastic Indicator on Chart at a Glance
The Stochastic on Chart Indicator is an upgraded and advanced version of the Stochastic Oscillator, designed to be displayed directly on the chart.
Technical traders can combine it with their strategies to identify trading opportunities.
When the %K and %D oscillator lines enter overbought or oversold zones and then cross each other while exiting those areas, buy and sell signals are generated for market entry.
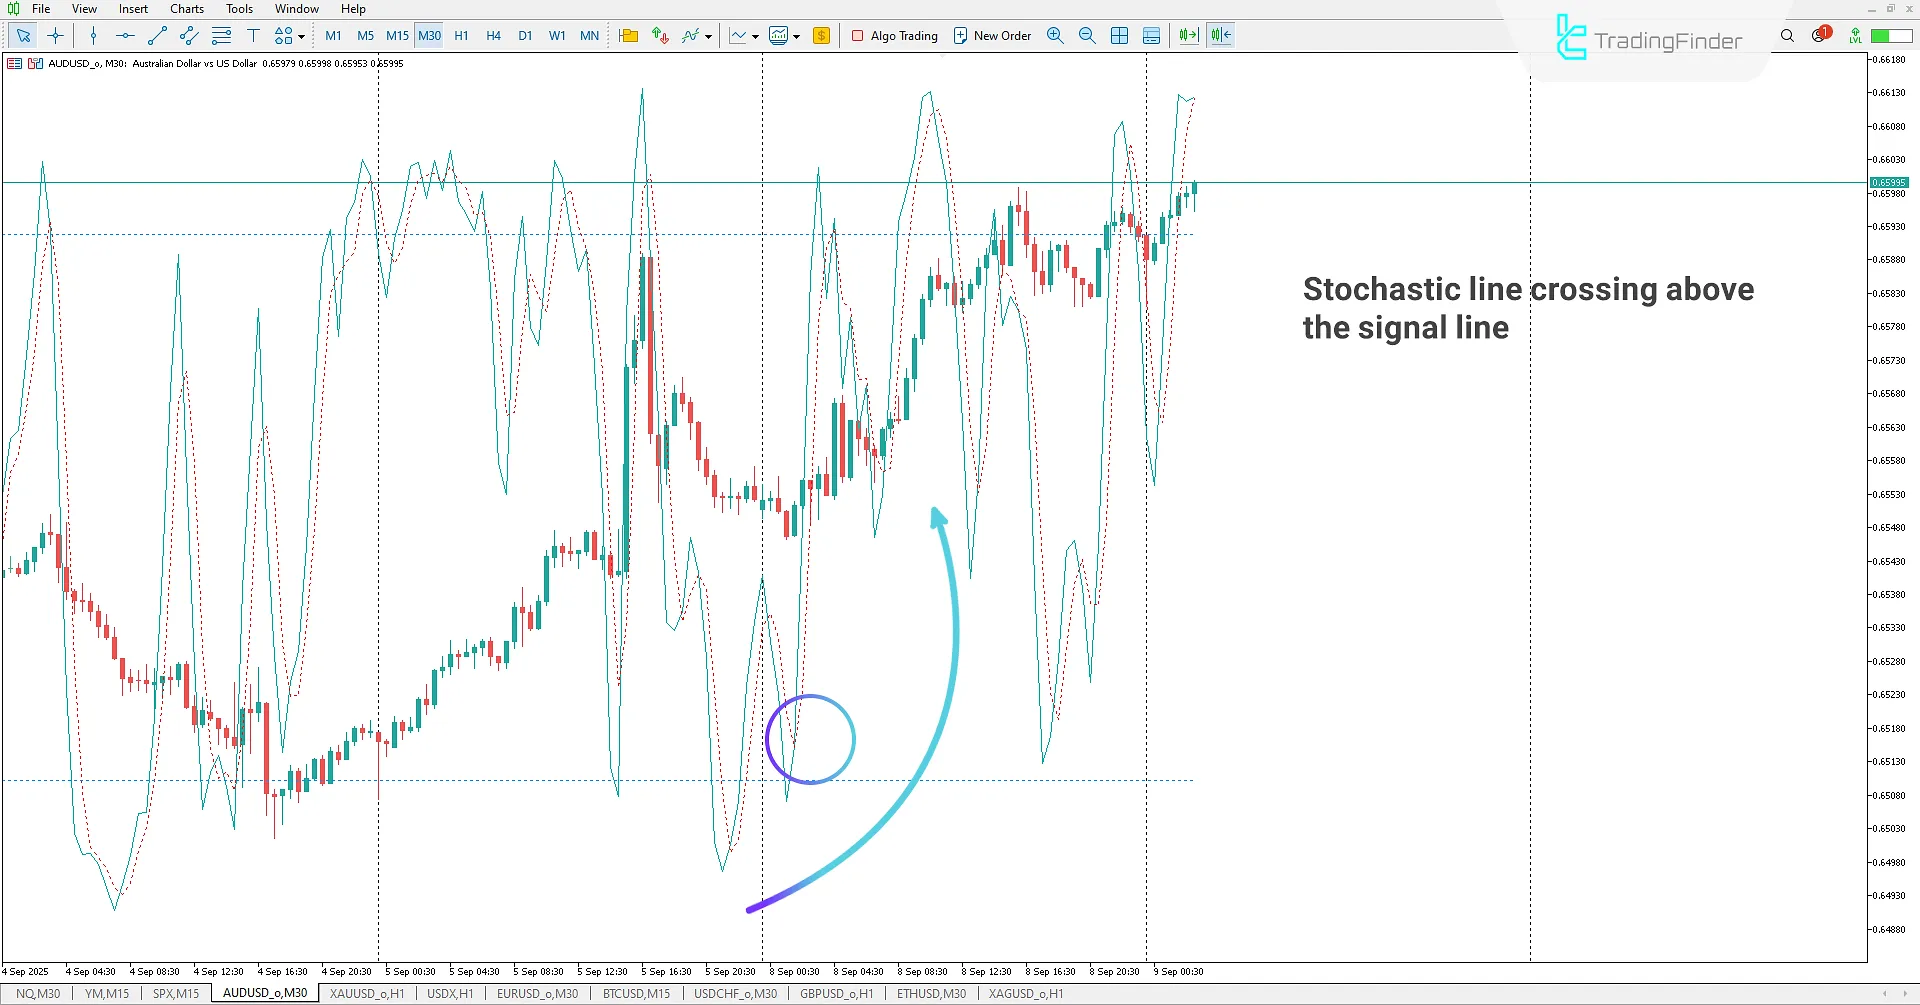
Uptrend in the Stochastic Indicator on Chart
On the 30-minute AUD/USD chart, traders can use the Stochastic on Chart Indicator to identify oversold zones.
In this example, the %K and %D lines enter the oversold zone, and upon exiting with a crossover, an uptrend is indicated, signaling a potential buy entry.
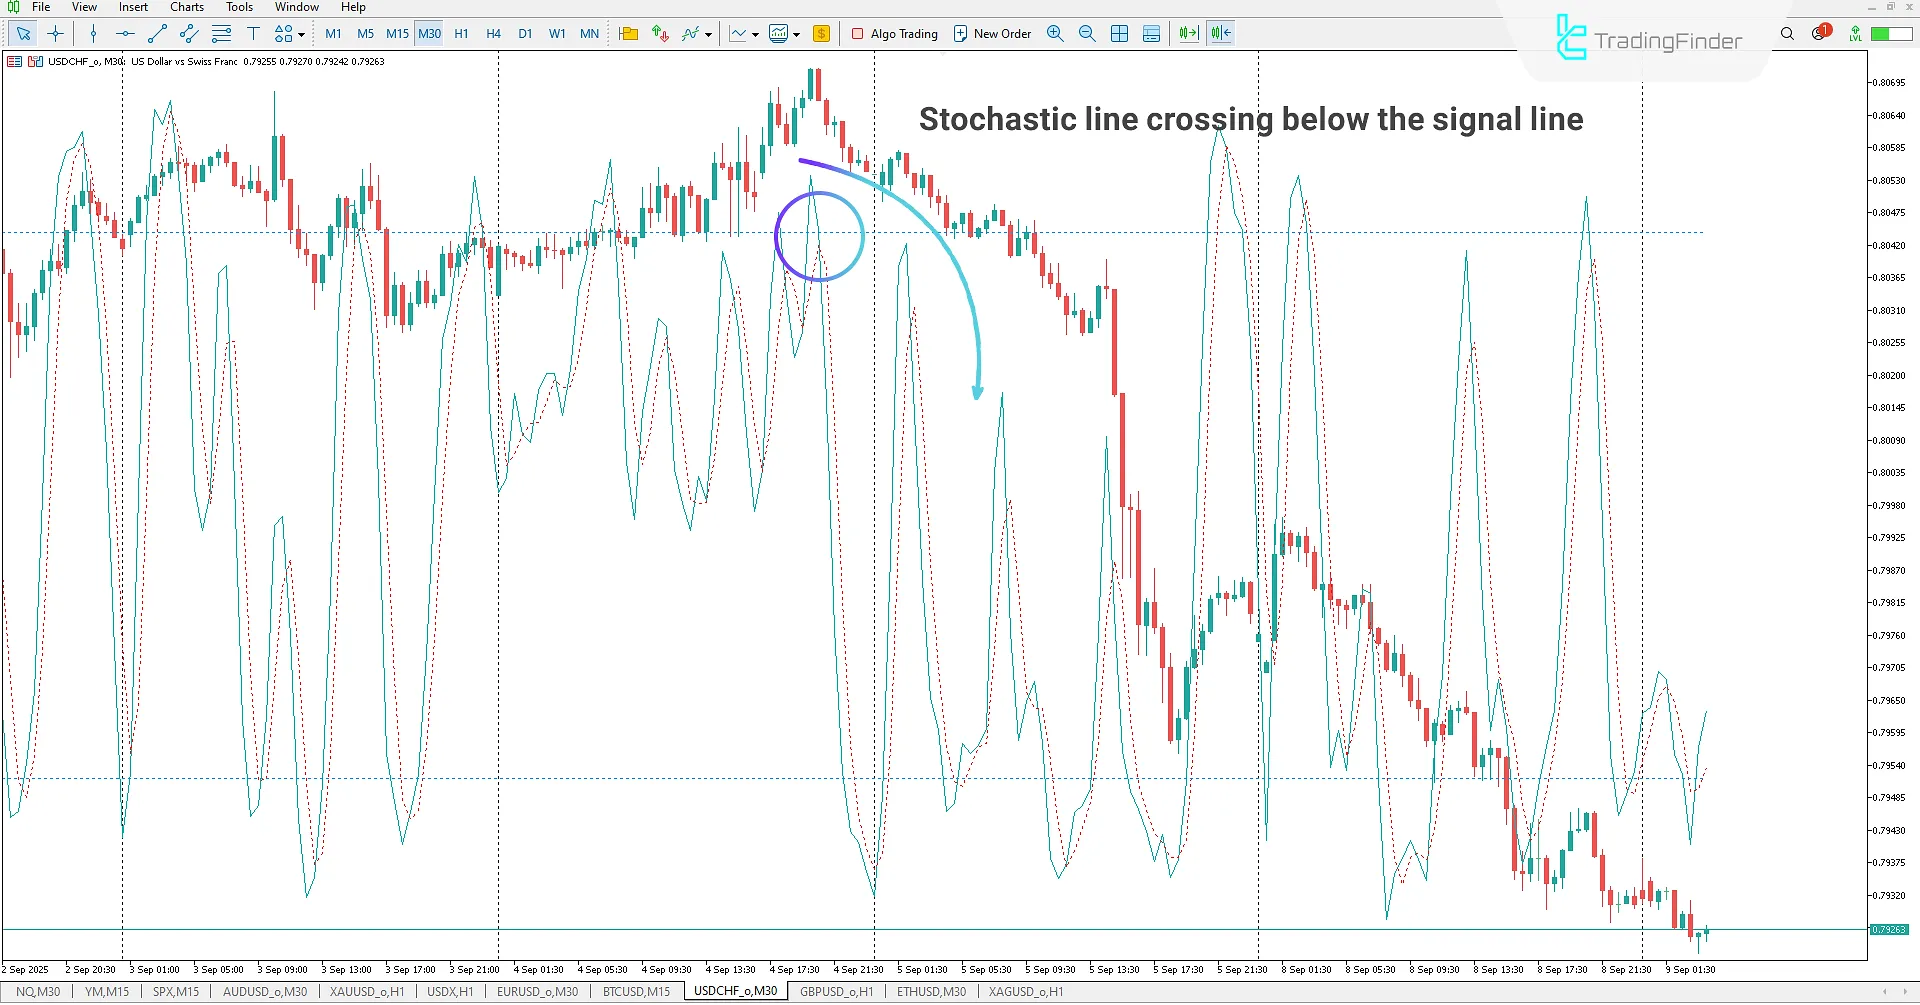
Downtrend in the Stochastic Indicator on Chart
On the 30-minute USD/CHF chart, the Stochastic and signal lines enter the overbought zone. Upon exiting this zone and crossing each other, a bearish signal is generated.
Traders can use the Stochastic on Chart Indicator to confirm this setup and enter sell positions.
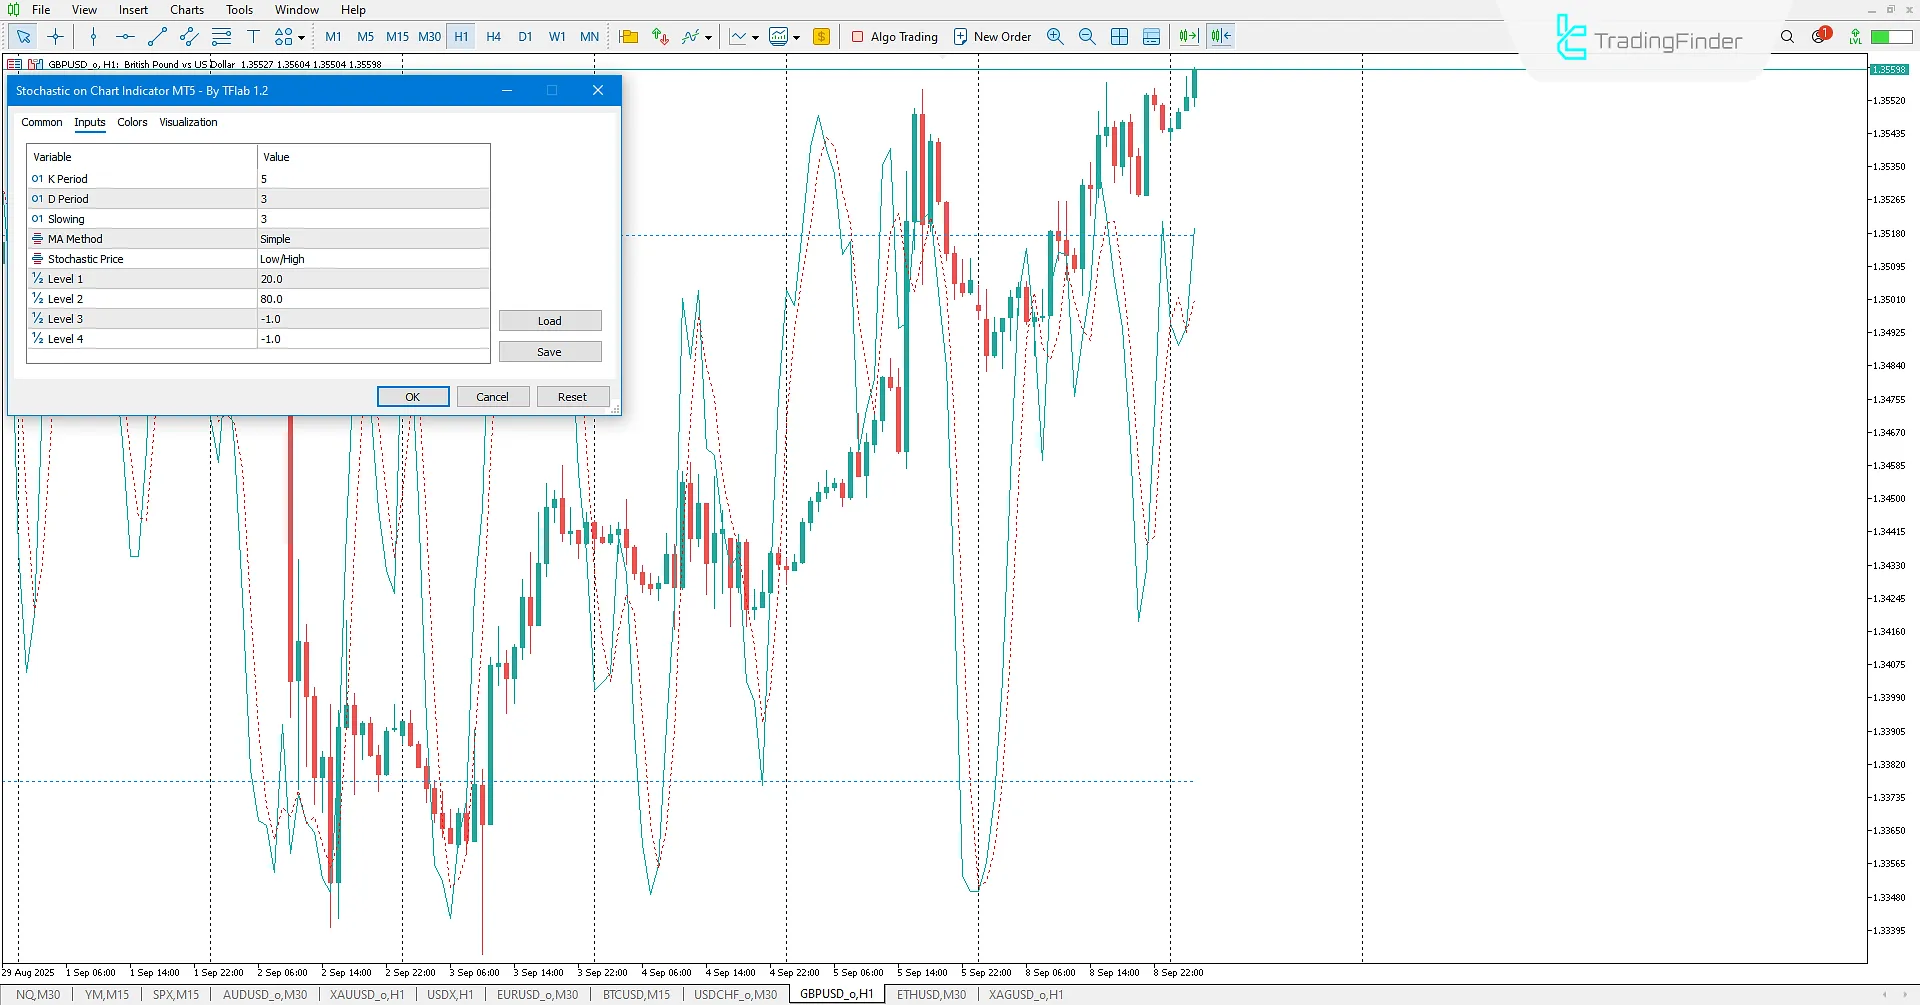
Stochastic on Chart Indicator Settings
Below, the settings of the Stochastic on Chart Indicator are provided:
- K Period: Defines the calculation period for %K;
- D Period: Defines the calculation period for %D;
- Slowing: Defines the slowing period for the Stochastic Oscillator;
- MA Method: Sets the moving average method used in the Stochastic calculation;
- Stochastic Price: Defines the basis for Stochastic calculation;
- Level 1: Sets overbought/oversold level 1 (if set to -1, it will not be displayed);
- Level 2: Sets overbought/oversold level 2 (if set to -1, it will not be displayed);
- Level 3: Sets overbought/oversold level 3 (if set to -1, it will not be displayed);
- Level 4: Sets overbought/oversold level 4 (if set to -1, it will not be displayed).
Conclusion
The Stochastic on Chart Indicator is a professional tool for Forex and cryptocurrency traders to identify overbought and oversold zones directly on the chart.
It displays the Stochastic Oscillator on the price chart, allowing deeper analysis of oscillator line movements and market reactions.
Stochastic on Chart Indicator for MetaTrader 5 PDF
Stochastic on Chart Indicator for MetaTrader 5 PDF
Click to download Stochastic on Chart Indicator for MetaTrader 5 PDFWhat is the Stochastic on Chart Indicator?
It is an advanced and upgraded version of the Stochastic Oscillator designed for MetaTrader 5. It allows technical traders to identify market trends and overbought/oversold zones.
What are the features of the Stochastic on Chart Indicator?
- Direct display of the Stochastic Oscillator on the price chart
- Identification of overbought and oversold zones based on %K and %D lines
- Analysis of oscillator line movements and price reactions on the chart


