![Stochastic RSI Indicator for MetaTrader 5 Download - Free - [TradingFinder]](https://cdn.tradingfinder.com/image/105525/10-12-en-stochastic-rsi-mt5.webp)
![Stochastic RSI Indicator for MetaTrader 5 Download - Free - [TradingFinder] 0](https://cdn.tradingfinder.com/image/105525/10-12-en-stochastic-rsi-mt5.webp)
![Stochastic RSI Indicator for MetaTrader 5 Download - Free - [TradingFinder] 1](https://cdn.tradingfinder.com/image/30897/10-12-en-stochastic-rsi-mt5-02.avif)
![Stochastic RSI Indicator for MetaTrader 5 Download - Free - [TradingFinder] 2](https://cdn.tradingfinder.com/image/30900/10-12-en-stochastic-rsi-mt5-03.avif)
![Stochastic RSI Indicator for MetaTrader 5 Download - Free - [TradingFinder] 3](https://cdn.tradingfinder.com/image/30904/10-12-en-stochastic-rsi-mt5-04.avif)
On June 25, 2025, in version 2, alert/notification functionality was added to this indicator
The Stochastic RSI (StochRSI), MetaTrader 5 oscillator is crafted by combining the Stochastic indicator and the RSI. It captures starting trends and influential movements in the price chart by identifying overbought and oversold points.
This oscillator, by combining the indicators above, identifies overbought areas(values above 80) and oversold areas (values below 20) and issues a new trend start signal when the oscillator curves (blue line and red dashed line) cross.
Indicator Table
Indicator Categories: | Oscillators MT5 Indicators Signal & Forecast MT5 Indicators Currency Strength MT5 Indicators |
Platforms: | MetaTrader 5 Indicators |
Trading Skills: | Elementary |
Indicator Types: | Overbought & Oversold MT5 Indicators Reversal MT5 Indicators |
Timeframe: | Multi-Timeframe MT5 Indicators |
Trading Style: | Swing Trading MT5 Indicators Scalper MT5 Indicators Day Trading MT5 Indicators Fast Scalper MT5 Indicators |
Trading Instruments: | Forex MT5 Indicators Crypto MT5 Indicators Stock MT5 Indicators Share Stock MT5 Indicators |
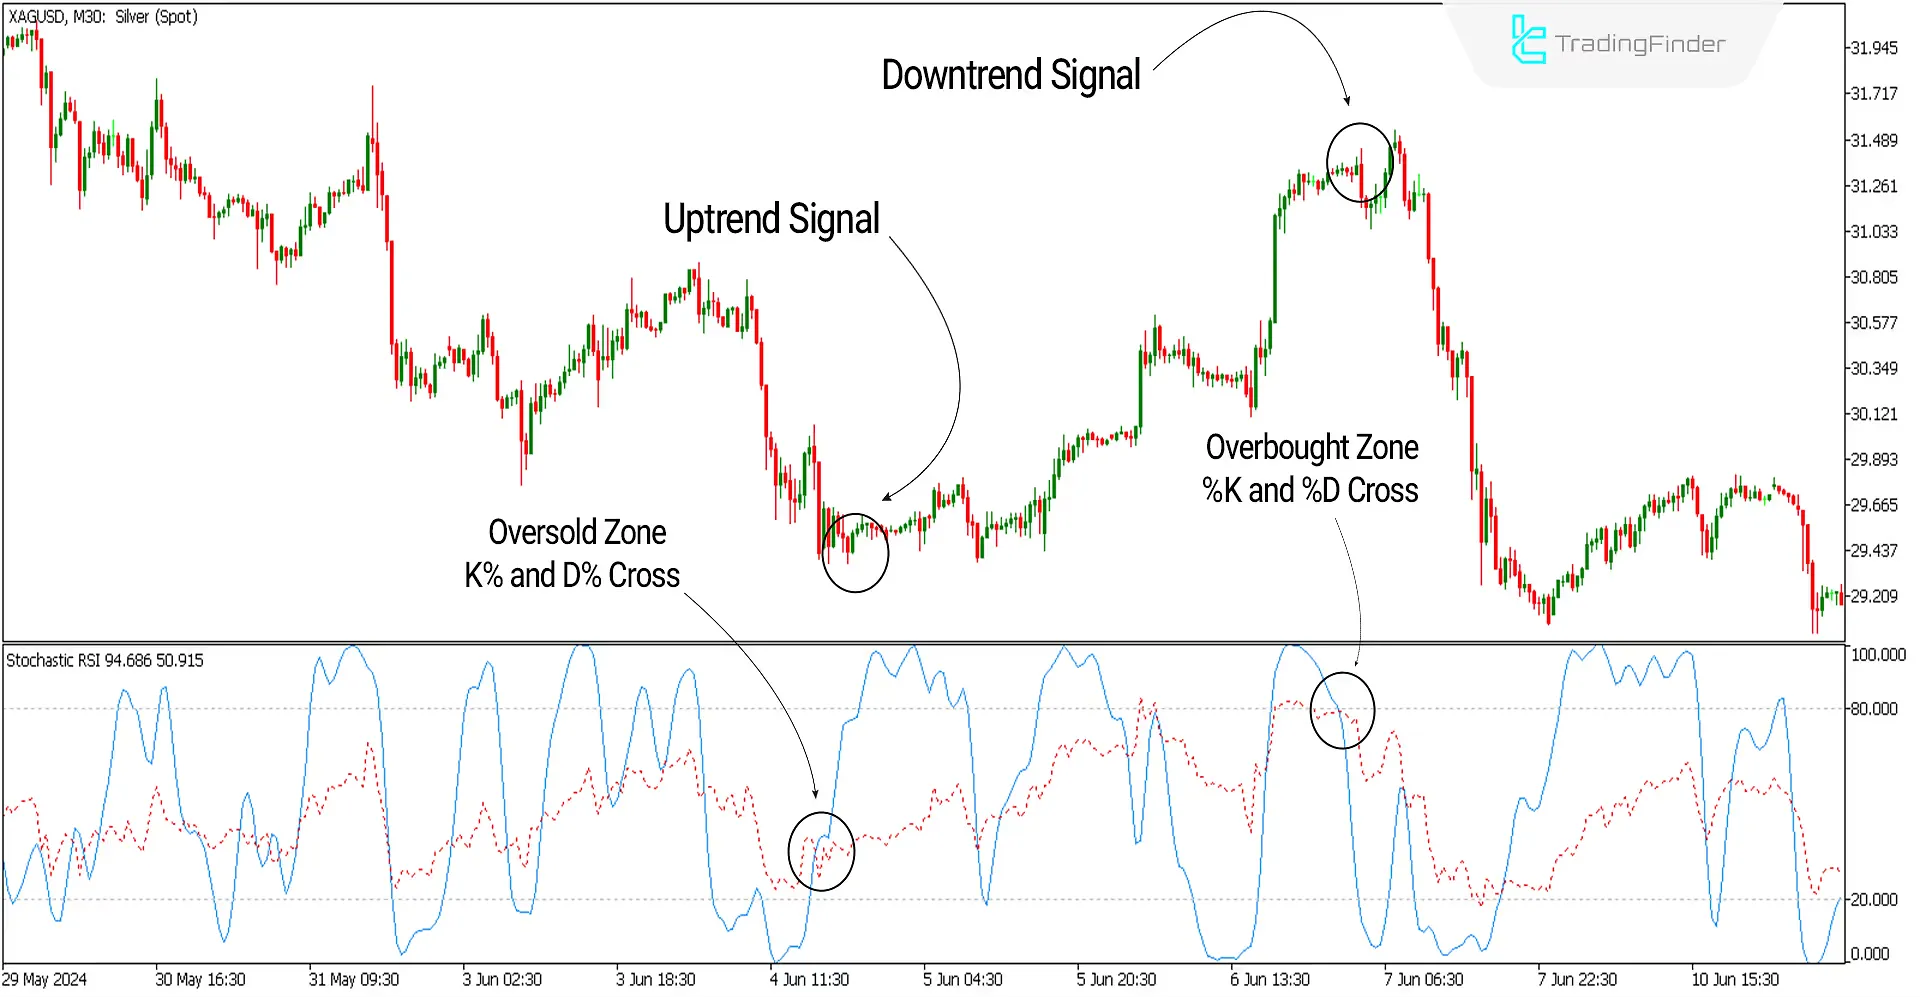
In the image below, the price chart of Global Silver with the symbol XAGUSD is shown in a 30-minute time frame. On the left side of the image, the indicator has reached the oversold zone, and the two lines (K%) and (D%) cross upwards. In this condition, a bullish trend signal and buying opportunities are issued.
On the right side of the image, the price has reached the overbought zone, and the two lines(K%) and (D%) cross downwards. In this condition, a bearish trend signal and selling opportunities are issued.

Overview
Many traders need to improve in confirming entry points in their trading strategies. Oscillators such as the Stochastic and RSI can be used alongside other analytical tools to discern the main trend direction and, with this oscillator, trigger trade entries.
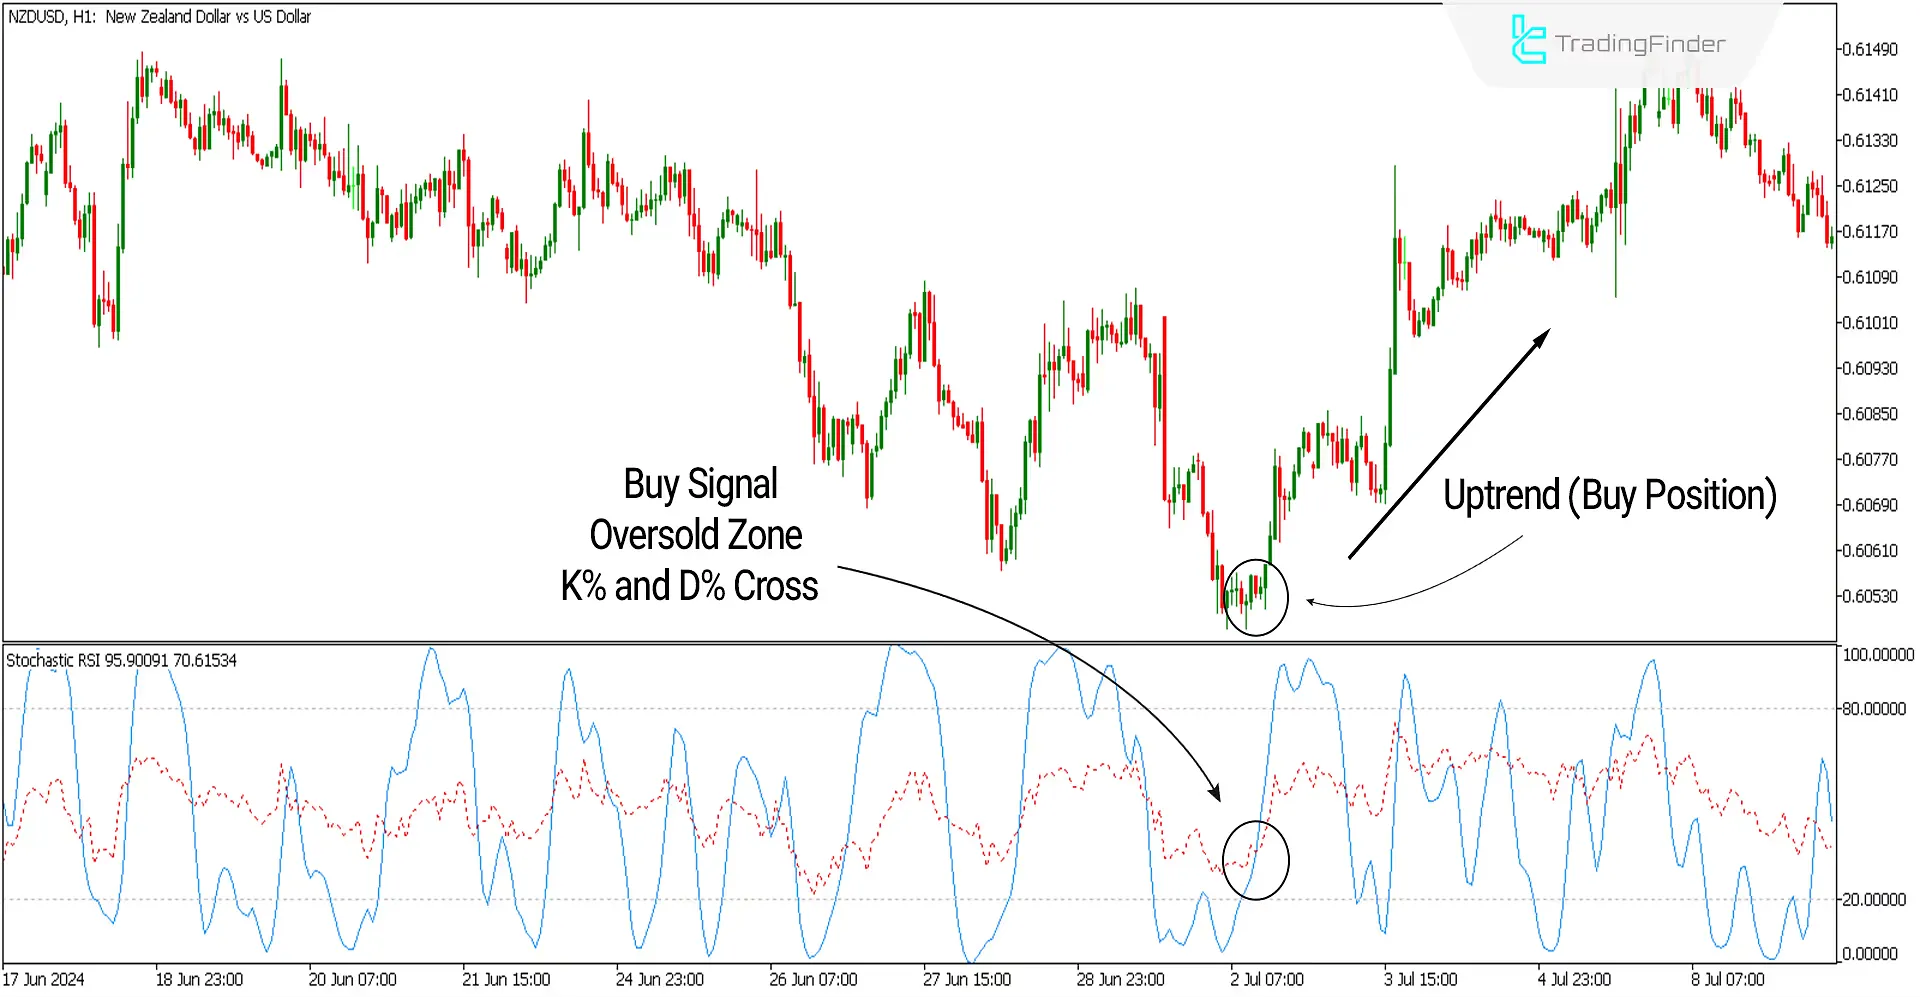
Uptrend Signal Conditions of the Indicator (Buy Position)

Downtrend Signal Conditions of the Indicator (Sell Positions)
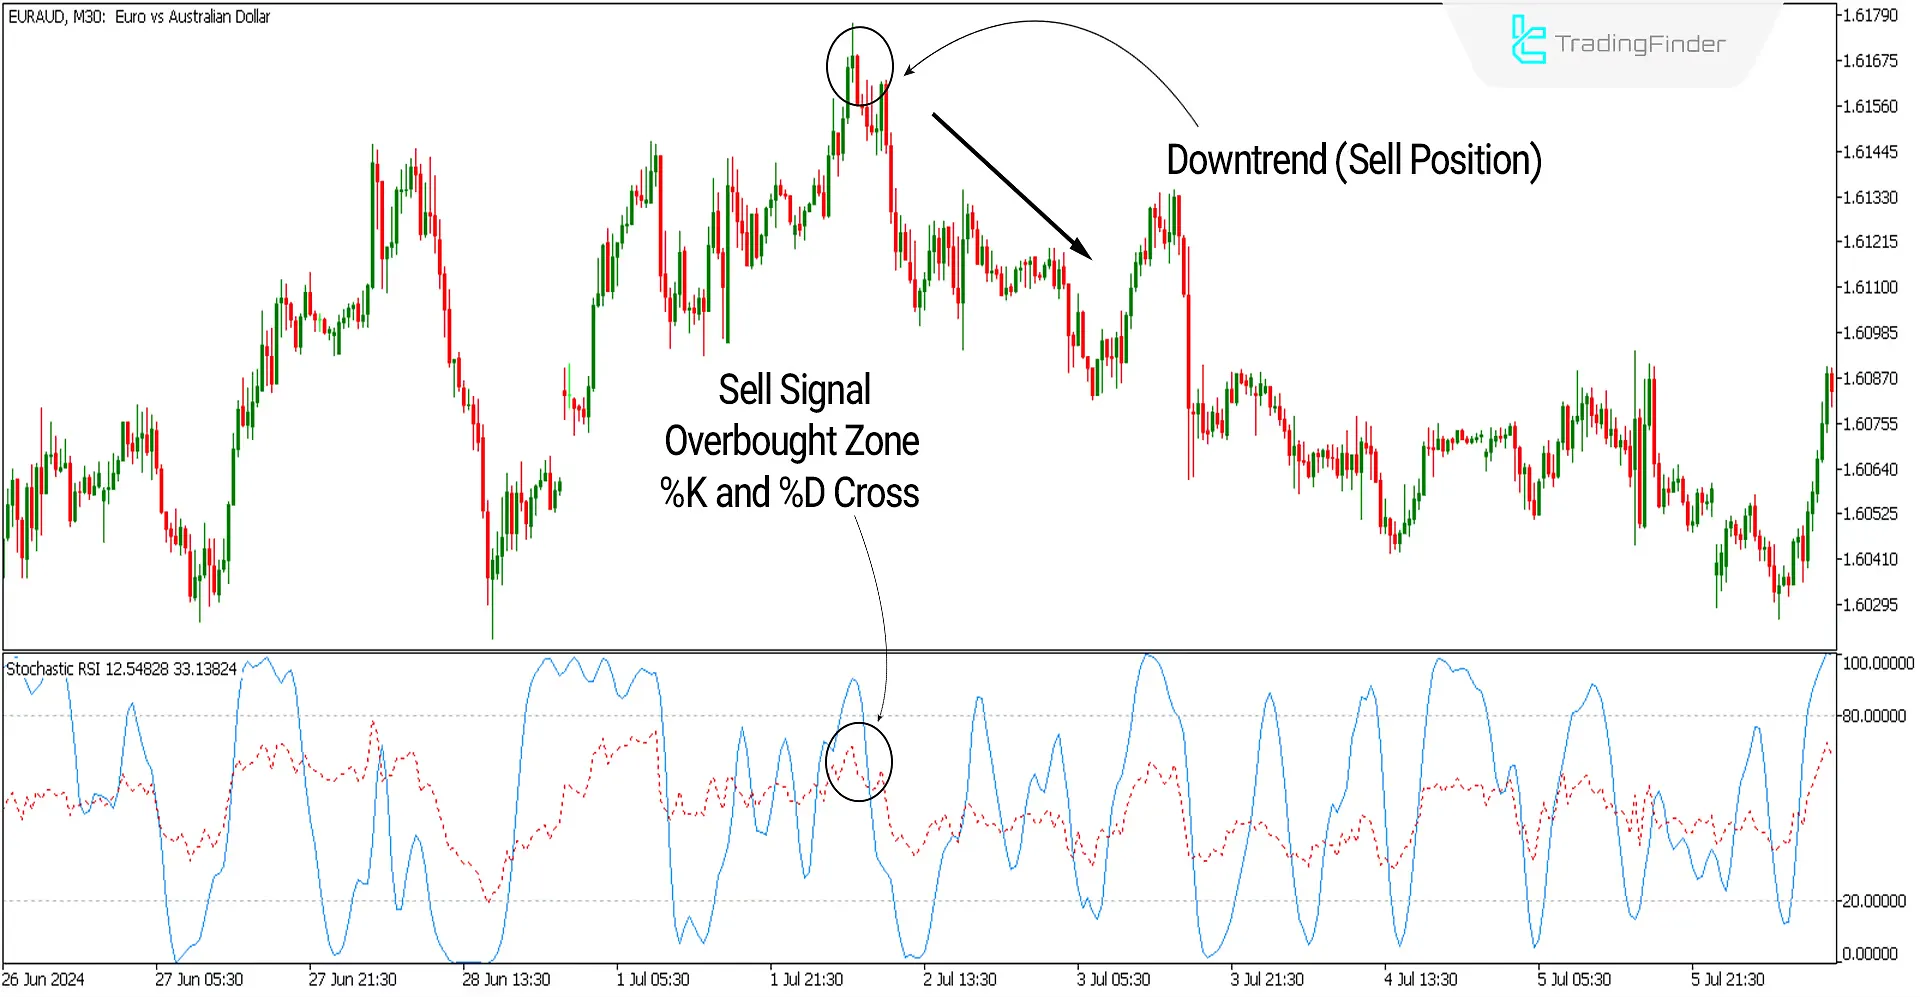
In the image below, the price chart of the Euro to Australian Dollar pair with the symbol EURAUD is shown in a 30-minute time frame.
The indicator has reached the overbought zone, and the two oscillator lines(K%) and (D%) cross downwards. A bearish signal is issued in this condition, and one can pursue short positions.

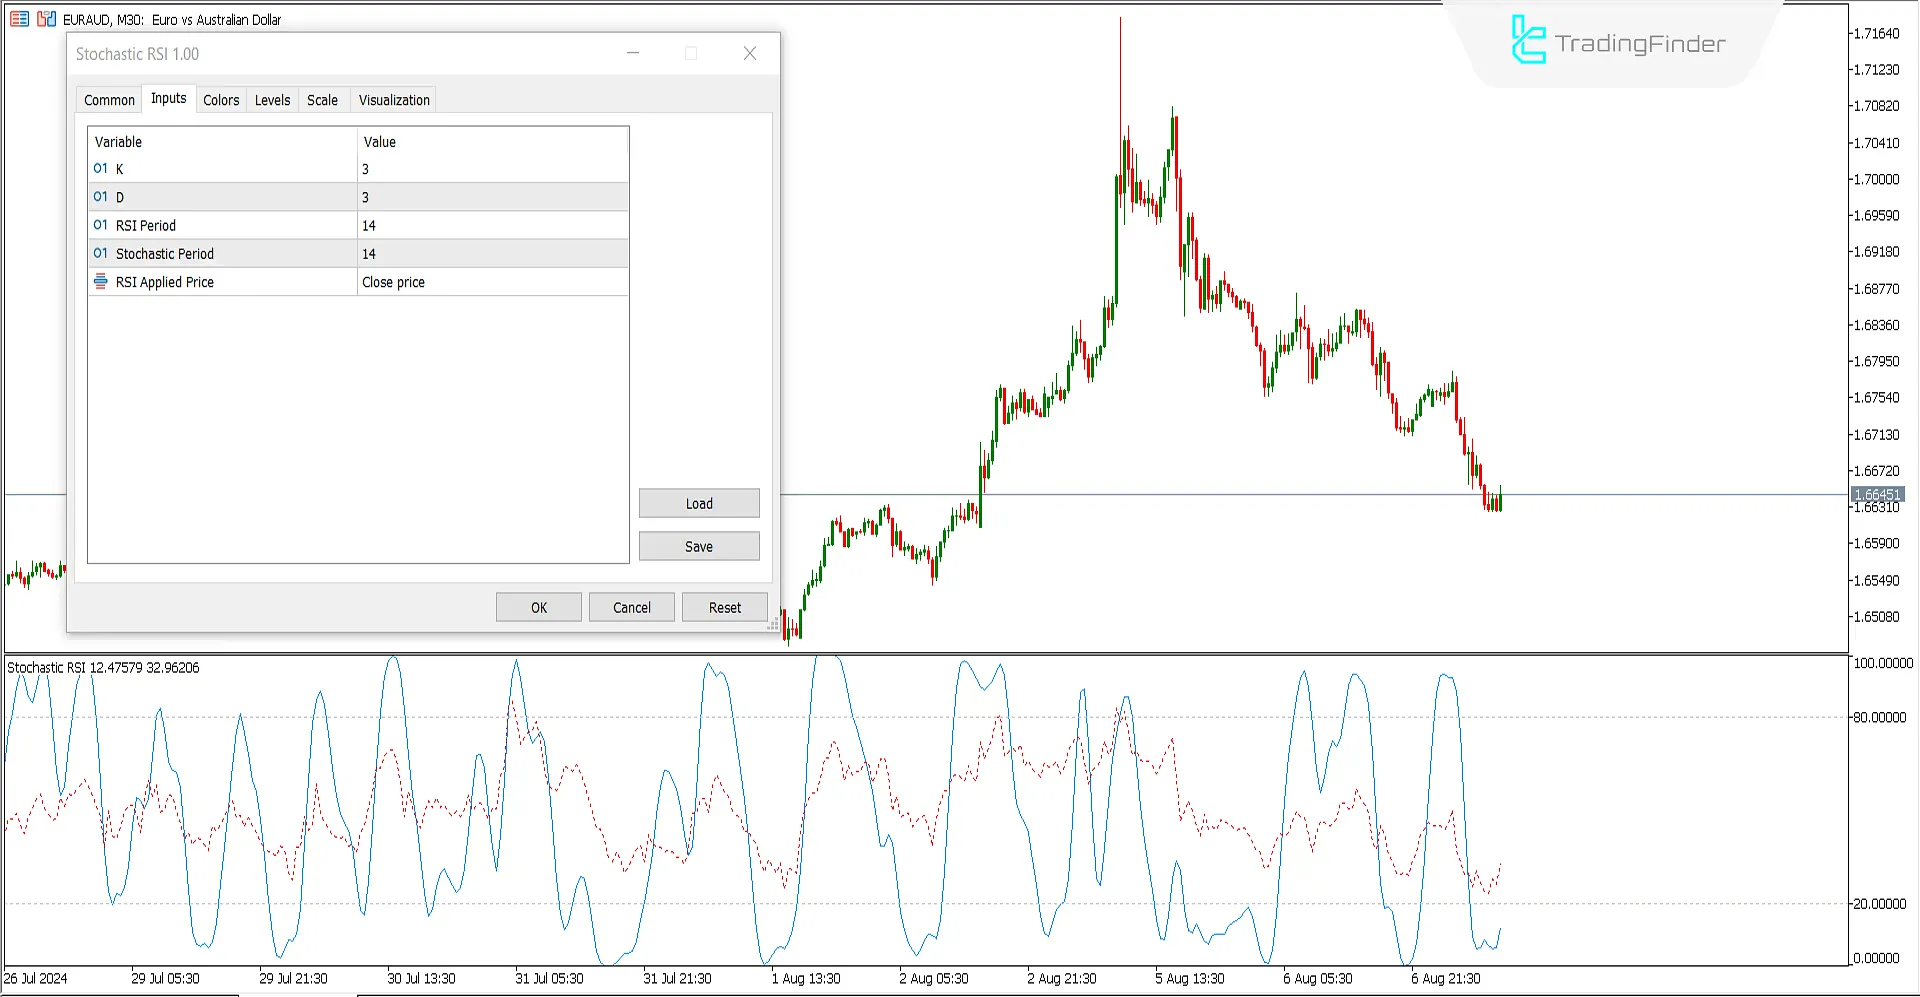
StochRSI Indicator Settings

- K: The main line in the Stochastic indicator equals 3؛
- D: The moving average line in Stochastic equals 3؛
- RSI Period: The RSI indicator period equals 14؛
- Stochastic Period: The Stochastic indicator period equals 14؛
- RSI Applied Price: The calculation criterion for the RSI indicator is based on Close Price.
Conclusion
Using the StochRSI oscillator can give traders a good idea of future trends. Additionally, using it alongside other analytical tools, such as MT5 support and resistance levels Indicator, price channels and regression, Fibonacci tools, etc., is very beneficial and offers optimal entry points for trading.
Stochastic RSI MT5 PDF
Stochastic RSI MT5 PDF
Click to download Stochastic RSI MT5 PDFHow to use StochRSI in trading?
The entry signal of this oscillator is based on the crossing of its two curves. An upward cross signals a bullish trend, and a downward cross signals a bearish trend.
What is Stochastic RSI?
It is an oscillator that, based on the overbought and oversold zones, signals trend reversals and identifies the direction of future trends.


