![Super Signal Channel Indicator for MT5 Download – Free – [TradingFinder]](https://cdn.tradingfinder.com/image/545600/13-209-en-super-signal-channel-mt5-01.webp)
![Super Signal Channel Indicator for MT5 Download – Free – [TradingFinder] 0](https://cdn.tradingfinder.com/image/545600/13-209-en-super-signal-channel-mt5-01.webp)
![Super Signal Channel Indicator for MT5 Download – Free – [TradingFinder] 1](https://cdn.tradingfinder.com/image/545607/13-209-en-super-signal-channel-mt5-02.webp)
![Super Signal Channel Indicator for MT5 Download – Free – [TradingFinder] 2](https://cdn.tradingfinder.com/image/545599/13-209-en-super-signal-channel-mt5-03.webp)
![Super Signal Channel Indicator for MT5 Download – Free – [TradingFinder] 3](https://cdn.tradingfinder.com/image/545622/13-209-en-super-signal-channel-mt5-04.webp)
The Super Signal Channel indicator is designed to track market changes and identify price reversals.
Using technical analysis algorithms, this indicator analyzes continuous price fluctuations and ultimately displays buy and sell signals on the chart.
In addition, by drawing two dynamic lines (green and red) around the price chart, it creates a type of trading channel.
Specification Table of the Super Signal Channel Indicator
The following table describes the features of the Super Signal Channel indicator.
Indicator Categories: | Signal & Forecast MT5 Indicators Bands & Channels MT5 Indicators Levels MT5 Indicators |
Platforms: | MetaTrader 5 Indicators |
Trading Skills: | Elementary |
Indicator Types: | Reversal MT5 Indicators |
Timeframe: | Multi-Timeframe MT5 Indicators |
Trading Style: | Swing Trading MT5 Indicators Scalper MT5 Indicators Day Trading MT5 Indicators |
Trading Instruments: | Forex MT5 Indicators Crypto MT5 Indicators Stock MT5 Indicators |
Super Signal Channel Indicator at a Glance
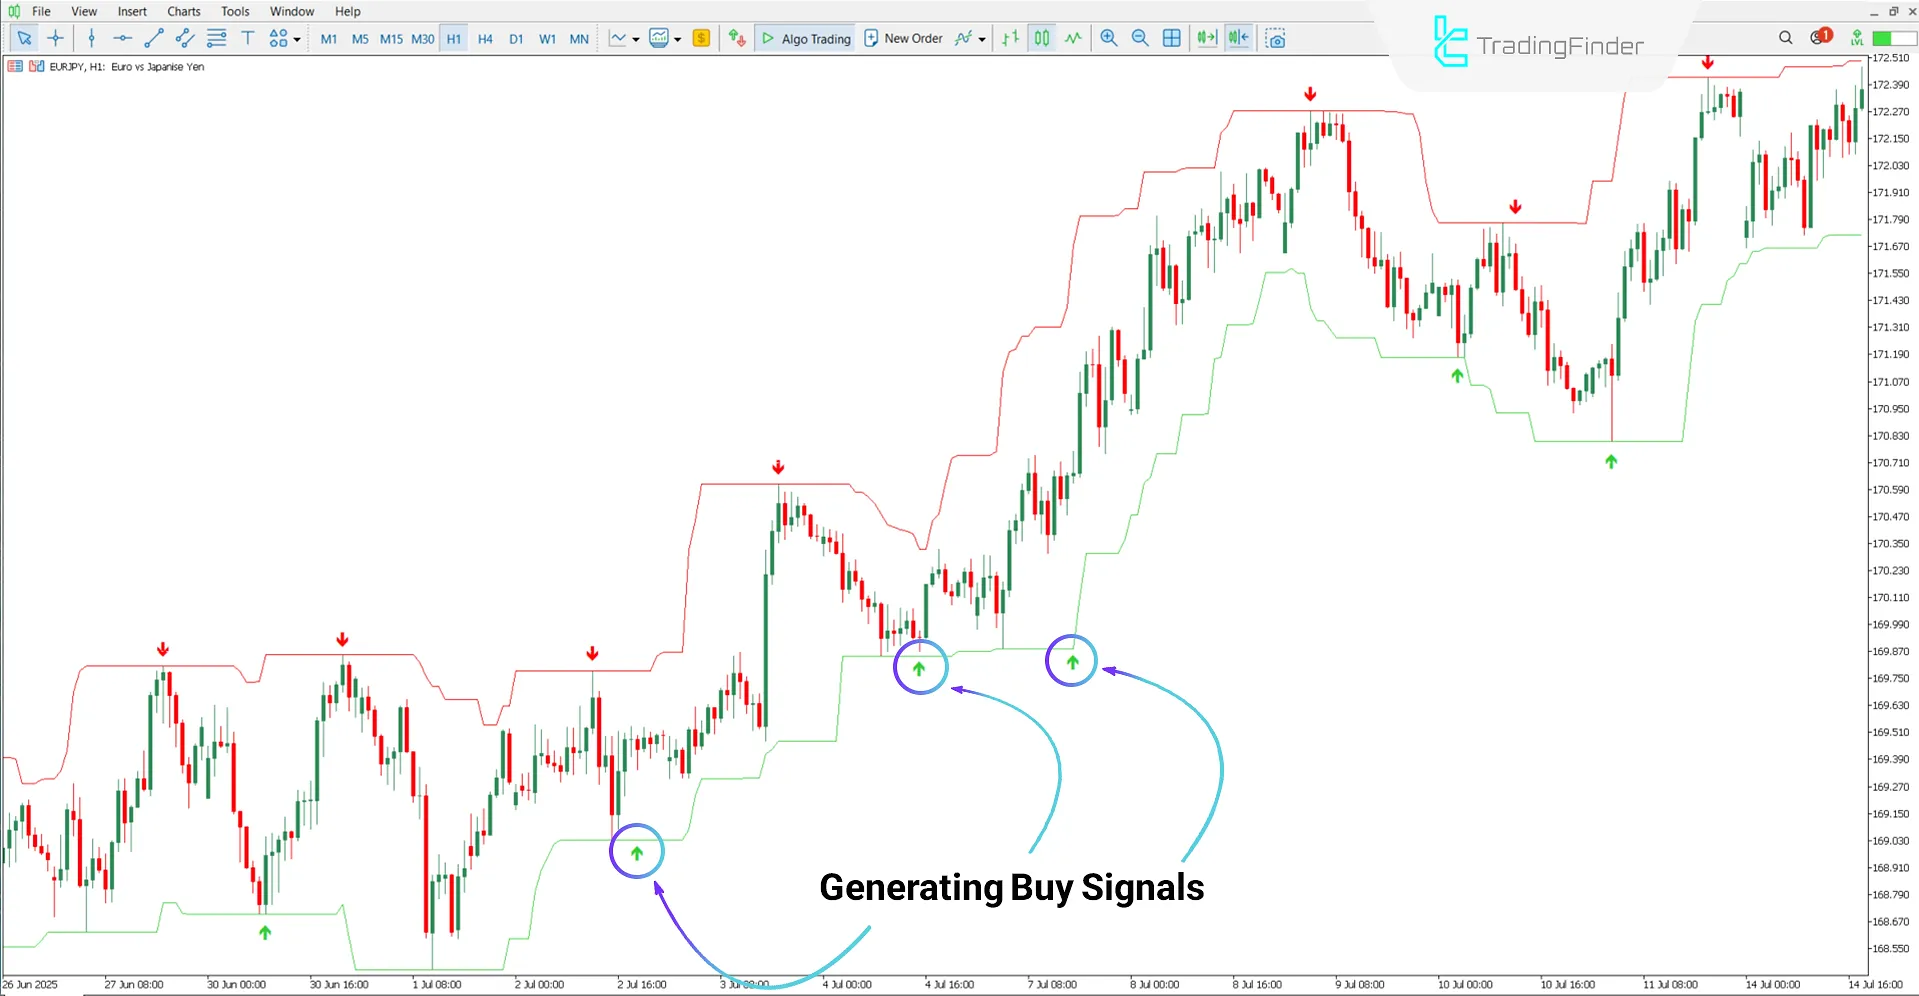
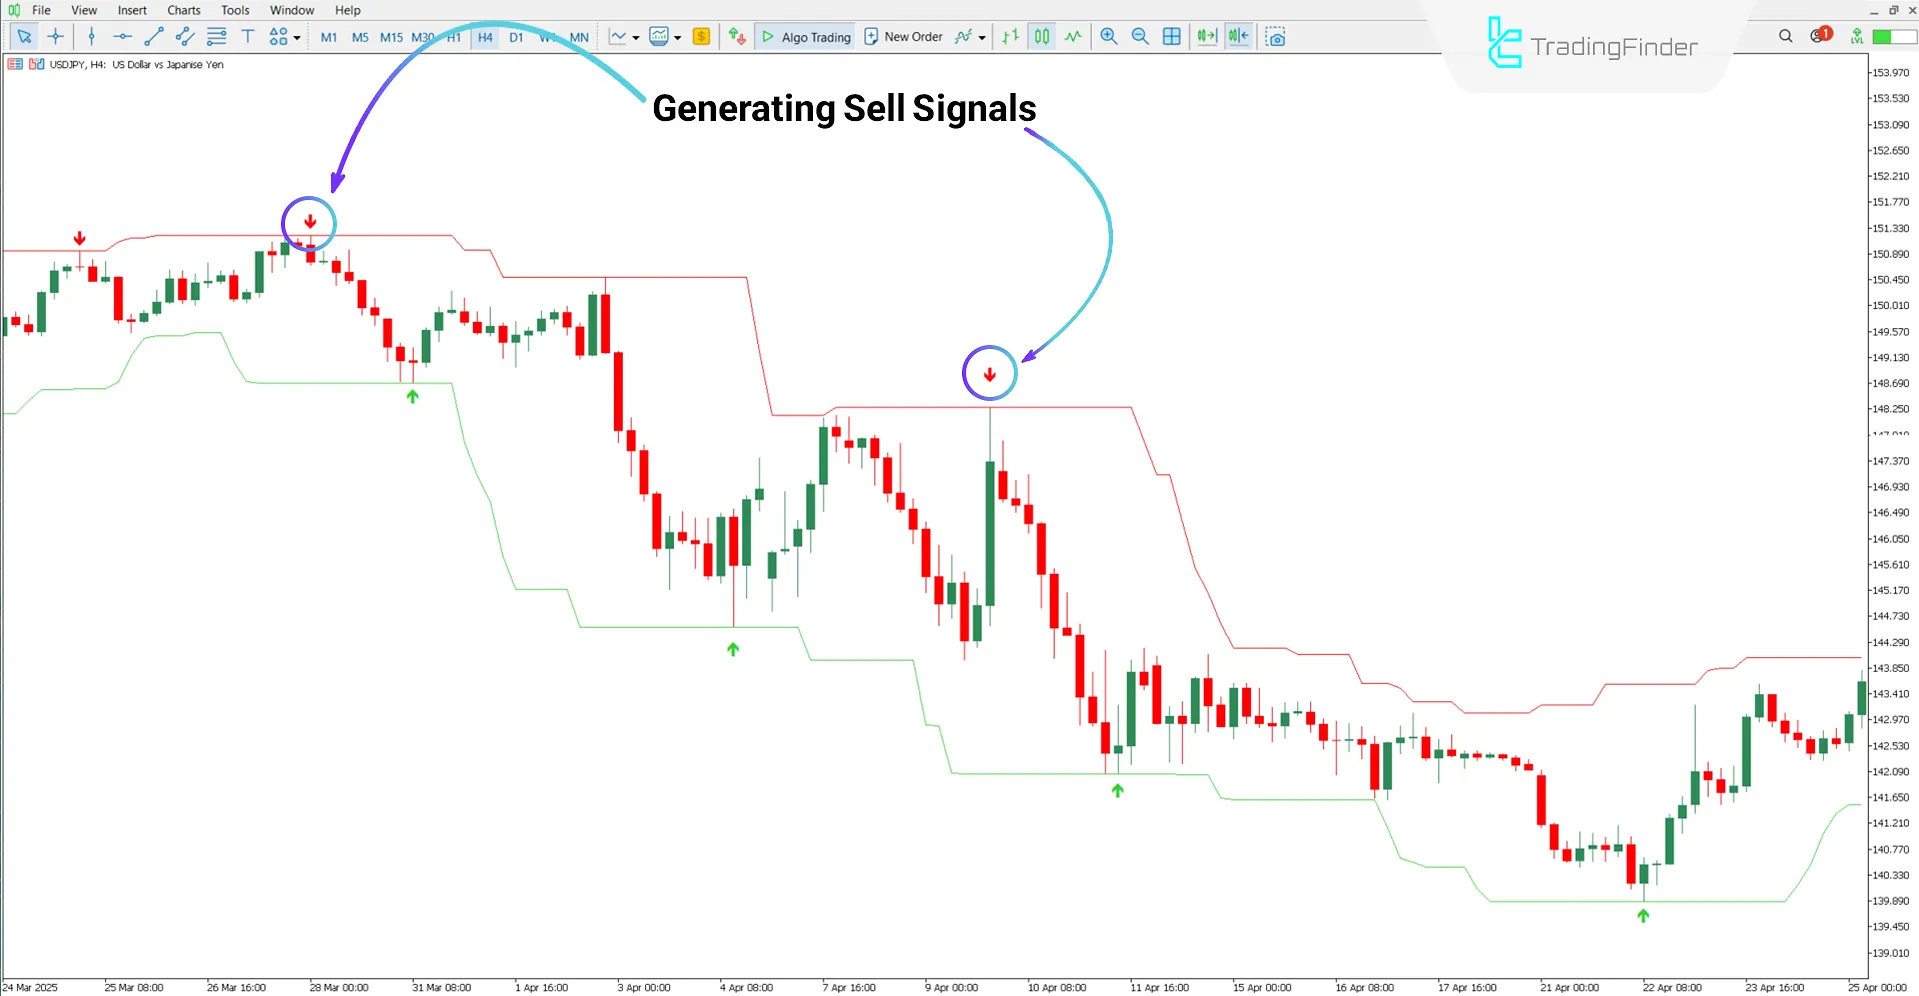
The Super Signal Channel indicator, by using green and red arrows on the chart, clearly shows entry and exit points for trades.
Green arrows act as the start of buy positions, while red arrows serve as warnings for sell trade entries.
Buy Signal
Based on the EUR/JPY chart on the 1-hour timeframe, green arrows appear as buy signals.
In such conditions, traders can enter buy positions depending on the trend direction and place the stop-loss below the green line.

Sell Signal
According to the USD/JPY chart on the 4-hour timeframe, bearish signals are identified by red arrows displayed on the chart.
These conditions indicate opportunities for entering sell positions, which can be used by following the downward market trend.

Super Signal Channel Indicator Settings
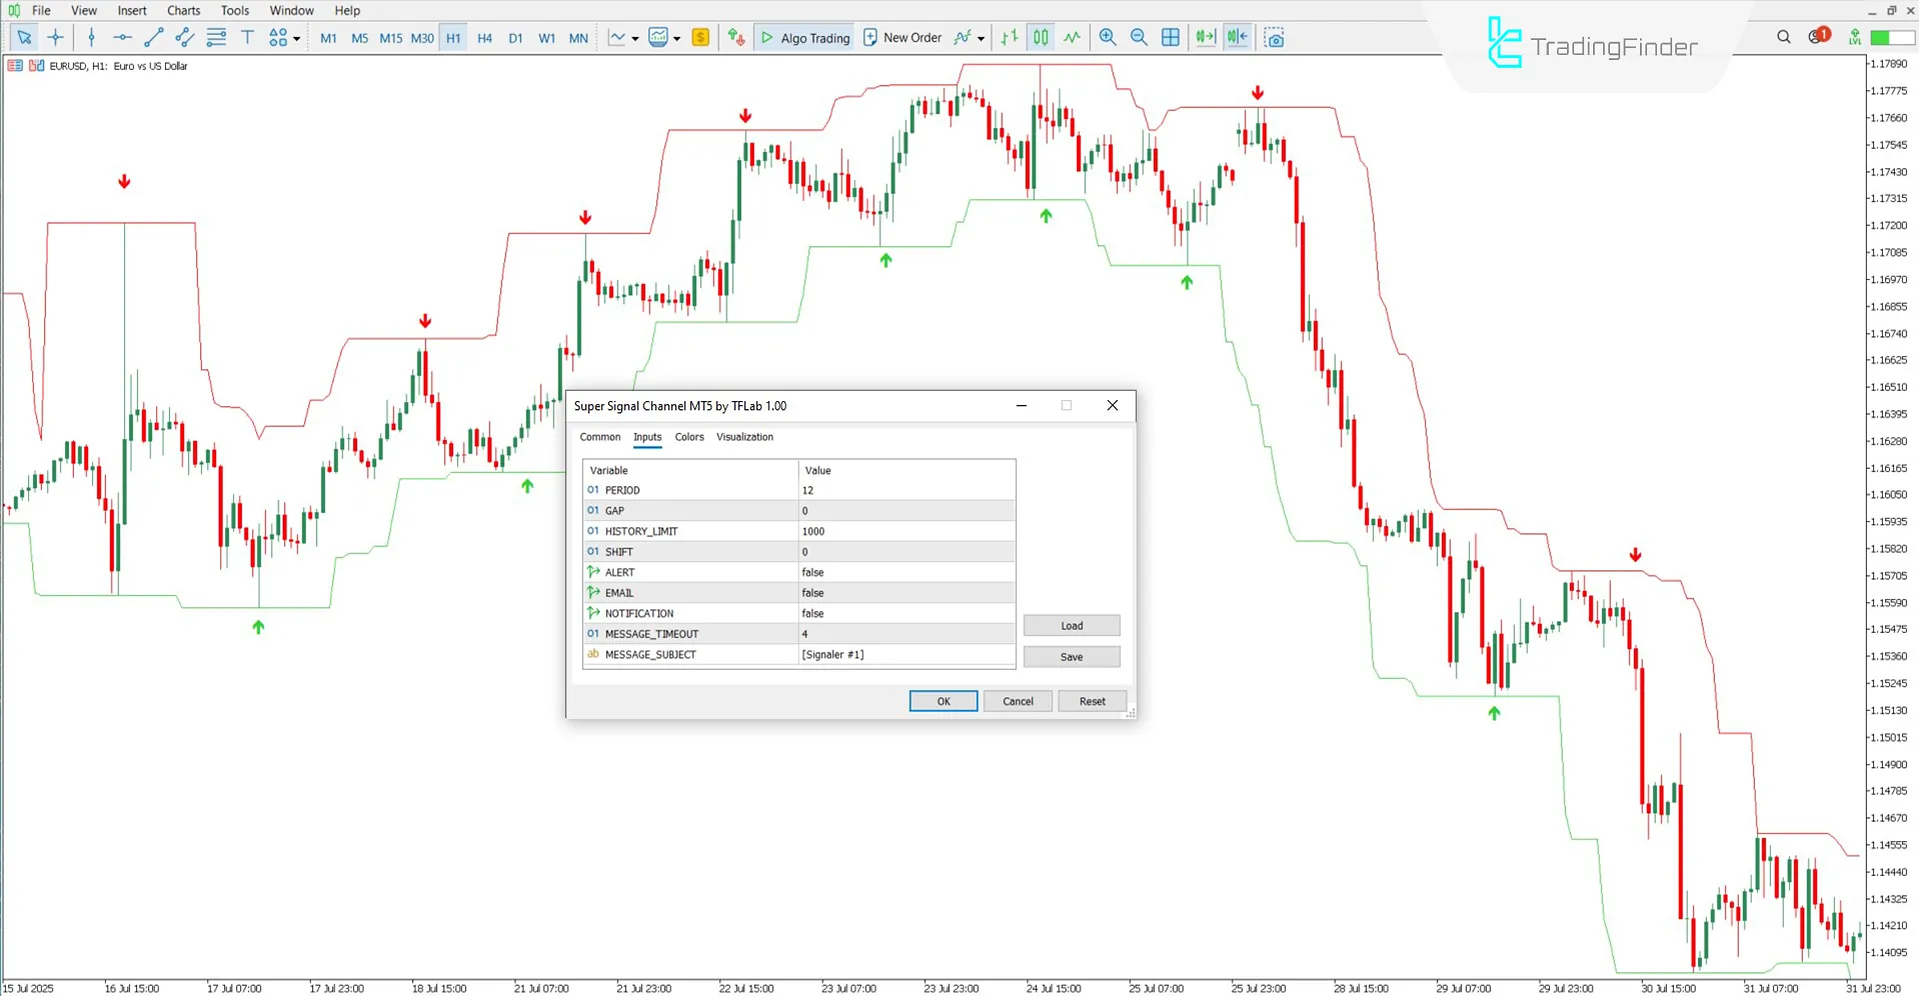
The settings of the Super Signal Channel indicator are as follows:

- PERIOD: Number of indicator calculation periods
- GAP: Distance or gap between channel lines and price
- HISTORY_LIMIT: Maximum number of past candles to analyze
- SHIFT: Displacement of the signal on the time axis
- ALERT: Alert activation
- EMAIL: Sending alerts via email
- NOTIFICATION: Notification activation
- MESSAGE_TIMEOUT: Time interval between alerts
- MESSAGE_SUBJECT: Alert title
Conclusion
The Super Signal Channel indicator is a practical tool for identifying trend reversals and determining suitable entry and exit points.
By displaying colored arrows on the chart, this indicator specifies buy and sell trading conditions.
Using this tool in combination with other trading strategies increases the accuracy of trading decisions.
Super Signal Channel Indicator MT5 PDF
Super Signal Channel Indicator MT5 PDF
Click to download Super Signal Channel Indicator MT5 PDFCan this indicator be used on higher timeframes?
Yes, the Super Signal Channel indicator is multi-timeframe and can be applied across all timeframes.
What do the green arrows represent?
Green arrows indicate suitable entry points for buy trades.


