![Super Stochastic Indicator MT5 Download – Free – [TradingFinder]](https://cdn.tradingfinder.com/image/349314/13-109-en-super-stochastic-mt5-01.webp)
![Super Stochastic Indicator MT5 Download – Free – [TradingFinder] 0](https://cdn.tradingfinder.com/image/349314/13-109-en-super-stochastic-mt5-01.webp)
![Super Stochastic Indicator MT5 Download – Free – [TradingFinder] 1](https://cdn.tradingfinder.com/image/349316/13-109-en-super-stochastic-mt5-02.webp)
![Super Stochastic Indicator MT5 Download – Free – [TradingFinder] 2](https://cdn.tradingfinder.com/image/349312/13-109-en-super-stochastic-mt5-03.webp)
![Super Stochastic Indicator MT5 Download – Free – [TradingFinder] 3](https://cdn.tradingfinder.com/image/349317/13-109-en-super-stochastic-mt5-04.webp)
The Super Stochastic Indicator combines multiple algorithms to offer more precise trading signals than the classic stochastic version.
This indicator identifies and marks the intersection points between the signal and oscillator lines while high lighting overbought and oversold zones.
Its ability to detect trend reversals and market momentum makes it a suitable trading tool for various trading styles.
Advanced Stochastic Indicator Specifications
The features and specifications of the Super Stochastic indicator are presented in the table below.
Indicator Categories: | Oscillators MT5 Indicators Signal & Forecast MT5 Indicators Currency Strength MT5 Indicators |
Platforms: | MetaTrader 5 Indicators |
Trading Skills: | Intermediate |
Indicator Types: | Trend MT5 Indicators Reversal MT5 Indicators |
Timeframe: | Multi-Timeframe MT5 Indicators |
Trading Style: | Swing Trading MT5 Indicators Intraday MT5 Indicators Scalper MT5 Indicators Day Trading MT5 Indicators |
Trading Instruments: | Forex MT5 Indicators Crypto MT5 Indicators Stock MT5 Indicators |
Super Stochastic Oscillator at a Glance
The Super Stochastic indicator highlights crossover points as entry or exit signals and marks non-signal zones using a cross symbol.
Additionally, it displays overbought and oversold zones in two distinct ways:
- Changing the color of the oscillator line
- Displaying a text message within the indicator panel
Buy Trade Signal
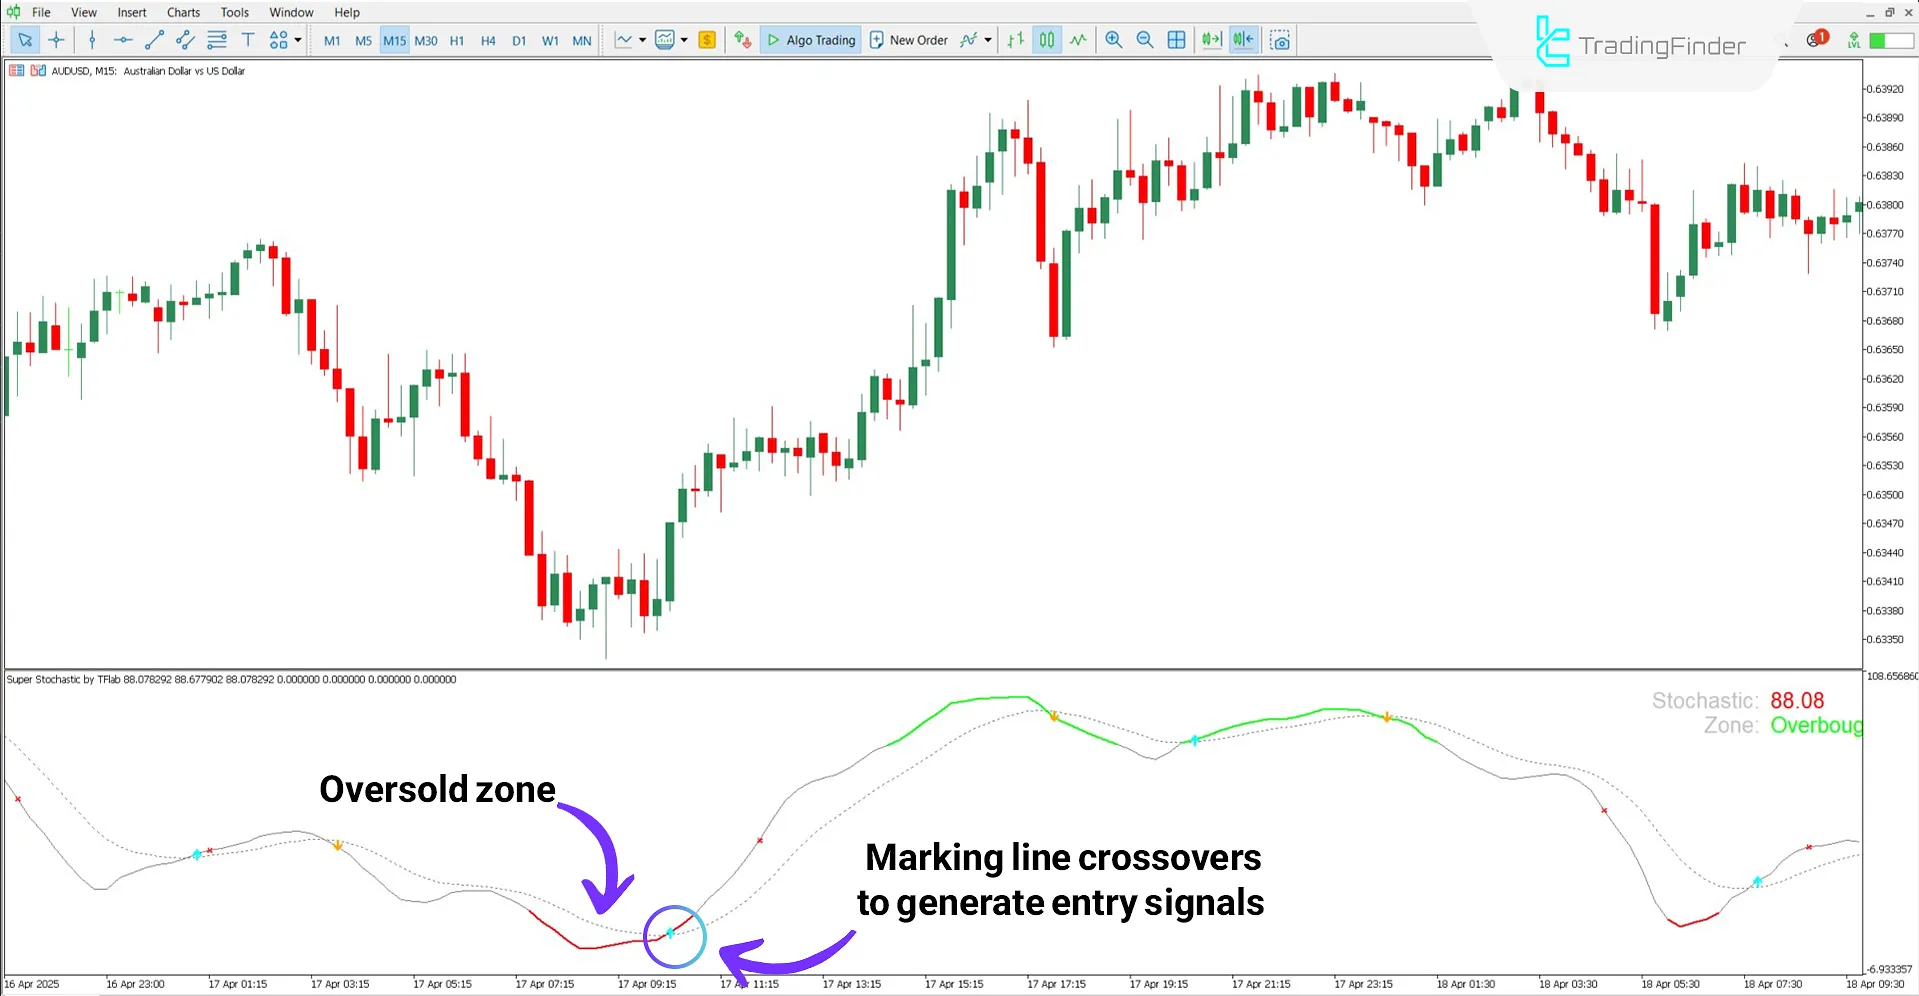
The 15-minute chart of the AUD/USD pair shows the oscillator line turning red, indicating that the price has entered the oversoldzone. Next, the crossover point is marked with a blue arrow.
This marked point can be considered a potential opportunity for entering a Buy Position.

Sell Trade Signal
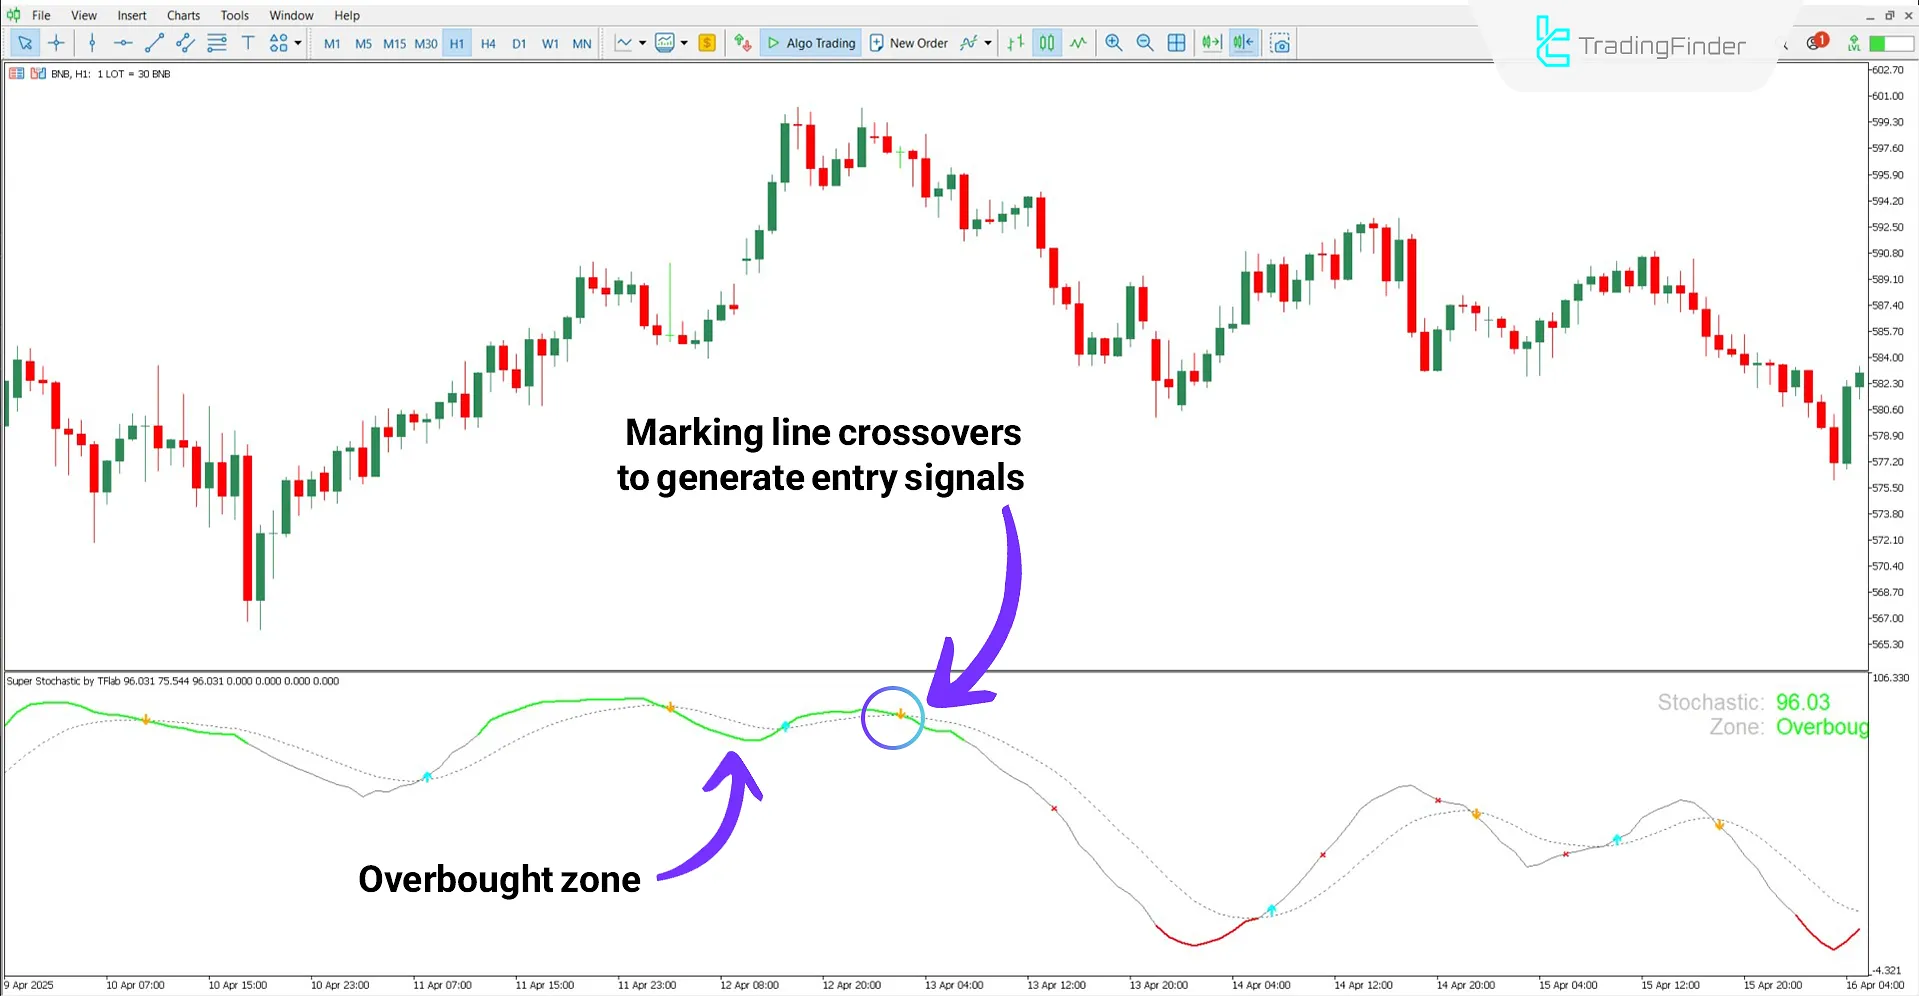
Based on the 1-hour Binance Coin (BNB) chart, the oscillator line turns green upon entering the overbought zone. A subsequent downward move in the lines suggests a bearish trend, and the indicator marks the bearish crossover with a yellow arrow.

Super Stochastic Oscillator Settings
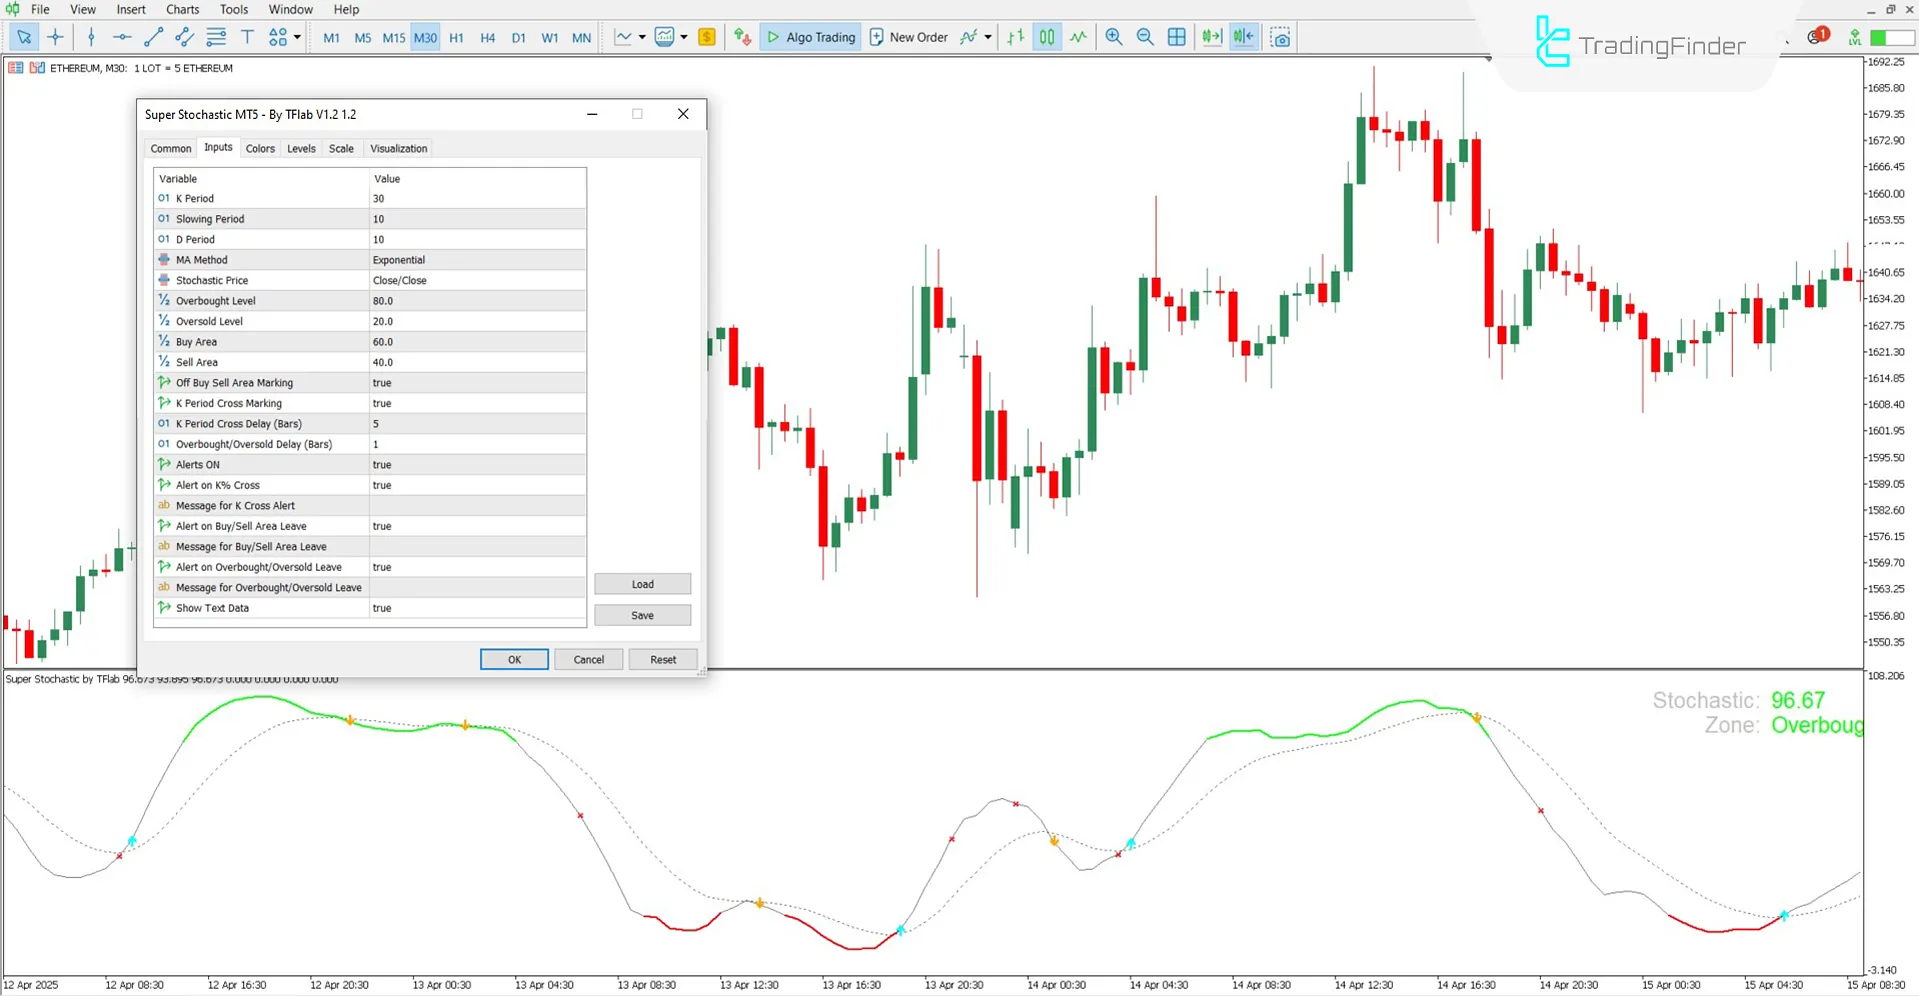
The image below displays the settings panel of the Super Stochastic indicator in MetaTrader 5:

- K Period: Number of candles used to calculate the %K line;
- Slowing Period: Smoothing period applied to the %K line;
- D Period: Period for calculating the %D (signal) line;
- MA Method: Type of moving average used for calculations;
- Stochastic Price: Price type used for the oscillator calculation;
- Overbought Level: Threshold for overbought condition;
- Oversold Level: Threshold for oversold condition;
- Buy Area: Settings related to strengthening buy signals;
- Sell Area: Settings related to strengthening sell signals;
- Off Buy/Sell Area Marking: Enables graphical marking of buy/sell zones;
- K Period Cross Marking: Enables marking of %K line crossovers;
- K Period Cross Delay (Bars): Delay in marking crossover signals (in bars);
- Overbought/Oversold Delay (Bars): Delay in showing OB/OS zone entries (in candles);
- Alerts ON: Enables alerts;
- Alert on %K Cross: Triggers alert when %K crosses %D;
- Message for K Cross Alert: Sends a message when a crossover occurs;
- Alert on Buy/Sell Area Leave: Alert when the oscillator exits buy/sell zones;
- Message for Buy/Sell Area Leave: Displays a message when exiting buy/sell zones;
- Alert on Overbought/Oversold Leave: Alert when exiting overbought/oversold zones;
- Message for Overbought/Oversold Leave: Displays a message upon exiting OB/OS zones;
- Show Text Data: Displays the oscillator’s numerical values on the chart.
Conclusion
The Super Stochastic Indicator is a practical technical analysis tool that helps identify entry and exit points. It also highlights overbought and oversold areas, making it easier to detect potential trend reversals.
Its customizable settings allow traders to adapt the indicator to their trading strategies effectively.
Super Stochastic MT5 PDF
Super Stochastic MT5 PDF
Click to download Super Stochastic MT5 PDFIs the Super Stochastic Indicator suitable for the 5-minute timeframe?
Yes, this multi-timeframe indicator can be used across all timeframes.
What is the main purpose of the Super Stochastic Oscillator?
Its main functions include identifying overbought and oversold zones, spotting trend reversal points, and generating reliable trading signals.
Merci beaucoup pour vos efforts afin de suivre approximativement le prix a travers vos indicateurs.


