![SuperTrend AI Indicator for MT5 Download – Free – [TradingFinder]](https://cdn.tradingfinder.com/image/615183/13-251-en-supertrend-ai-mt5-01.webp)
![SuperTrend AI Indicator for MT5 Download – Free – [TradingFinder] 0](https://cdn.tradingfinder.com/image/615183/13-251-en-supertrend-ai-mt5-01.webp)
![SuperTrend AI Indicator for MT5 Download – Free – [TradingFinder] 1](https://cdn.tradingfinder.com/image/615177/13-251-en-supertrend-ai-mt5-02.webp)
![SuperTrend AI Indicator for MT5 Download – Free – [TradingFinder] 2](https://cdn.tradingfinder.com/image/615179/13-251-en-supertrend-ai-mt5-03.webp)
![SuperTrend AI Indicator for MT5 Download – Free – [TradingFinder] 3](https://cdn.tradingfinder.com/image/615181/13-251-en-supertrend-ai-mt5-04.webp)
The SuperTrend AI Indicator is developed using the machine learning algorithm “K-Means Clustering” combined with technical analysis principles to dynamically track price trend behavior.
In this version, instead of using fixed parameters like the classic model, market data is clustered into three performance categories (strong, normal, and weak), and the final result is derived from the average of the active clusters.
The main function of this indicator is to determine the direction of the trend and create an intelligent Trailing Stop, while also identifying variable support and resistance levels.
SuperTrend AI Indicator Specification Table
The table below contains the specifications of the SuperTrend AI Indicator:
Indicator Categories: | Signal & Forecast MT5 Indicators Machine Learning Indicators for MetaTrader 5 AI Indicators for MetaTrader 5 |
Platforms: | MetaTrader 5 Indicators |
Trading Skills: | Elementary |
Indicator Types: | Reversal MT5 Indicators |
Timeframe: | Multi-Timeframe MT5 Indicators |
Trading Style: | Swing Trading MT5 Indicators Scalper MT5 Indicators Day Trading MT5 Indicators |
Trading Instruments: | Forex MT5 Indicators Crypto MT5 Indicators Stock MT5 Indicators |
SuperTrend AI Indicator at a Glance
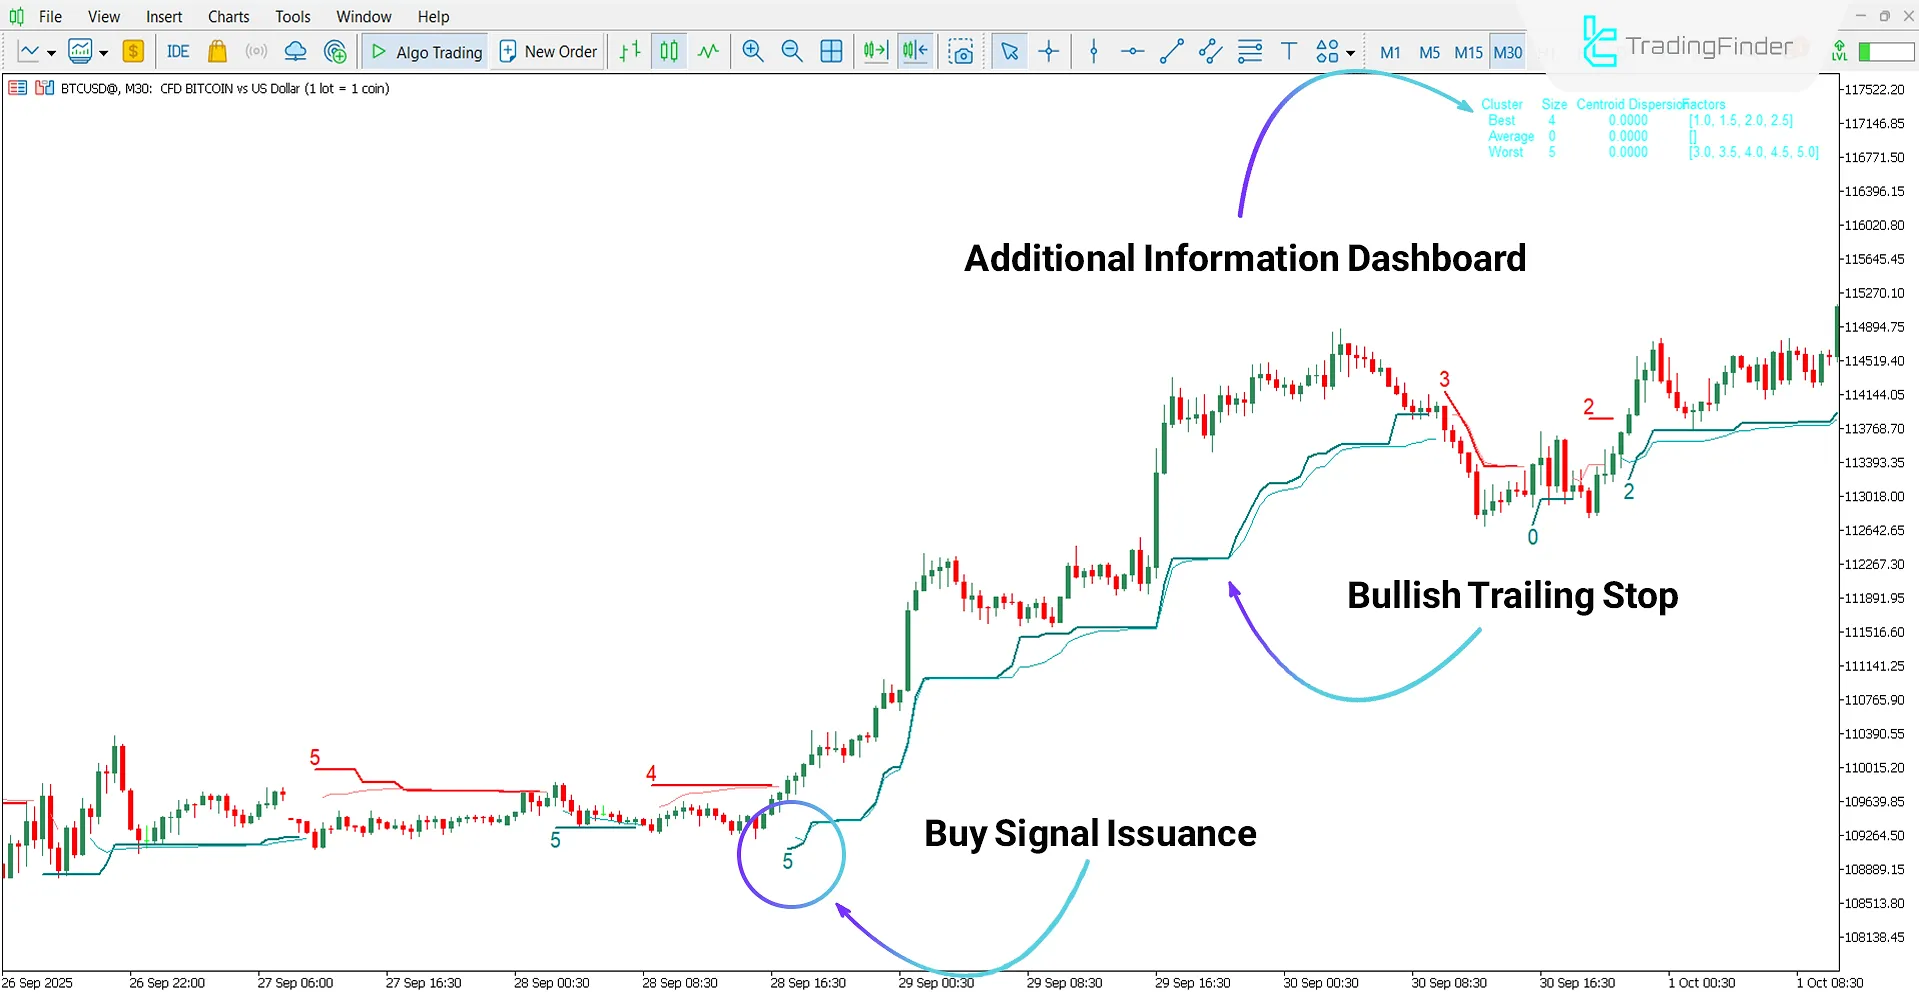
The SuperTrend AI Indicator displays a dashboard on the chart to provide additional analytical information.
This dashboard includes the following elements:
- Cluster: Cluster type (Best, Average, Worst) based on performance;
- Size: Number of samples included in each cluster;
- Centroid Dispersion: Mean value and data dispersion of each cluster;
- Factors: Range of factors used in the SuperTrend calculations.
Buy Signal
According to the 30-minute chart of Bitcoin (BTC) cryptocurrency, a buy signal is identified with label number 5. These numeric labels indicate the signal strength, and higher values confirm greater signal reliability.
Additionally, the blue trailing stop zones below are considered suitable areas for setting stop-loss levels.

Sell Signal
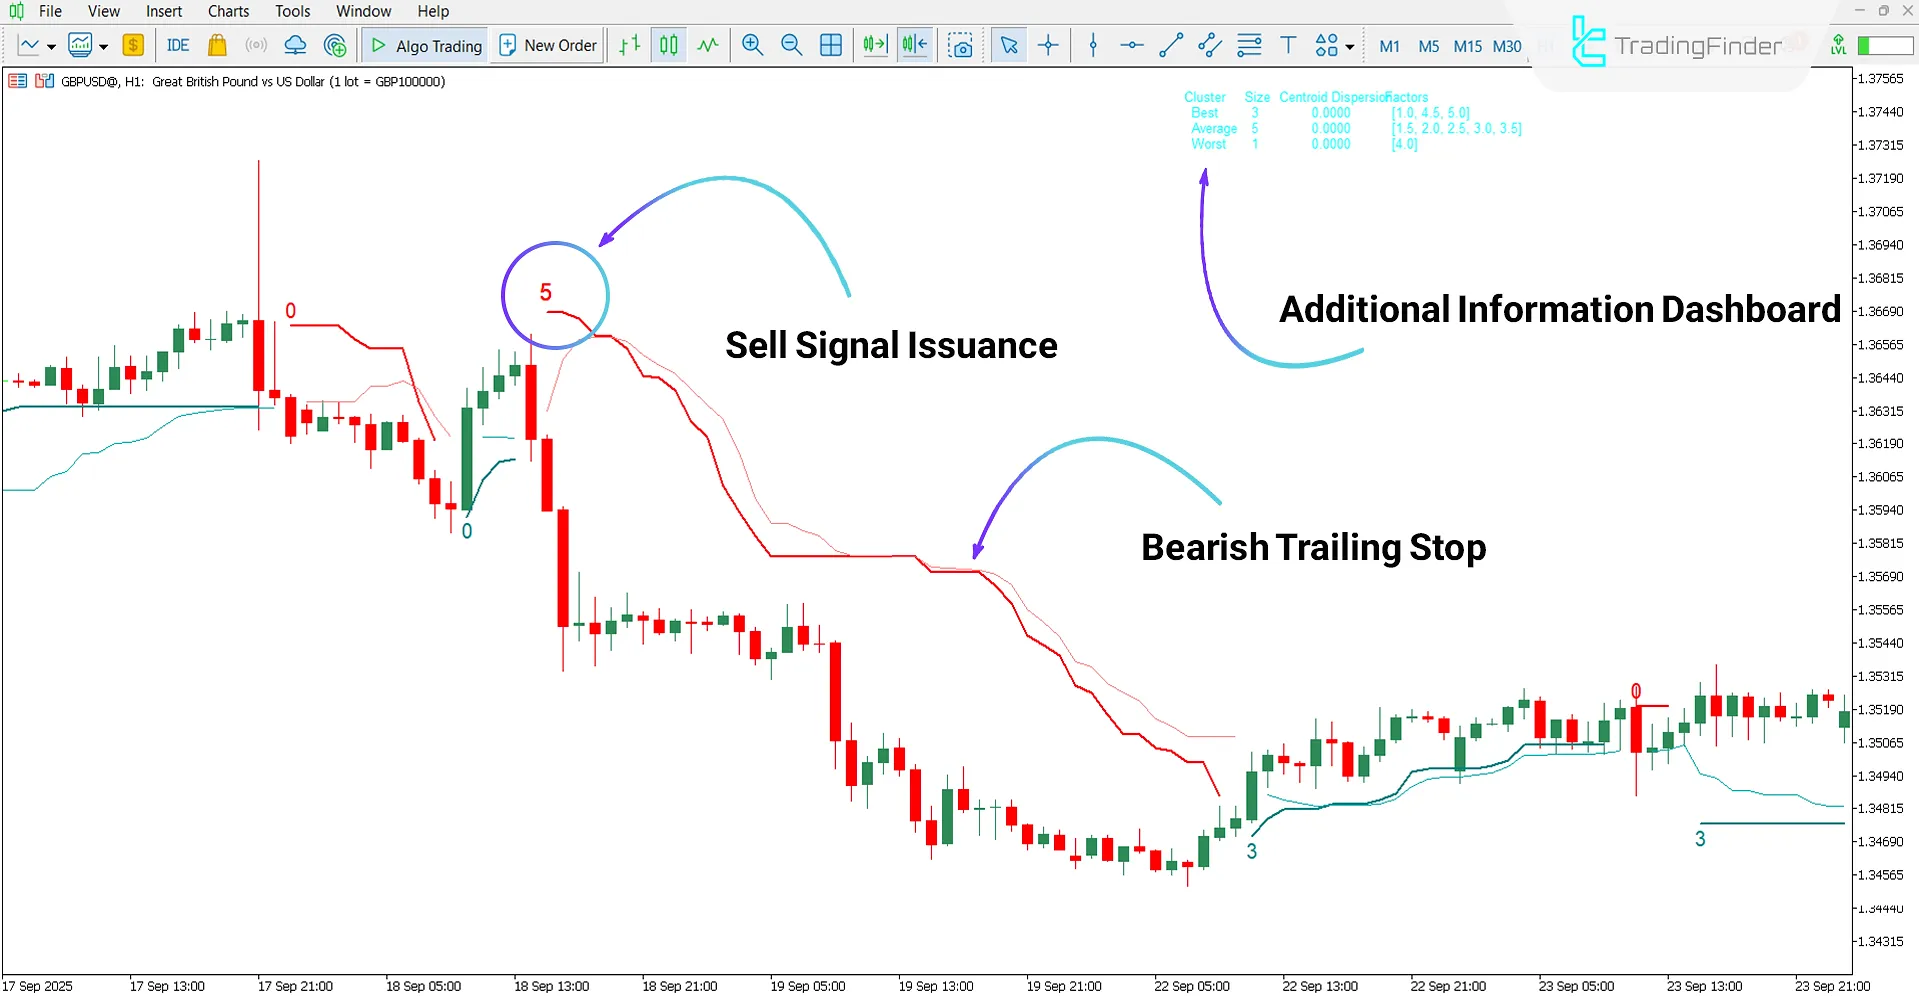
Based on the one-hour GBP/USD chart, label number 5 appears to indicate the optimal point for entering a sell position.
In this case, the red trailing stop acts as a dynamic stop-loss, enabling better risk management during price reversals.

SuperTrend AI Indicator Settings
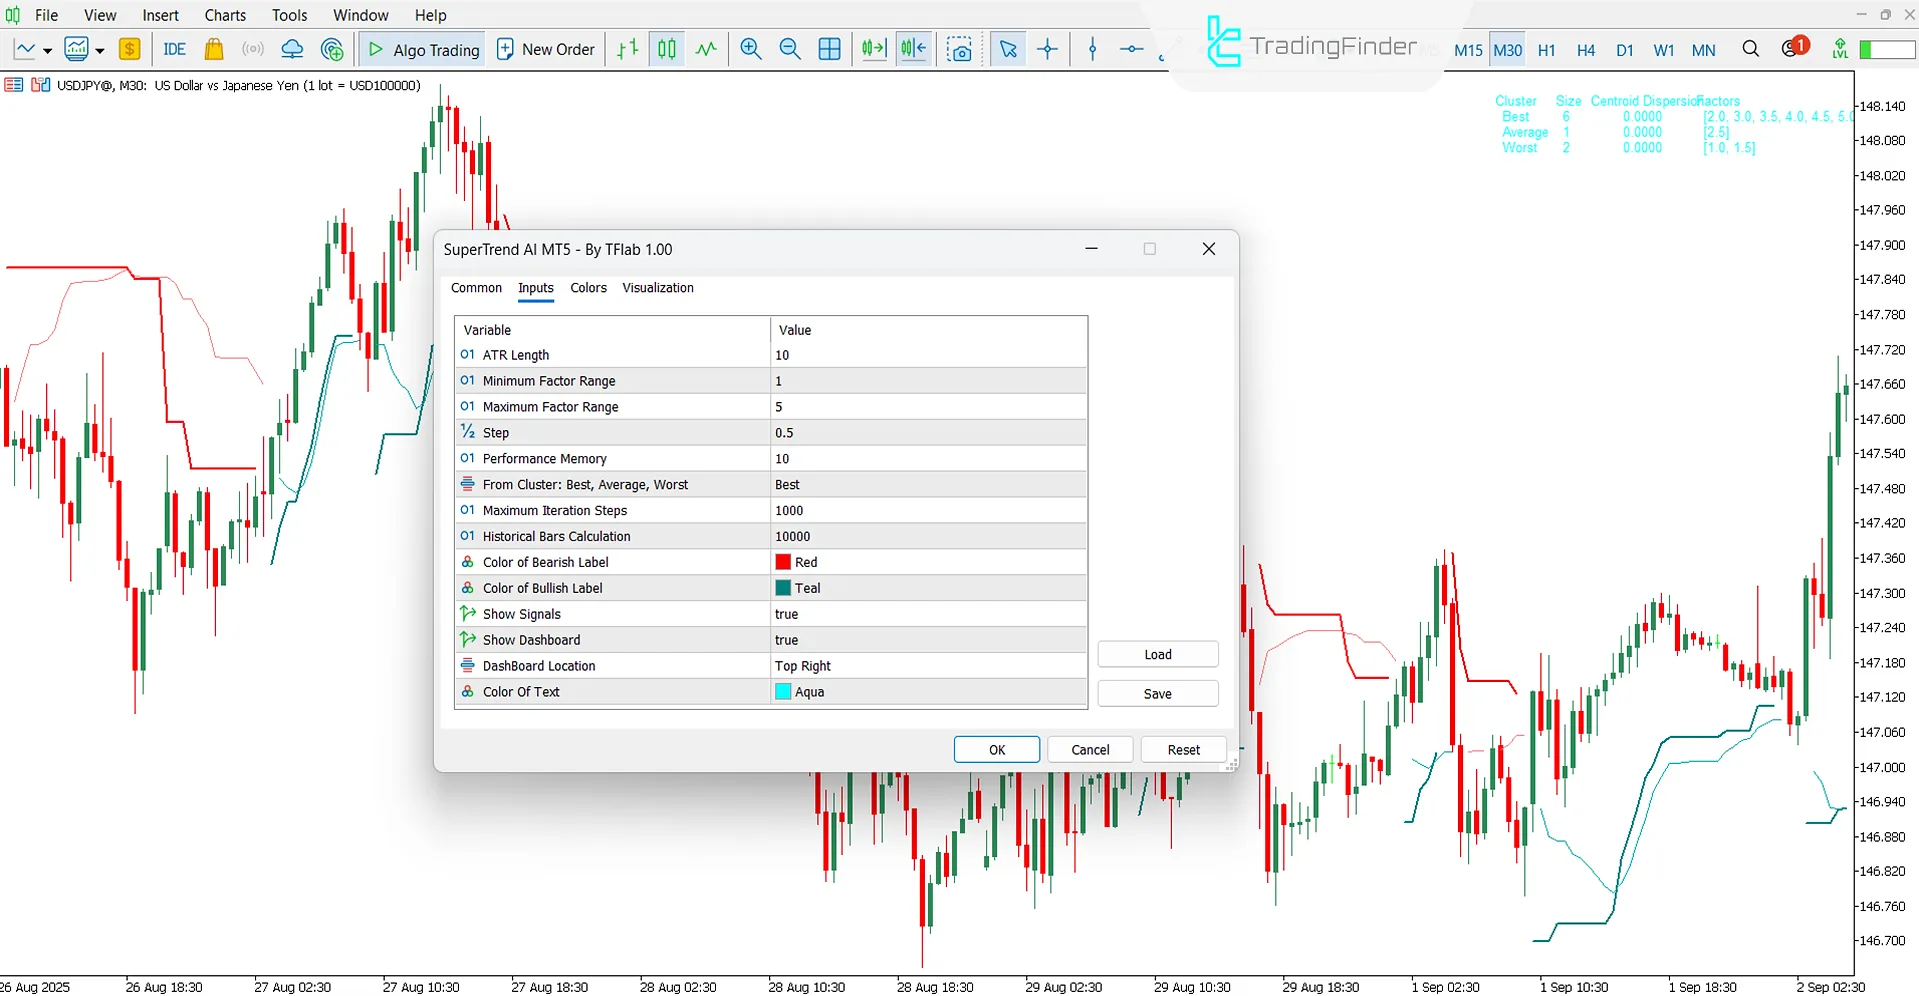
The SuperTrend AI Indicator settings are as follows:

- ATR Length: Number of periods for ATR calculation, price volatility range
- Minimum Factor Range: Minimum factor value, SuperTrend band calculation
- Maximum Factor Range: Maximum factor value, SuperTrend band calculation
- Step: Increment step between factor values, clustering process
- Performance Memory: Stored data points, algorithm performance comparison
- From Cluster (Best, Average, Worst): Selected data type, calculated clusters
- Maximum Iteration Steps: Maximum number of iterations, K-Means algorithm execution
- Historical Bars Calculation: Number of candlesticks, data calculation and analysis
- Color of Bearish Label: Color representation, bearish trend on chart
- Color of Bullish Label: Color representation, bullish trend on chart
- Show Signals: Option display, buy and sell signals
- Show Dashboard: Option display, information dashboard on chart
- Dashboard Location: Placement position, dashboard on chart
- Color Of Text: Text color, information in dashboard
Conclusion
The SuperTrend AI Indicator is designed using a combination of technical analysis and artificial intelligence algorithms, identifying and displaying the overall trend direction through the K-Means clustering method.
Instead of relying on a fixed parameter, this indicator adjusts its output based on the average of the best-performing clusters, thereby tracking trend changes with greater precision and faster reaction.
Furthermore, its internal dashboard includes four key components (Cluster, Size, Centroid Dispersion, and Factors) that simplify the evaluation of computational states and signal reliability.
SuperTrend AI Indicator for MT5 PDF
SuperTrend AI Indicator for MT5 PDF
Click to download SuperTrend AI Indicator for MT5 PDFCan this tool be used in lower timeframes?
Yes, the SuperTrend AI Indicator is multi-timeframe and can be used across all timeframes.
Does this indicator generate buy and sell signals?
Yes, the SuperTrend AI Indicator issues buy and sell signals using visual markers.
Best indicator, love it!


