![Swing Index Indicator for MT5 Download – Free – [TradingFinder]](https://cdn.tradingfinder.com/image/382491/13-121-en-swing-index-mt5-01.webp)
![Swing Index Indicator for MT5 Download – Free – [TradingFinder] 0](https://cdn.tradingfinder.com/image/382491/13-121-en-swing-index-mt5-01.webp)
![Swing Index Indicator for MT5 Download – Free – [TradingFinder] 1](https://cdn.tradingfinder.com/image/382489/13-121-en-swing-index-mt5-02.webp)
![Swing Index Indicator for MT5 Download – Free – [TradingFinder] 2](https://cdn.tradingfinder.com/image/382492/13-121-en-swing-index-mt5-03.webp)
![Swing Index Indicator for MT5 Download – Free – [TradingFinder] 3](https://cdn.tradingfinder.com/image/382490/13-121-en-swing-index-mt5-04.webp)
The Swing Index Indicator is designed to analyze market behavior and evaluate the intensity of price movements.
Based on a composite calculation of price data such as open, close, high, and low, this trading tool aims to provide an accurate view of realpriceshifts.
The output appears on the chart as colored bars, representing the market's strength and potential direction of price movements.
Swing Index Oscillator Specifications Table
The specifications of the Swing Index Oscillator are listed in the table below.
Indicator Categories: | Oscillators MT5 Indicators Signal & Forecast MT5 Indicators Currency Strength MT5 Indicators |
Platforms: | MetaTrader 5 Indicators |
Trading Skills: | Elementary |
Indicator Types: | Reversal MT5 Indicators |
Timeframe: | Multi-Timeframe MT5 Indicators |
Trading Style: | Swing Trading MT5 Indicators Scalper MT5 Indicators Day Trading MT5 Indicators |
Trading Instruments: | Forex MT5 Indicators Crypto MT5 Indicators Stock MT5 Indicators Forward MT5 Indicators |
Swing Index Indicator at a Glance
The Swing Index Indicator provides signals based on the color and size of histogram bars.
When green bars appear, it indicates growing buying pressure and a market inclined toward bullish movement.
Conversely, red bars signal increasing selling pressure and potentially forming a bearish trend.
Bullish Trend Analysis
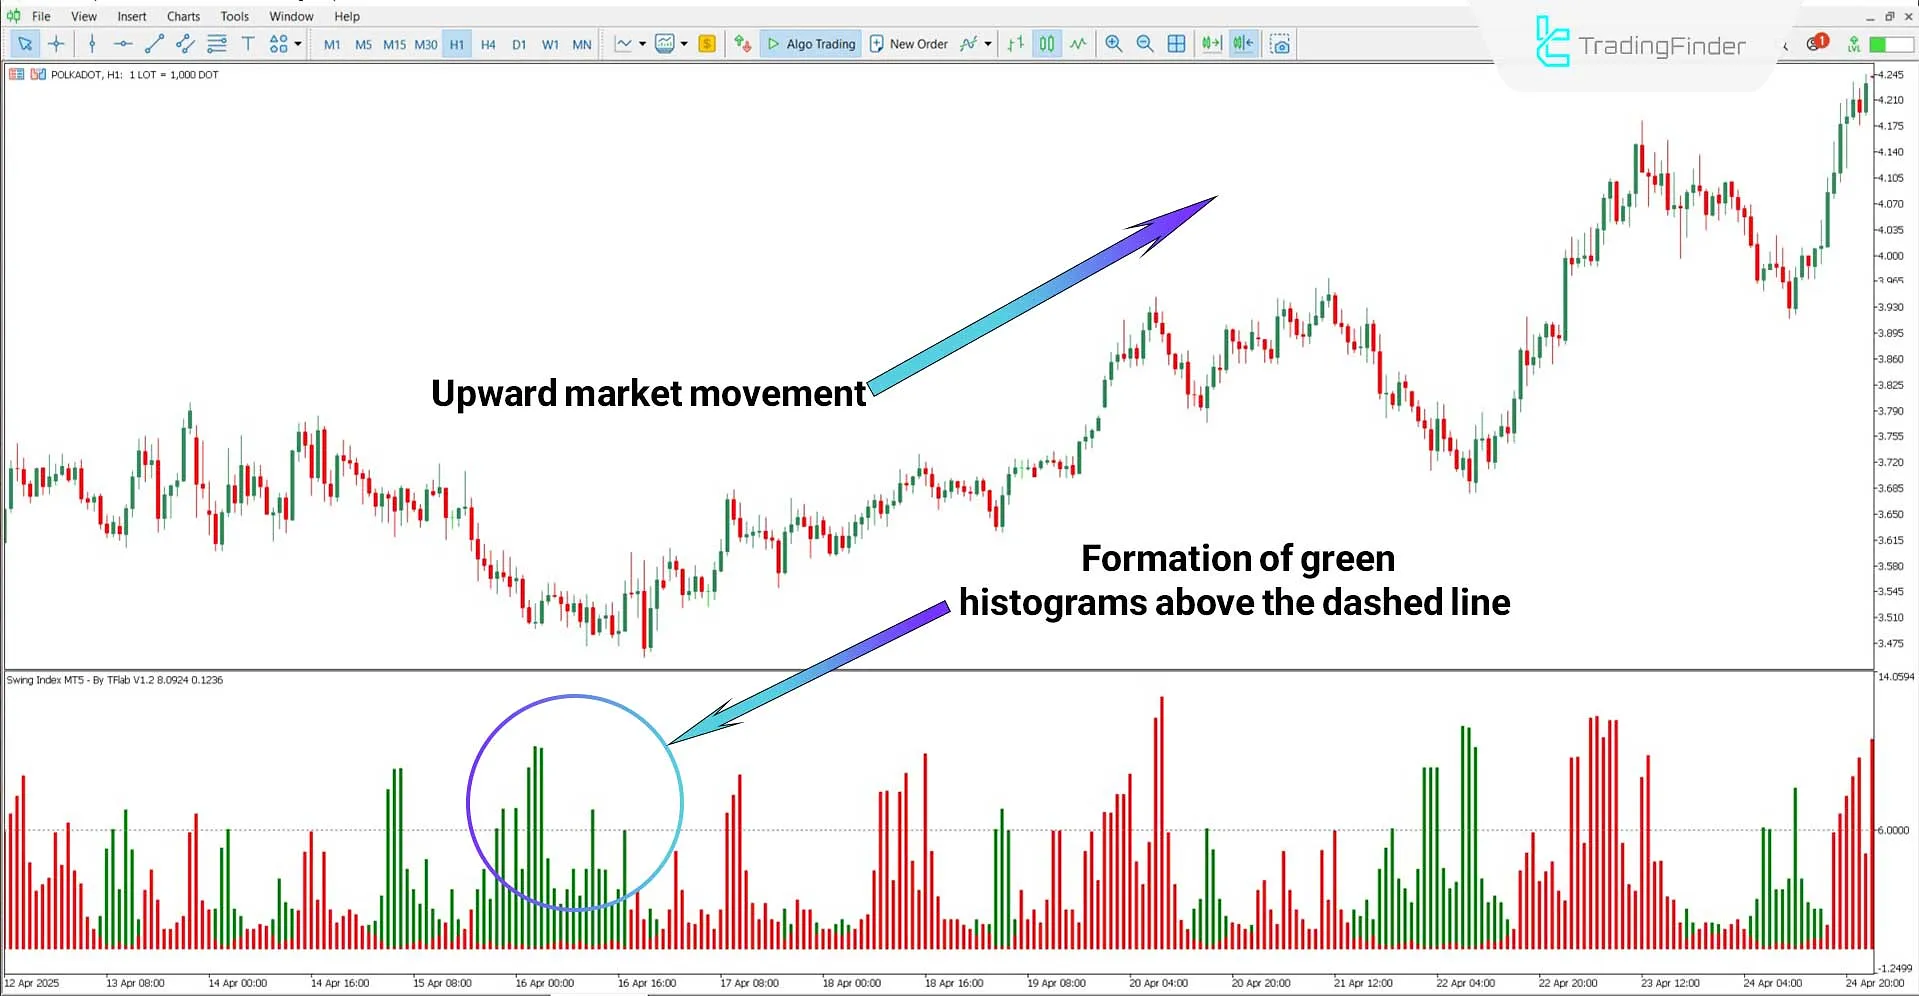
On the 1-hour Polkadot (DOT) chart, the consecutive rise of green histogram bars above the dashed line indicates a strengthening upward momentum in the market.
This increase in momentum and a price trend reversal are interpreted as a confirming signal for the start of a bullish phase.

Bearish Trend Analysis
Based on the 30-minute Silver to US Dollar (XAG/USD) chart, strong red histogram bars suggest a weakening bullish trend and a potential market reversal.
In this context, bars above the dashed line may be an early warning for entering short positions.

Swing Index Indicator Settings
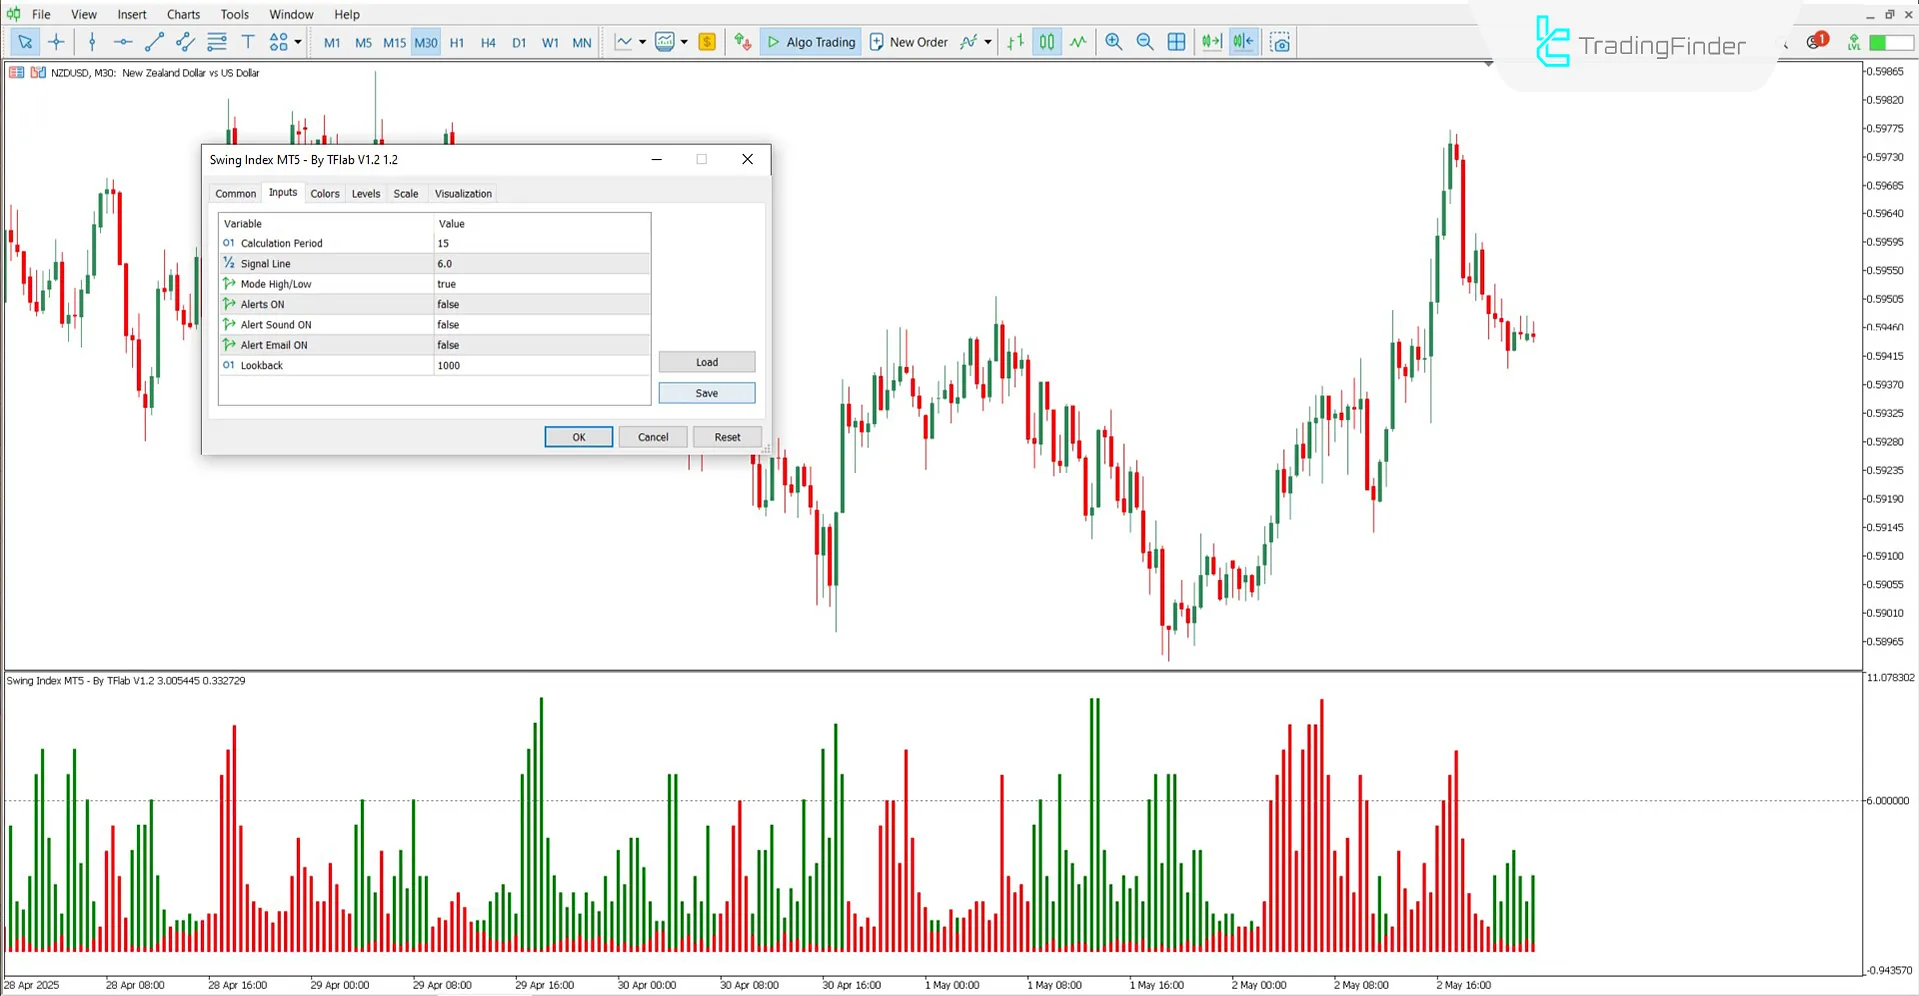
The image below shows the settings of the Swing Index Indicator:

- Calculation Period: Index calculation period
- Signal Line: Signal line calculation
- Mode High/Low: Calculation based on high and low prices
- Alerts ON: Enable alert notifications
- Alert Sound ON: Enable sound alerts
- Alert Email ON: Enable email alerts
- Lookback: Number of past candles to analyze
Conclusion
The Swing Index Oscillator facilitates the identification of market direction and trend strength by accurately analyzing price fluctuations.
Using this tool, traders can determine suitable trade entry and exit points and significantly reduce risk levels.
This indicator is often used in technical analysis with other tools such as moving averages, various types of MACD indicators, and Bollinger Bands.
Swing Index MT5 PDF
Swing Index MT5 PDF
Click to download Swing Index MT5 PDFCan the Swing Index Indicator be used in the stock market?
Yes, this indicator can be applied in all types of markets.
Is this oscillator usable on lower timeframes?
Yes, it is a multi-timeframe tool and can be applied across all time intervals.


